Market Overview
| Study Period | 2019 - 2030 |
| Base Year For Estimation | 2024 |
| Forecast Data Period | 2025 - 2030 |
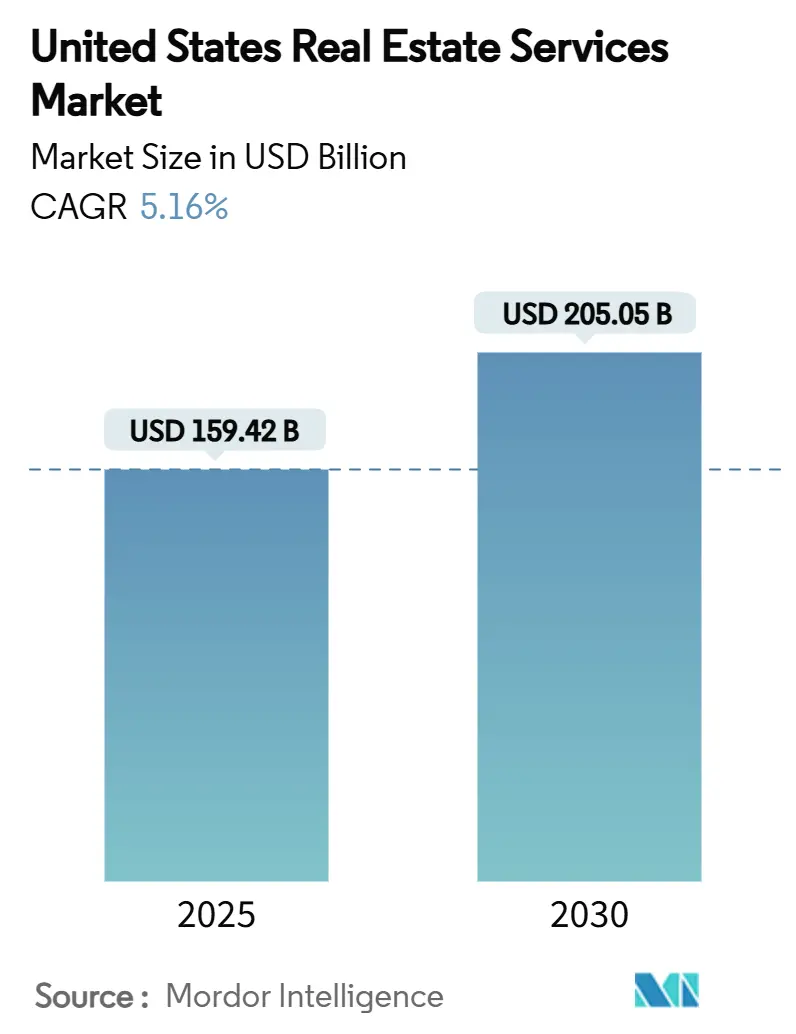
| Market Size (2025) | USD 159.42 Billion |
| Market Size (2030) | USD 205.05 Billion |
| Growth Rate (2025 - 2030) | 5.16% CAGR |
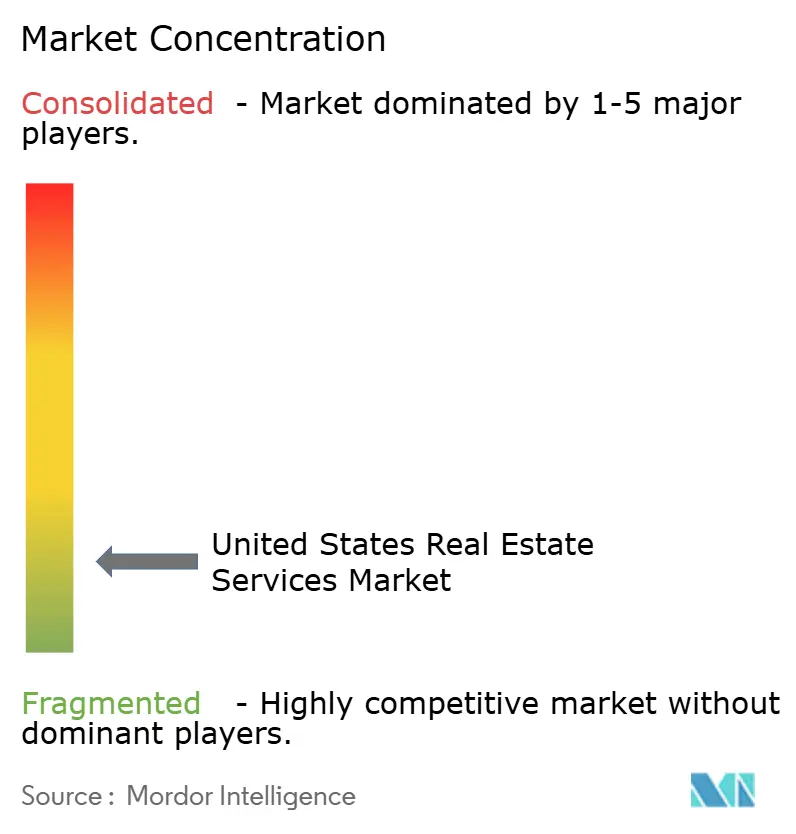
| Market Concentration | Low |
Major Players*Disclaimer: Major Players sorted in no particular order Image © Mordor Intelligence. Reuse requires attribution under CC BY 4.0. |
|

United States Real Estate Services Market Analysis by Mordor Intelligence
The United States real estate services market stands at USD 159.42 billion in 2025 and is forecast to reach USD 205.05 billion by 2030, advancing at a 5.16% CAGR. This trajectory signals continued resilience despite elevated borrowing costs and evolving workplace habits. Institutional capital keeps pouring into single-family rentals and data-rich industrial assets, while office portfolios undergo resizing as hybrid work cements lower daily occupancy. Technology platforms that automate valuations, leasing, and property operations are widening efficiency gaps between digitally enabled firms and traditional brokers. Consolidation is gathering pace as scale becomes vital for regulatory compliance, ESG reporting, and nationwide service delivery, giving well-capitalized players an edge in winning large corporate mandates. Policy changes—including anti-money-laundering rules for residential deals effective December 2025 and the post-settlement overhaul of commission structures—add urgency to business-model innovation across the value chain.
Key Report Takeaways
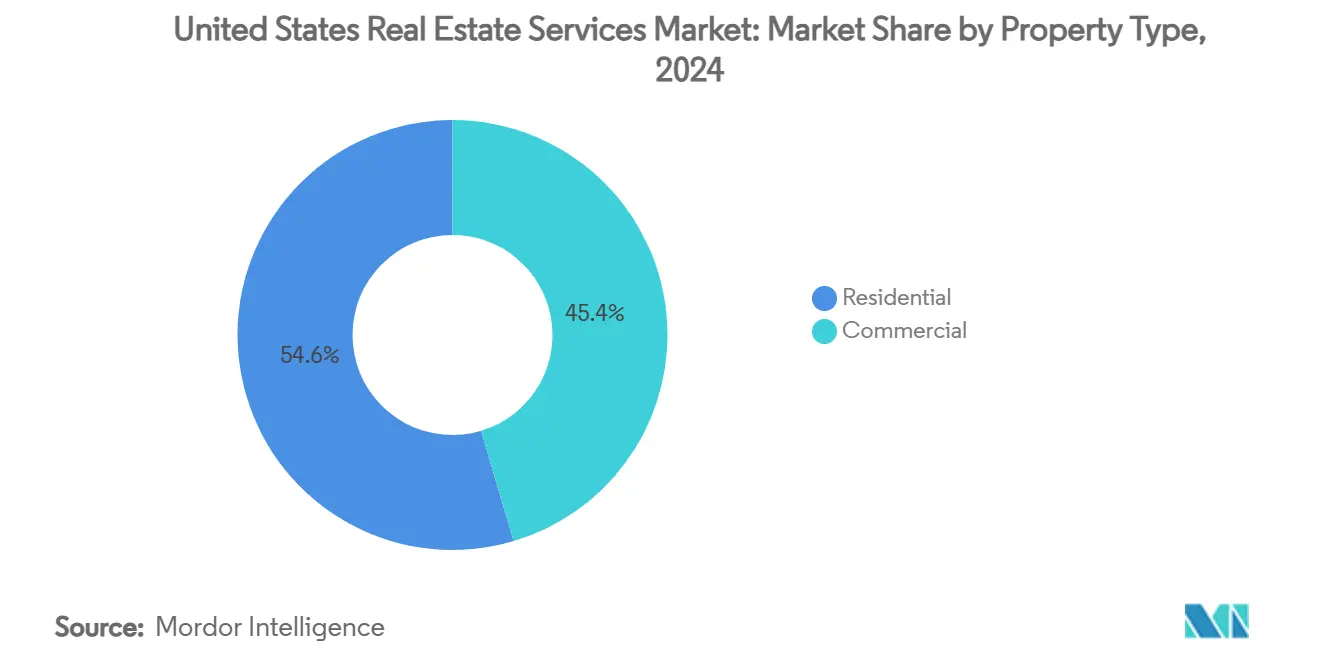
- By property type, residential retained 54.6% of the United States real estate services market share in 2024. The United States real estate services market for commercial properties is projected to expand at a 5.67% CAGR between 2025-2030.
- By service, brokerage services led with 48.9% of the United States real estate services market revenue share in 2024. The United States real estate services market for property management is pacing faster with a 5.84% CAGR between 2025-2030.
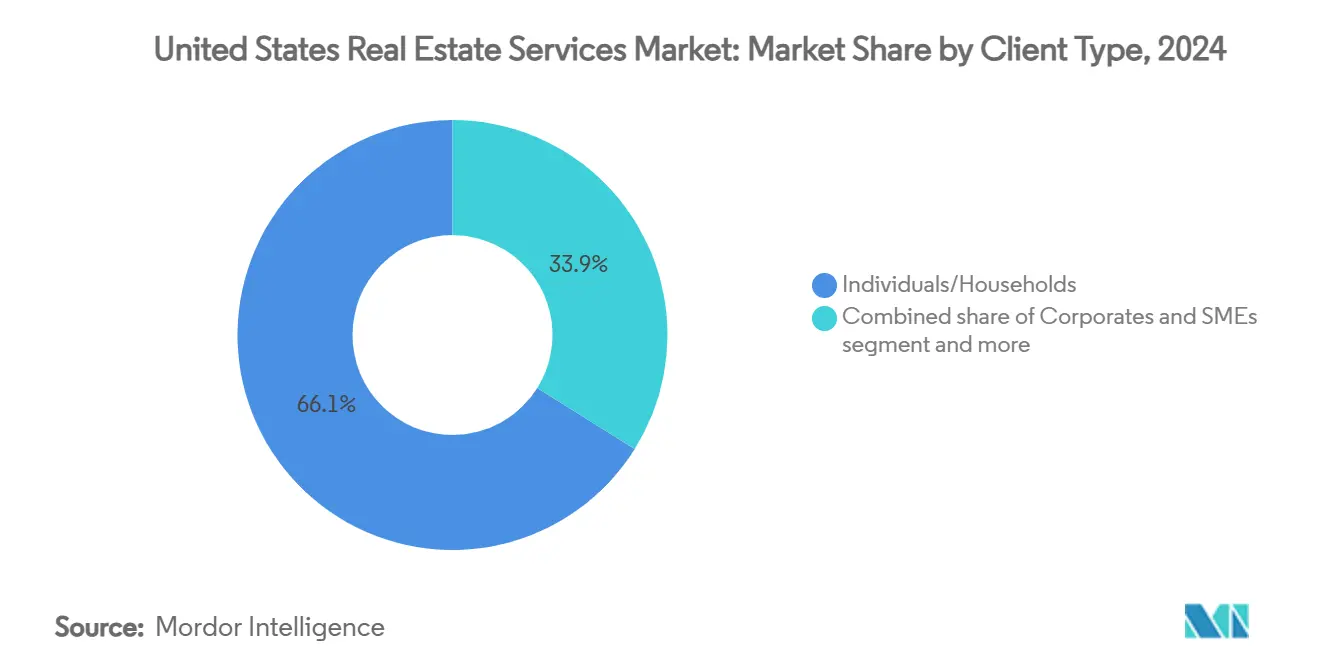
- By client type, individual and household clients accounted for 66.1% of the United States real estate services market size in 2024. The United States real estate services market for corporate and SME demand is rising at a 6.02% CAGR between 2025-2030.
- By state, California commanded 18.7% of the United States' real estate services market size in 2024. The United States real estate services market for Texas is on track for a 6.25% CAGR between 2025-2030.
United States Real Estate Services Market Trends and Insights
Drivers Impact Analysis
| Drivers | (~) % Impact on CAGR Forecast | Geographic Relevance | Impact Timeline |
|---|---|---|---|
| High Activity in Industrial and Data Center Leasing | +1.2% | Virginia, Atlanta, Phoenix, Chicago, Dallas | Short term (≤ 2 years) |
| Migration Patterns and Sunbelt Market Expansion | +0.9% | Texas, Florida, North Carolina, Arizona | Long term (≥ 4 years) |
| Surge in Institutional Investment in Single-Family Rentals (SFRs) | +0.8% | Sunbelt states (Texas, Florida, Georgia) | Medium term (2-4 years) |
| Demand for Portfolio Optimization Due to Hybrid Work | +0.7% | California, New York, Illinois | Medium term (2-4 years) |
| Adoption of PropTech-Enabled Service Delivery | +0.6% | National; early gains in California, New York, Texas | Short term (≤ 2 years) |
| ESG Compliance and Green Certification Requirements | +0.5% | California, New York, Massachusetts, Washington | Long term (≥ 4 years) |
Source: Mordor Intelligence
Surge in Institutional Investment in Single-Family Rentals (SFRs)
Institutional ownership of single-family rentals continues to scale, with major operators lining up 13,000-unit pipelines and keeping average occupancy near 96%[1]Gene L. Dodaro, “Rental Housing: Information on Single-Family Rentals,” U.S. Government Accountability Office, gao.gov. Rental costs remain 28% below ownership expenses in key metros, encouraging large funds to expand Sunbelt portfolios. Demand for valuation, acquisition, and ongoing management work therefore rises in tandem, anchoring steady fee streams even as home sales cool. Service providers able to integrate data-driven sourcing tools and centralized maintenance platforms capture a durable competitive edge.
High Activity in Industrial and Data Center Leasing
Vacancy in primary data-center hubs dropped to 1.9%, and 80% of new capacity is pre-leased before delivery. Industrial absorption stays robust as e-commerce, AI training, and cloud computing raise power-dense space requirements. Investors allocated more than USD 6.5 billion to the segment last year, while 97% intend further commitments. The surge translates into recurring leasing, project management, and facility operations assignments for firms versed in high-spec infrastructure.
Migration Patterns and Sunbelt Market Expansion
Forty-six percent of movers chose the South in 2024, citing family proximity and affordability. Interstate relocation unlocks brokerage commissions in both origin and destination markets and increases demand for property managers as owners convert former residences to rentals. Texas, Florida, and North Carolina, therefore, enjoy expanding pipelines of residential and small-business clients, underpinning predictable, long-term growth for localized providers.
Demand for Portfolio Optimization Due to Hybrid Work
Office attendance sits 30% below 2019 levels, pushing companies to trim space by an estimated 20% by 2030. As 90% of large employers embed hybrid policies, seat-sharing ratios climb above 1.5, and 36% of desks are unused on a typical day. Corporations consequently seek analytics-driven advisory support on lease restructuring, space-as-a-service models, and workplace change management, delivering sticky, higher-margin mandates to consultative firms.
Restraints Impact Analysis
| Restraints | (~) % Impact on CAGR Forecast | Geographic Relevance | Impact Timeline |
|---|---|---|---|
| Persistently High Interest Rates and Financing Costs | -1.1% | Nationwide; acute in California, New York | Short term (≤ 2 years) |
| Volatility in Commercial Real Estate (CRE) Valuations | -0.8% | Office-heavy metros | Medium term (2-4 years) |
| Tech Layoffs and Downsizing Impacting Office Demand | -0.6% | California, Washington, New York | Medium term (2-4 years) |
| Rising Insurance and Operational Costs in Disaster-Prone Areas | -0.4% | Florida, California, Texas Gulf Coast | Long term (≥ 4 years) |
Source: Mordor Intelligence
Persistently High Interest Rates and Financing Costs
With the Federal Reserve holding policy rates at 4.5%, bank lending for commercial deals remains 65% below pre-pandemic norms, and CMBS loans in special servicing exceed USD 51 billion[2]Martin J. Gruenberg, “Quarterly Banking Profile Q1 2025,” Federal Deposit Insurance Corporation, fdic.gov. Elevated borrowing costs shrink the buyer pool and prolong bid-ask gaps, curbing transaction volumes and trimming success-based fees. Advisory demand rises, yet revenue mix shifts toward lower-margin consulting until capital markets stabilize.
Volatility in Commercial Real Estate (CRE) Valuations
Office vacancies reached 34.5% in San Francisco, and U.S. vacancy is set to top 19% in 2025, upending valuation benchmarks. Price discovery grows complex across multifamily and retail as well, forcing service firms to recalibrate models frequently. Extended underwriting cycles reduce deal velocity, but heightened uncertainty boosts demand for rigorous appraisal and scenario-planning engagements.
Segment Analysis
By Property Type: Commercial Growth Outpaces Residential Stability
Residential assets accounted for 54.6% of the United States real estate services market in 2024, anchored by institutional expansion in single-family rentals and steady home-buying pipelines. Operators such as American Homes 4 Rent keep occupancy near 96%, sustaining fee visibility. In contrast, commercial assets—still smaller in absolute terms—are projected to log a 5.67% CAGR, underscoring the pull of data centers, industrial logistics, and selective, high-amenity office clusters. Within commercial, data-center vacancy sits at 3%, and 80% of new builds are fully committed prior to delivery. These dynamics illustrate how specialized know-how in power procurement, ESG reporting, and mission-critical operations fetch premium pricing. The residential subsector remains resilient, but commercial services are set to widen their revenue mix through 2030 as occupiers prioritize efficiency and digital backbone capacity.
The divergence forces service firms to rebalance talent and capital toward growth areas. Providers deep in residential retain predictable annuity streams, yet competitive intensity rises as proptech entrants automate tenant onboarding and maintenance workflows. Conversely, commercial teams able to finance and deliver complex industrial and hyperscale digital campuses secure multi-year contracts with global tenants, insulating margins. Accordingly, the United States real estate services market rewards platforms that blend residential scale with commercial specialization.
By Service: Property Management Accelerates Beyond Brokerage Dominance
Brokerage maintained a 48.9% slice of the United States real estate services market share in 2024, reflecting its historic role in matching buyers, sellers, and tenants. Transactional work, however, is cyclical; providers, therefore, accelerate expansion into property management, which is tracking a 5.84% CAGR. Demand stems from corporates outsourcing facilities oversight and landlords pursuing data-driven operating efficiency. Platforms such as JLL Falcon use AI to flag mechanical faults and optimize energy loads, cutting costs and elevating tenant satisfaction. The service shift aligns with commission-reform headwinds in residential brokerage, where fee take-rates may fall up to 30% under new rules[3]Jerome H. Powell, “Monetary Policy Report to the Congress,” Board of Governors of the Federal Reserve System, federalreserve.gov. Valuation and advisory lines also grow as clients seek clarity on volatile asset pricing, underscoring the benefit of diversified revenue stacks.
Successful managers now bundle leasing, maintenance, and capital-planning dashboards, capturing a larger wallet share. As IoT sensors and building-automation systems become mainstream, property managers run predictive models that pre-empt equipment failure and schedule repairs during low-use periods. Tenants reward such performance through longer renewals, while owners channel operating savings into ESG upgrades, keeping management fees sticky. Brokerage remains indispensable for market velocity, yet property-management scale offers more stable earnings across cycles.
By Client Type: Corporate Outsourcing Drives Accelerated Growth
Individuals and households generated 66.1% of revenue in 2024, reinforcing the consumer foundation of the United States real estate services industry. Nevertheless, corporate and SME clients are expanding fastest at 6.02% CAGR, as enterprises redirect non-core real-estate functions to specialized vendors. Hybrid work adoption creates a need for occupancy analytics, rightsizing, and amenity programming—services rarely housed in-house. Providers equipped with workplace-strategy teams and technology dashboards win retainer-based contracts that scale across multi-state portfolios.
Institutional investors and government agencies supply steady flows of assignments, particularly on ESG compliance and adaptive-reuse projects. Yet corporate demand magnifies upside potential because decisions are often made at headquarters but executed nationally, allowing integrators to bundle brokerage, program management, and facilities operations for margin expansion. As commission compressions impact consumer segments, the higher complexity of enterprise mandates offers refuge and upside for diversified players.
Note: Segment shares of all individual segments available upon report purchase
Geography Analysis
California held 18.7% of the United States real estate services market size in 2024, underpinned by lofty asset values and a dense concentration of technology employers. Stringent carbon-reporting laws translate into outsized consulting engagement volume, while PropTech adoption runs ahead of the national curve, giving local firms a first-mover advantage in AI-driven asset optimization. Office rationalization remains a drag in San Francisco, yet biotech growth in South San Francisco and mixed-use repositioning along Peninsula corridors buffer service demand. High insurance premiums and zoning complexities raise barriers, allowing established advisers to command premium fee spreads.
Texas posts the quickest climb at a 6.25% CAGR through 2030 on the back of corporate in-migration, favorable fiscal policy, and outsized industrial construction. Dallas–Fort Worth and Austin attract hyperscale data-center and logistics developments, each feeding brokerage, project-management, and property-operation pipelines. Residential activity stays brisk, supported by population gains and relative affordability compared with coastal metros. This dual-engine backdrop positions Texas as the breakout driver of incremental service revenue during the forecast window.
Florida, New York, and Illinois round out the leading tier, each harboring sector-specific catalysts. Florida benefits from year-round tourism, which fortifies hospitality-management demand, though rising insurance costs test operator margins. New York retains global capital-markets pre-eminence, sustaining advisory and valuation work even as CBD offices contend with higher vacancies. Illinois leverages central-U.S. distribution advantages and ongoing manufacturing reshoring to support industrial leasing. Secondary markets—from Tennessee’s distribution corridor to Arizona’s chip-fabrication push—also capture spillover investment, underscoring the breadth of opportunity across the United States real estate services market.
Competitive Landscape
The marketplace remains moderately fragmented, yet consolidation is steady as scale advantages sharpen. CBRE’s USD 1 billion purchase of J&J Worldwide Services widened its defense and government channel, while Rocket Companies’ USD 1.75 billion acquisition of Redfin welded mortgage origination to residential brokerage in an integrated platform. Industry leaders are augmenting diversification plays—CBRE folded Turner & Townsend into a USD 3 billion project-management division and invested USD 400 million to acquire coworking operator Industrious, embedding flexible space within its lineup.
Technology remains a pivot. JLL rolled out the Falcon AI suite, harnessing proprietary data plus generative models to streamline cash-flow forecasting and maintenance scheduling. Mid-tier operators pursue cloud-native CRMs and smart-building integrations to remain competitive on cost and insight. Meanwhile, commission-structure reforms born of the National Association of Realtors settlement pressure traditional split models, elevating tech-enabled discount brokers and flat-fee platforms. ESG advisory, data-center facility management, and Sunbelt residential build-to-rent emerge as white-space niches attracting both incumbents and venture-backed entrants.
Barriers to entry hinge on licensing, capital requirements, and increasingly tight AML compliance for residential deals starting December 2025. Established players leverage embedded compliance teams and national footprints to reassure institutional buyers, whereas newcomers often partner with broker-of-record networks to overcome regulatory hurdles. Overall, strategic mergers, digital transformation, and specialization define the race to capture share within the United States real estate services market.
United States Real Estate Services Industry Leaders
-
CBRE Group Inc.
-
Jones Lang LaSalle Incorporated (JLL)
-
Cushman & Wakefield PLC
-
Brookfield Properties LLC
-
HomeServices of America Inc.
- *Disclaimer: Major Players sorted in no particular order
Need More Details on Market Players and Competitors?
Download PDF
Recent Industry Developments
- July 2025: Rocket Companies completed its USD 1.75 billion acquisition of Redfin, unlocking projected synergies above USD 200 million and USD 60 million in fresh revenue opportunities.
- April 2025: Compass entered advanced talks to buy Berkshire Hathaway Home Services of America, potentially creating the largest U.S. brokerage by transaction volume.
- January 2025: CBRE Group finalized a USD 400 million purchase of the remaining equity in coworking provider Industrious, forming a new Building Operations & Experience segment.
- October 2024: JLL launched the AI-powered platform JLL Falcon, making generative models available to 47,000 professionals through an integrated GPT workspace.
United States Real Estate Services Market Report Scope
Market players in the company provide services like property management, valuation services, etc. Property management is the supervision of residential, commercial, and industrial properties, including apartments, detached houses, condominium units, and shopping centers. Real estate appraisal, property valuation, or land valuation is the process of developing an opinion of value for real property. The US Real Estate Services Market is Segmented by Type (Residential, Commercial, and Other Property Types) and Service (Property Management, Valuation Services, and Other Services). The report offers market size and forecasts for the US Real Estate Services Market in value (USD billion) for all the above segments.
| By Property Type | Residential | Single-Family | |
| Multi-Family | |||
| Commercial | Office | ||
| Retail | |||
| Logistics | |||
| Others | |||
| By Service | Brokerage Services | ||
| Property Management Services | |||
| Valuation Services | |||
| Others | |||
| By Client Type | Individuals / Households | ||
| Corporates & SMEs | |||
| Others | |||
| By State | Texas | ||
| California | |||
| Florida | |||
| New York | |||
| Illinois | |||
| Rest of US | |||
By Property Type
| Residential | Single-Family |
| Multi-Family | |
| Commercial | Office |
| Retail | |
| Logistics | |
| Others |
By Service
| Brokerage Services |
| Property Management Services |
| Valuation Services |
| Others |
By Client Type
| Individuals / Households |
| Corporates & SMEs |
| Others |
By State
| Texas |
| California |
| Florida |
| New York |
| Illinois |
| Rest of US |
Need A Different Region or Segment?
Customize Now
Key Questions Answered in the Report
What is the current size of the United States real estate services market?
The market is valued at USD 159.42 billion in 2025 and is projected to reach USD 205.05 billion by 2030, supported by a 5.16% CAGR.
Which property type is growing fastest?
Commercial services—particularly data centers and industrial logistics—are forecast to grow at a 5.67% CAGR, outpacing the still-dominant residential segment.
How are commission reforms affecting brokerage firms?
The National Association of Realtors’ settlement may lower buyer-side commissions by up to 30%, compelling brokers to adopt tech-enabled efficiencies and diversify into advisory and property-management services.
Why is Texas considered a high-growth geography?
Corporate relocation, strong population inflows, and robust industrial development drive a 6.25% CAGR for real estate services revenue in the state.
What role does technology play in property management today?
AI platforms such as JLL Falcon and building-automation systems deliver predictive maintenance and energy optimization, boosting tenant satisfaction and reducing operating costs for owners.
How are high interest rates impacting real estate transactions?
Rates at 4.5% increase financing costs, narrow buyer pools, and keep transaction volumes below historical levels, although they simultaneously raise demand for advisory support on capital sourcing and valuation.
Page last updated on: July 7, 2025

