Market Overview
| Study Period | 2020 - 2030 |
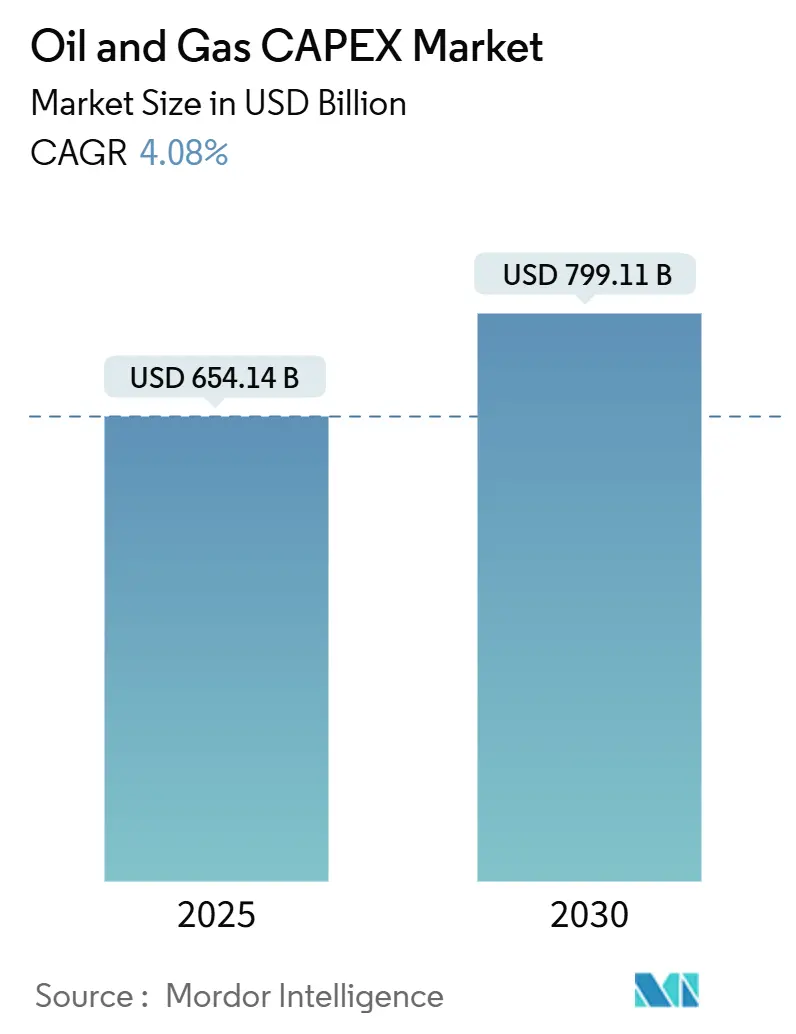
| Market Size (2025) | USD 654.14 Billion |
| Market Size (2030) | USD 799.11 Billion |
| Growth Rate (2025 - 2030) | 4.08% CAGR |
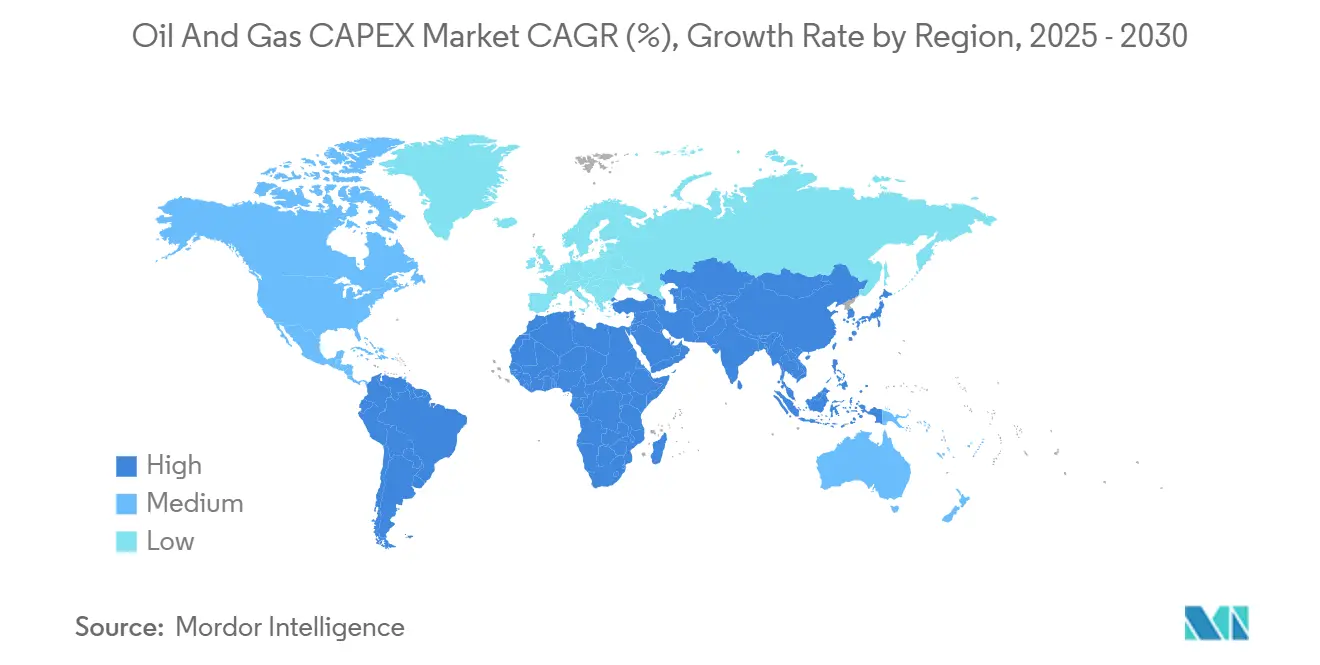
| Fastest Growing Market | Asia Pacific |
| Largest Market | Asia Pacific |
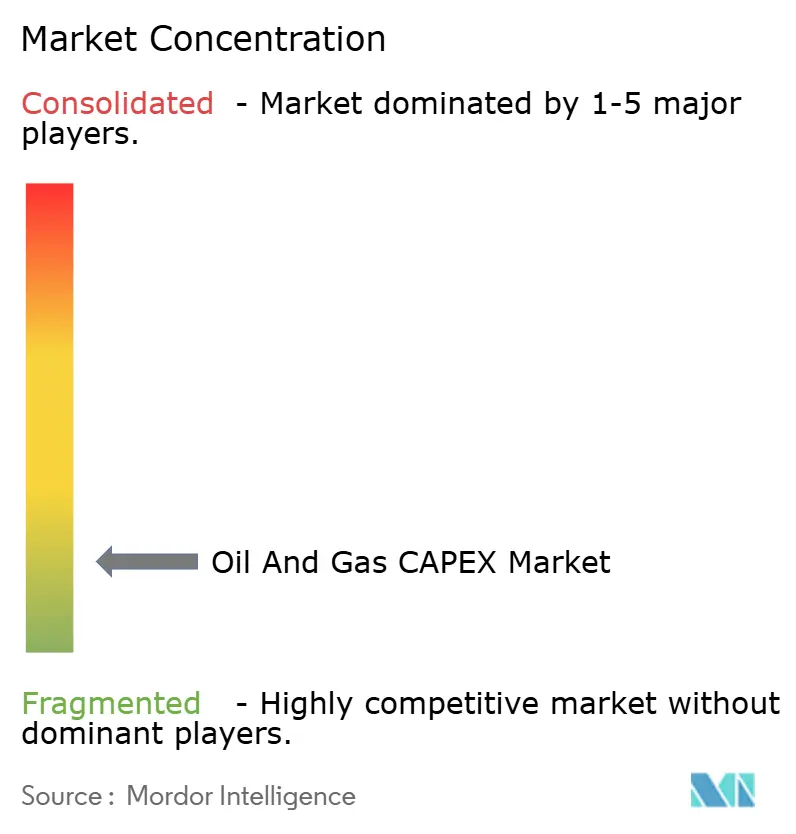
| Market Concentration | Low |
Major Players*Disclaimer: Major Players sorted in no particular order Image © Mordor Intelligence. Reuse requires attribution under CC BY 4.0. |
|
Oil And Gas CAPEX Market Analysis by Mordor Intelligence
The Oil And Gas CAPEX Market size is estimated at USD 654.14 billion in 2025, and is expected to reach USD 799.11 billion by 2030, at a CAGR of 4.08% during the forecast period (2025-2030).
Operators funnel capital toward high-return projects that protect cash flows during volatile price cycles while positioning portfolios for a multi-decade energy transition. Deepwater, LNG, and brownfield decarbonization programs dominate the spending slate because they combine competitive economics with strategic relevance. Tight discipline on full-cycle break-evens prompts faster final investment decisions (FIDs) and a visible shift from frontier exploration to development drilling. Consolidation among integrated majors and national oil companies (NOCs) unlocks scale efficiencies, while digital technologies trim project overruns and lower operating costs. Strategic finance remains a watchpoint as ESG-linked covenants tighten access to debt and raise the hurdle rate for green-light decisions.
Key Report Takeaways
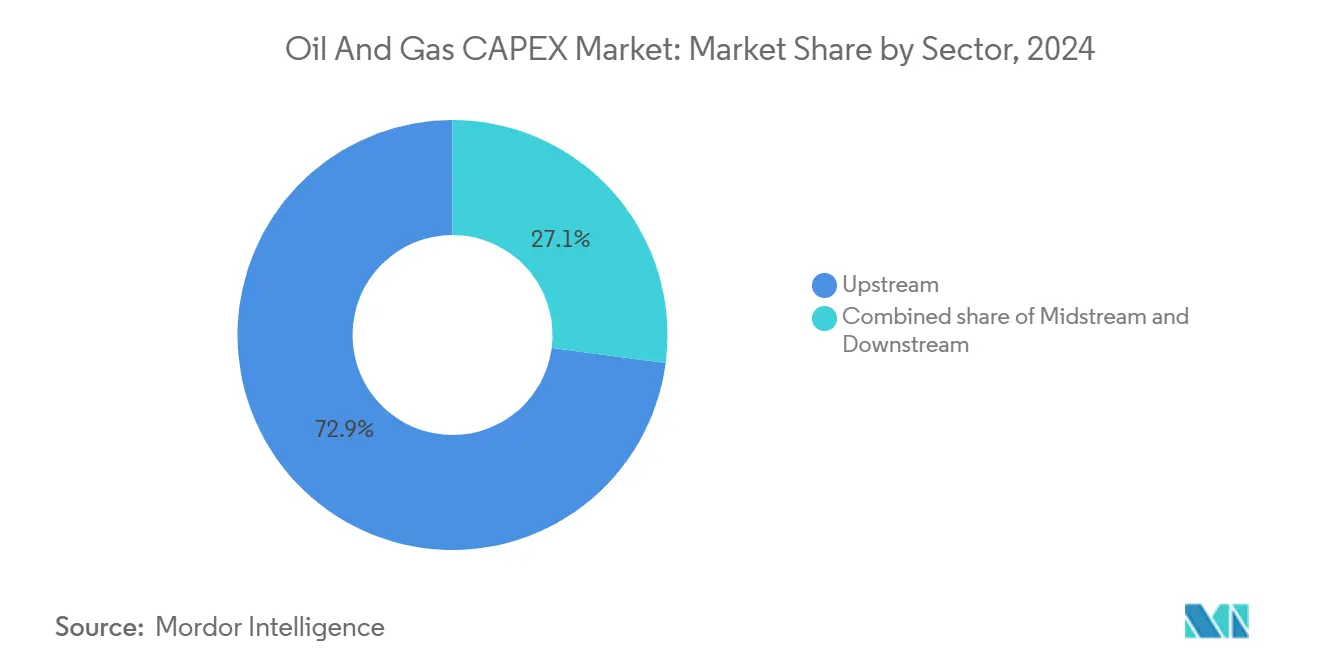
- By sector, upstream held 72.92% of the oil and gas capex market share in 2024 and is advancing at a 4.20% CAGR through 2030.
- By location, onshore operations accounted for 79.53% of the oil and gas capex market size in 2024, whereas offshore spending is expanding at an 8.90% CAGR.
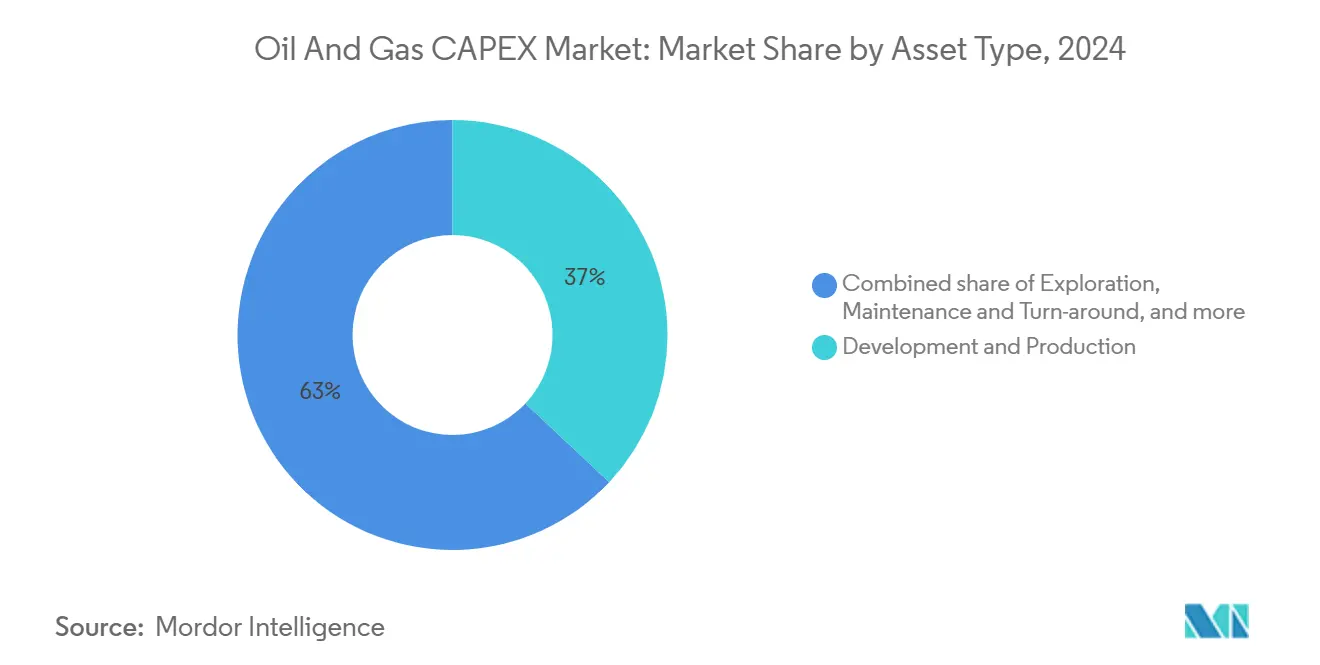
- By asset type, the development and production segment captured 37% of the oil and gas capex market size in 2024 and is projected to grow at a 6% CAGR.
- By geography, the Asia-Pacific commanded 29% revenue share in 2024; Asia-Pacific is also forecasted to register the fastest 4.86% CAGR to 2030.
Global Oil And Gas CAPEX Market Trends and Insights
Drivers Impact Analysis
| Driver | (~) % Impact on CAGR Forecast | Geographic Relevance | Impact Timeline |
|---|---|---|---|
| Increasing LNG‐ready gas infrastructure build-out | +1.20% | North America, Asia-Pacific, global spill-over | Medium term (2-4 years) |
| Rising deep-water discoveries driving FIDs | +0.90% | Gulf of Mexico, West Africa, Brazil | Medium term (2-4 years) |
| NOC upstream spending rebound in Middle East & Asia | +0.80% | Middle East & Asia, knock-on to Africa | Short term (≤2 years) |
| Surge in “maintenance CAPEX” to decarbonise brownfields | +0.70% | OECD core, gradually global | Long term (≥4 years) |
| Digital twin roll-outs cutting project overruns | +0.40% | North America & Europe lead, global adoption | Medium term (2-4 years) |
| Sub-1 MW modular FLNG attracting small-field sanctioning | +0.30% | Africa & Southeast Asia, global interest | Long term (≥4 years) |
Source: Mordor Intelligence
Understand The Key Trends Shaping This Market
Download PDF
Increasing LNG-Ready Gas Infrastructure Build-Out
Long-term offtake contracts and structurally tight gas balances have catalyzed LNG megaprojects such as Woodside’s USD 17.5 billion Louisiana facility and the Corpus Christi Stage 3 expansion.[1]Offshore Energy, "LNG Project Pipeline," offshore-energy.biz Developers are extending spend beyond liquefaction into processing, pipelines, and storage, creating multiplier effects throughout the oil and gas capex market. First-mover positions in regions with stranded gas—illustrated by NextDecade’s Rio Grande LNG offtake with Saudi Aramco—are projected to lock in decades of free cash flow.
Rising Deep-Water Discoveries Driving FIDs
Cost deflation in subsea kit and standardized project models has dropped deepwater breakevens below USD 50 per barrel, pushing projects like BP’s USD 5 billion Kaskida and TotalEnergies’ USD 6 billion Kaminho to sanction. Therefore, the oil and gas capex market sees robust order books for specialized rigs, SURF and FPSO contractors, with 2025 offshore EPC opportunities estimated at USD 54 billion.
NOC Upstream Spending Rebound in Middle East & Asia
PTTEP’s USD 5.3 billion 2025 program and similar moves by PetroChina and CNOOC illustrate how governments prioritize energy security while exploiting low-cost resource bases.[2]Source: Journal of Petroleum Technology, "NOC Investment Programs," jpt.spe.org The investment surge has pulled international service companies back into the region, reinforcing near-term support for the oil and gas capex market.
Surge in “Maintenance CAPEX” to Decarbonize Brownfields
Regulatory carbon penalties lead operators like Equinor and Essar to retrofit CCUS hubs, methane leak detection, and energy-efficiency systems.[3]Source: Reuters, "Carbon Reduction Initiatives," reuters.com Maintenance budgets previously plateaued are now outpacing new-build spend growth, shifting the oil and gas capex market mix toward brownfield upgrades.
Restraints Impact Analysis
| Restraint | (~) % Impact on CAGR Forecast | Geographic Relevance | Impact Timeline |
|---|---|---|---|
| Volatility in Dated Brent discouraging long-cycle projects | -0.8% | Global, notably deepwater & Arctic | Short term (≤2 years) |
| Policy pivots toward renewables in OECD | -0.6% | OECD; global sentiment spill-over | Long term (≥4 years) |
| Scarcity-pricing of Tier-1 EPC labour elevating costs | -0.5% | North America & Europe, global knock-on | Medium term (2-4 years) |
| ESG-linked debt covenants capping fossil CAPEX ceilings | -0.4% | Europe & North America nexus, expanding worldwide | Medium term (2-4 years) |
Source: Mordor Intelligence
Volatility in Dated Brent Discouraging Long-Cycle Projects
Brent's USD 68-93 range in 2024 masked sharp intraday swings that complicate NPV calculations for projects with 7-10 year paybacks.[4]Source: International Energy Agency, "Energy Investment Trends," iea.org Lenders have responded by raising hurdle rates and tightening stress-test scenarios, effectively screening out marginal oil and gas capex market opportunities. Citi's forecast of prices potentially dropping into the USD 60s by 2025 further discourages long-cycle commitments.
Policy Pivots Toward Renewables in OECD
Clean energy investments reached USD 2 trillion in 2024 versus USD 1 trillion for fossil fuels, reflecting policy tailwinds for transition spending. Paradoxically, European majors are scaling back renewables to protect hydrocarbon returns, with BP halting 18 hydrogen projects and Shell revising carbon targets.
Segment Analysis
By Sector: Upstream Dominance Driven by FID Acceleration
Upstream activities command 72.92% of the oil and gas capex market share 2024, benefiting from a 6% CAGR forecast through 2030 as operators accelerate final investment decisions on high-return deepwater and unconventional projects. The sector's growth momentum reflects strategic repositioning toward short-cycle developments that adapt quickly to commodity price fluctuations while maintaining competitive returns. Major upstream investments include BP's USD 5 billion Kaskida project and Chevron's Future Growth Project at Tengiz, which commenced production in January 2025 with the capacity to increase output by 260,000 barrels per day. Midstream operations focus on critical infrastructure bottlenecks, particularly LNG processing and pipeline capacity expansions that enable upstream production growth. With companies prioritizing maintenance CAPEX over capacity additions, downstream investments remain constrained by margin pressures and uncertain long-term demand projections.
Digital transformation reshapes upstream project execution through AI-enabled drilling optimization and predictive maintenance systems that reduce operational costs and improve recovery rates. SLB's major AI-enabled deepwater drilling contract demonstrates how technology adoption is becoming essential for competitive positioning in complex reservoir developments. The upstream sector's CAPEX allocation increasingly emphasizes production optimization over exploration, reflecting lessons learned from previous cycles where discovery-focused strategies generated insufficient returns. Companies leverage advanced seismic imaging and reservoir modeling to maximize output from existing fields rather than pursuing speculative exploration programs. This production-centric approach aligns with investor demands for capital discipline and near-term cash flow generation while maintaining long-term reserve replacement ratios.
Note: Segment shares of all individual segments available upon report purchase
By Location: Offshore Growth Outpaces Onshore Despite Scale Disadvantage
Onshore operations maintain an 80% oil and gas capex market share in 2024, leveraging lower development costs and established infrastructure networks, while offshore segments are experiencing accelerated 8.9% CAGR growth driven by technological advances and major deepwater discoveries. The offshore growth trajectory reflects improved project economics through standardized subsea equipment and enhanced drilling techniques that reduce breakeven costs below USD 50 per barrel for many developments. Chevron's Ballymore project in the Gulf of America exemplifies how offshore developments can achieve competitive returns through efficient subsea tieback strategies and optimized production profiles. Onshore investments continue to focus on shale optimization and enhanced recovery techniques that maximize output from existing acreage positions. The location-based investment split reflects risk-adjusted return calculations where onshore projects offer more predictable execution timelines despite potentially lower ultimate recovery rates.
Floating production systems enable offshore development in previously inaccessible water depths and harsh environments, with FLNG technology particularly attractive for remote gas discoveries that cannot support traditional pipeline infrastructure. The offshore EPC market is projected to reach USD 61 billion in 2024, representing a 47% increase from the previous year despite project delays and inflationary pressures. Onshore operations benefit from established supply chains and workforce availability, though rising labor costs and environmental regulations are increasing project complexity and execution timelines. The geographic distribution of investments reflects resource availability and regulatory environments, with operators increasingly selective about jurisdictions that offer stable fiscal terms and predictable permitting processes.
By Asset Type: Development Focus Reflects Capital Discipline
Development and Production activities represent 37% of the oil and gas capex market size 2024, growing at 7% CAGR as operators prioritize maximizing output from discovered resources over speculative exploration programs. This strategic shift reflects investor demands for capital discipline and near-term cash flow generation, with companies focusing on projects with proven reserves and established production profiles. Exploration investments remain constrained by uncertain commodity price outlooks and limited appetite for high-risk, long-cycle developments that may not generate returns for multiple years. Maintenance and Turn-around activities are experiencing increased investment as operators extend facility lifecycles and implement decarbonization upgrades to meet evolving environmental standards. Decommissioning expenditures are accelerating in mature basins where aging infrastructure requires systematic retirement and environmental remediation.
The asset-type allocation reflects fundamental changes in industry risk tolerance and return expectations, with companies preferring development projects that can deliver production within 2-3 years rather than exploration programs with 7-10 year payback periods. Hess Corporation's launch of an electric fracturing fleet in North Dakota demonstrates how operators invest in production optimization technologies that reduce emissions while improving operational efficiency. Maintenance CAPEX increasingly focuses on digital upgrades and automation systems that reduce operating costs and improve safety performance across aging infrastructure. The development emphasis is creating sustained demand for production enhancement services, including artificial lift systems, water management solutions, and reservoir optimization technologies. Companies are discovering that incremental development investments often generate superior returns compared to greenfield exploration, particularly in regions with established infrastructure and known geological characteristics.
Note: Segment shares of all individual segments available upon report purchase
Geography Analysis
Asia-Pacific emerges as the largest (29% of the market share in 2024) and the fastest-growing regional oil and gas capex market with 5% CAGR through 2030, reflecting energy security imperatives and substantial NOC investment programs designed to reduce import dependence and capture domestic market growth. PTTEP's USD 5.3 billion CAPEX plan for 2025 demonstrates how regional operators prioritize upstream gas development and LNG supply chain investments to serve domestic consumption and export opportunities. The region's growth momentum is supported by rising electricity demand driven by economic development and data center expansion, with companies like Chevron establishing major engineering centers in India to capture cost advantages and local market opportunities. Chinese and Indian NOCs are accelerating domestic exploration and development programs while pursuing international acquisitions that secure long-term resource access. However, regional operators face increasing financing challenges as international banks implement ESG-linked lending restrictions. APAC oil and gas firms generate 96% of revenues from fossil fuel activities compared to more diversified global peers.
North American and European markets are experiencing divergent trends, with North America benefiting from shale production optimization and LNG export infrastructure development while Europe focuses increasingly on maintenance CAPEX and decarbonization projects. North American operators like Devon Energy and EOG Resources demonstrate exceptional capital discipline. Devon generated USD 1 billion in free cash flow during Q1 2025 while reducing CAPEX guidance by USD 100 million, investing.com. Though companies continue to invest in existing operations and carbon capture technologies, European investments are constrained by regulatory pressures and renewable energy policies that discourage new fossil fuel development. The regional divergence reflects different regulatory environments and resource endowments, with North American shale providing flexibility to adjust production levels based on commodity prices while European operators navigate more restrictive policy frameworks. South American markets remain focused on deepwater developments and infrastructure projects that can serve domestic energy security needs and export market opportunities, though political stability and regulatory consistency continue to influence international operator participation levels.
Middle East and Africa market is driven by abundant low-cost reserves and supportive government policies that encourage domestic and international development. The region benefits from production costs often below USD 20 per barrel and established infrastructure networks that reduce development timelines and CAPEX requirements compared to frontier regions. Saudi Aramco and other regional NOCs are implementing substantial upstream expansion programs while investing in downstream integration and petrochemical facilities that capture higher value-added margins throughout the hydrocarbon value chain. ExxonMobil's planned USD 1.5 billion deepwater investment in Nigeria exemplifies how international operators prioritize the region despite global energy transition pressures. The region's CAPEX growth is supported by long-term supply contracts with Asian buyers and strategic positioning for anticipated global supply tightness during the energy transition period. However, operators must navigate evolving ESG expectations and potential demand destruction in traditional export markets as renewable energy adoption accelerates.
Competitive Landscape
The global oil and gas capex market exhibits increasing consolidation as major operators pursue scale advantages and portfolio optimization through strategic acquisitions, with USD 250 billion in transactions completed during 2024, including ExxonMobil's USD 64.5 billion Pioneer Natural Resources acquisition and Chevron's USD 60 billion Hess Corporation deal. This consolidation wave reflects strategic positioning for long-term competitiveness as companies seek to reduce unit costs, eliminate operational redundancies, and concentrate resources on the highest-return assets. The competitive intensity drives technological differentiation through digital transformation initiatives, with companies like SLB and TotalEnergies forming 10-year partnerships to integrate AI-driven solutions that can reduce project costs by 10-15%. Market leaders leverage superior balance sheet strength to pursue counter-cyclical acquisitions and maintain investment discipline during commodity price volatility, creating competitive moats through operational excellence and capital efficiency.
White-space opportunities are emerging in small-scale LNG development, carbon capture and storage, and digital oilfield services, where technological innovation can unlock previously uneconomical resources or create new revenue streams. Smaller operators and service companies are finding success through specialization in niche technologies like modular FLNG systems and AI-enabled production optimization, with companies like New Fortress Energy demonstrating how innovative approaches can compete effectively against traditional integrated models. The competitive landscape is increasingly influenced by ESG performance and access to sustainable financing, with operators demonstrating superior emissions management and transition planning gaining preferential access to capital markets. Technology adoption is becoming a key differentiator, with companies investing heavily in automation, artificial intelligence, and digital twin technologies to improve operational efficiency and reduce environmental impact while maintaining competitive cost structures.
Oil And Gas CAPEX Industry Leaders
-
Saudi Aramco
-
PetroChina (CNPC)
-
Exxon Mobil Corporation
-
Shell plc
-
Chevron Corporation
- *Disclaimer: Major Players sorted in no particular order
Need More Details on Market Players and Competitors?
Download PDF
Recent Industry Developments
- May 2025: Tourmaline Oil Corp. announced two acquisitions in the NEBC Montney area expected to add approximately 20,000 boepd of production and 369.4 mmboe of reserves, while reporting record Q1 2025 production of 637,867 boepd and total capital expenditures of USD 825 million. The acquisitions demonstrate continued consolidation in Canadian unconventional plays and strategic positioning for LNG Canada facility start-up.
- April 2025: Oil States International reported its strongest backlog since 2015 at USD 357 million, driven by a USD 25 million contract for a deepwater production facility in Brazil. The company generated USD 9 million in cash flow from operations, reversing previous negative trends.
- April 2025: Chevron commenced oil and natural gas production from the Ballymore subsea tieback in the Gulf of America, targeting 300,000 net barrels per day by 2026 with estimated recoverable resources of 150 million barrels of oil equivalent. The project was completed on time and budget, demonstrating improved execution capabilities in deepwater developments.
- November 2024: EQT Corp. announced a USD 1.8 billion acquisition of Olympus Energy Holdings, adding 500 MMscf/D production capacity and 90,000 net acres in Pennsylvania's Marcellus and Utica shale plays. The acquisition increases EQT's sales volume guidance by 25 Bcfe to 2.3 Tcfe for 2025.
Global Oil And Gas CAPEX Market Report Scope
Capital expenditure (CAPEX) is the funds used by a company/organization to acquire, upgrade, and maintain physical assets, such as property, plants, buildings, technology, or equipment. CAPEX is often used to undertake new projects or investments by a company. The global oil and gas CAPEX market consider the total capital expenditure of oil and gas operators worldwide annually. The CAPEX/investments in the upstream, midstream, and downstream oil and gas projects across different regions are taken into consideration while estimating the market size.
The oil & gas CAPEX market is segmented by sector, location and geography. By sector, the market is segmented into upstream, midstream, and downstream. By location, the market is segmented into onshore and offshore. The report also covers the market size and forecasts for the oil & gas CAPEX market across major regions. For each segment, the market sizing and forecasts have been done based on revenue (USD).
| By Sector | Upstream | ||
| Midstream | |||
| Downstream | |||
| By Location | Onshore | ||
| Offshore | |||
| By Asset Type | Exploration | ||
| Development and Production | |||
| Maintenance and Turn-around | |||
| Decommissioning | |||
| By Geography | North America | United States | |
| Canada | |||
| Mexico | |||
| Europe | Norway | ||
| United Kingdom | |||
| Russia | |||
| Netherlands | |||
| Germany | |||
| Rest of Europe | |||
| Asia Pacific | China | ||
| India | |||
| Japan | |||
| South Korea | |||
| ASEAN Countries | |||
| Australia | |||
| Rest of Asia Pacific | |||
| South America | Brazil | ||
| Argentina | |||
| Colombia | |||
| Rest of South America | |||
| Middle East and Africa | Saudi Arabia | ||
| United Arab Emirates | |||
| Qatar | |||
| Nigeria | |||
| South Africa | |||
| Rest of Middle East and Africa | |||
By Sector
| Upstream |
| Midstream |
| Downstream |
By Location
| Onshore |
| Offshore |
By Asset Type
| Exploration |
| Development and Production |
| Maintenance and Turn-around |
| Decommissioning |
By Geography
| North America | United States |
| Canada | |
| Mexico | |
| Europe | Norway |
| United Kingdom | |
| Russia | |
| Netherlands | |
| Germany | |
| Rest of Europe | |
| Asia Pacific | China |
| India | |
| Japan | |
| South Korea | |
| ASEAN Countries | |
| Australia | |
| Rest of Asia Pacific | |
| South America | Brazil |
| Argentina | |
| Colombia | |
| Rest of South America | |
| Middle East and Africa | Saudi Arabia |
| United Arab Emirates | |
| Qatar | |
| Nigeria | |
| South Africa | |
| Rest of Middle East and Africa |
Need A Different Region or Segment?
Customize Now
Key Questions Answered in the Report
What is the current size of the oil and gas CAPEX market?
The global oil and gas CAPEX market reached USD 918.59 billion in 2025 and is projected to grow to USD 1.132 trillion by 2030, representing a 4.27% CAGR.
Which sector receives the most investment in oil and gas CAPEX?
Upstream activities command the largest share at 61% of the oil and gas CAPEX market in 2024, growing at a 6% CAGR through 2030 as companies prioritize development of deepwater discoveries and unconventional resources.
How is the energy transition affecting oil and gas CAPEX?
The energy transition is reshaping CAPEX allocation with increased investment in decarbonization of existing assets, LNG infrastructure, and digital technologies that improve efficiency, while traditional exploration spending faces constraints from ESG-linked financing restrictions.
What regions are seeing the fastest growth in oil and gas investments?
Asia-Pacific is the fastest-growing region with a 5% CAGR through 2030, driven by energy security concerns and NOC investments, while the Middle East and Africa maintain the largest market share at 32%.
How are digital technologies impacting oil and gas CAPEX?
Digital technologies like AI, digital twins, and automation are reducing project costs by 10-15% and improving schedule adherence by 20-30%, making them essential competitive differentiators rather than optional upgrades.
What are the major constraints on oil and gas CAPEX growth?
Key constraints include oil price volatility discouraging long-cycle projects, OECD policy shifts toward renewables, skilled labor shortages driving cost inflation, and ESG-linked debt covenants restricting access to capital for fossil fuel developments.
Page last updated on: July 4, 2025

