
Real-Time 3D (RT3D) Visualization Platforms Market Size and Share
Market Overview
| Study Period | 2020 - 2031 |
|---|---|
| Market Size (2026) | USD 4.85 Billion |
| Market Size (2031) | USD 9.76 Billion |
| Growth Rate (2026 - 2031) | 15.01 % |
| Fastest Growing Market | Asia-Pacific |
| Largest Market | North America |
| Market Concentration | Medium |
Major Players *Disclaimer: Major Players sorted in no particular order Image © Mordor Intelligence. Reuse requires attribution under CC BY 4.0. | |
Real-Time 3D (RT3D) Visualization Platforms Market Analysis by Mordor Intelligence
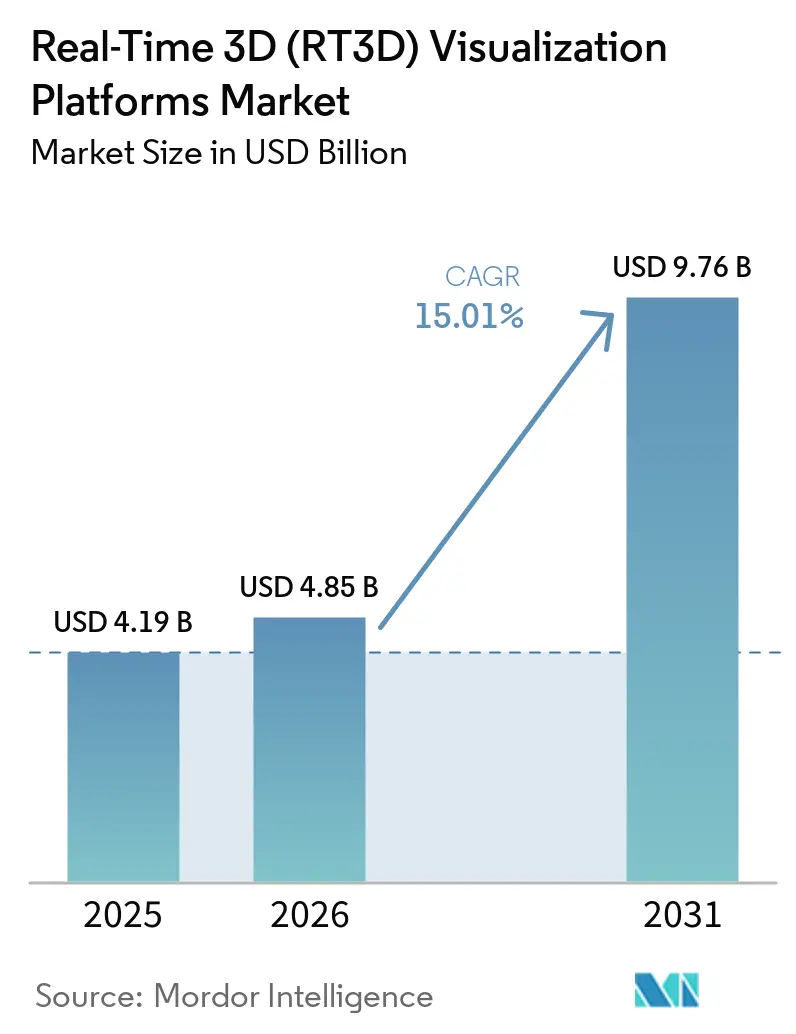
The real-time 3D (RT3D) visualization platforms market size is projected to expand from USD 4.19 billion in 2025 and USD 4.85 billion in 2026 to USD 9.76 billion by 2031, registering a CAGR of 15.01% between 2026 to 2031. The market is moving from separate rendering tools toward connected environments that combine visualization, simulation, and AI. Cloud delivery, OpenUSD interoperability, and AI-assisted asset creation have lowered earlier cost and latency barriers. Manufacturing, energy, and architecture buyers are using these platforms in production settings rather than only for demonstrations. This shift extends demand beyond game engines and visual-effects workflows into operational planning and asset management. Competition is increasing as industrial technology firms place real-time rendering within their digital twin and automation software, while vendors address cost and skilled-labor constraints through managed services and AI-assisted authoring.
Key Report Takeaways
- By component, software held 52.58% of the Real-time 3D (RT3D) visualization platforms market share in 2025, while services is projected to expand at a 15.87% CAGR through 2031.
- By deployment, cloud-based platforms held 55.61% share in 2025, while hybrid and edge-enabled deployment is expected to expand at a 16.04% CAGR through 2031 in the Real-time 3D (RT3D) visualization platforms market.
- By application, digital twins and operational visualization accounted for 18.23% share in 2025, while AR, VR, and metaverse experiences is projected to advance at a 16.21% CAGR through 2031 in the Real-time 3D (RT3D) visualization platforms market.
- By end user, manufacturing and industrial held 19.24% share in 2025, while energy, utilities, and infrastructure is expected to expand at a 15.67% CAGR through 2031.
- By geography, North America held 35.41% of the Real-time 3D visualization platforms market in 2025, while the Middle East is projected to advance at a 15.76% CAGR through 2031.
Note: Market size and forecast figures in this report are generated using Mordor Intelligence’s proprietary estimation framework, updated with the latest available data and insights as of January 2026.
Market Trends and Insights
Drivers Impact Analysis of Real-Time 3D (RT3D) Visualization Platforms Market*
| Driver | (~) % Impact on CAGR Forecast | Geographic Relevance | Impact Timeline |
|---|---|---|---|
| Digital Twin Deployment in Industrial Operations | +4.2% | Global, concentrated in North America, Europe, and Asia-Pacific | Short term (≤ 2 years) |
| Cloud GPU Rendering and Streaming Adoption | +3.5% | Global, with North America and Asia-Pacific leading | Short term (≤ 2 years) |
| Real-Time 3D Use in AEC and BIM Workflows | +2.8% | North America, Europe, and Asia-Pacific | Medium term (2-4 years) |
| Interactive 3D Product Configurator Expansion | +2.5% | North America and Europe, with spillover to Asia-Pacific | Medium term (2-4 years) |
| Immersive Training and Simulation Demand | +2.1% | North America, Europe, and the Middle East | Long term (≥ 4 years) |
| OpenUSD and Interoperable 3D Asset Workflows | +1.5% | Global, with early traction in North America and Europe | Long term (≥ 4 years) |
| Source: Mordor Intelligence | |||
Growth of Digital Twin Deployment in Industrial Operations
Industrial users are moving from static digital models toward active environments that take in live sensor data. These environments help operators test predicted outcomes in real time. ABB integrated its Genix Industrial IoT and AI Suite with NVIDIA Omniverse libraries and Microsoft Azure in 2026. The integration supports anomaly detection and system-health monitoring through continuously updated 3D environments.[1]ABB, “ABB Genix Advances Industrial Digital Twins Through Immersive 3D Visualization With NVIDIA Omniverse and Microsoft Azure,” ABB, new.abb.com. Siemens and PepsiCo demonstrated Digital Twin Composer at manufacturing and warehouse facilities in the United States. The deployment identified up to 90% of potential issues before physical modifications and delivered a 20% throughput improvement in its initial use. The real-time 3D (RT3D) visualization platforms market benefits when visualization becomes part of operational validation rather than a presentation layer. The Digital Twin Consortium also reported production use of multi-agent Front-Running Simulation on a live hydrocarbon processing plant digital twin in July 2026.
Adoption of Cloud GPU Rendering and Streaming
Cloud GPU streaming lets organizations use advanced rendering without buying dedicated on-premises hardware. This model is important for firms that cannot justify large infrastructure investments. NVIDIA brought Blackwell architecture capabilities to GeForce NOW in 2025, including RTX 5080-class performance and DLSS 4 Multi-Frame Generation for streaming at 5K resolution and 120 frames per second.[2]NVIDIA, “NVIDIA Blackwell Architecture Comes to GeForce NOW,” NVIDIA, investor.nvidia.com. These capabilities establish a technical baseline relevant to enterprise rendering pipelines. The real-time 3D (RT3D) visualization platforms market gains access to more mid-sized studios and AEC firms through elastic GPU capacity. Bundled GPU and AI contracts can, however, reduce the margin available to independent rendering-as-a-service providers. Vendors that connect platform licenses with external GPU pools through open APIs are better positioned to manage that pressure.
Increasing Use of Real-Time 3D in AEC and BIM Workflows
Large architecture, engineering, and construction firms now treat building information modeling as a standard operating requirement. The important change is the direct connection between BIM authoring and real-time rendering tools. Maxon launched Redshift for Revit at AIA26 in June 2026 and opened beta access for Redshift for Graphisoft Archicad.[3]Maxon, “Maxon Brings Real-Time Architectural Visualization to AIA26 With New Redshift for Revit and Archicad Integration Beta,” Maxon, maxon.net. This approach removes the separate export step that had slowed visualization workflows. A 2026 peer-reviewed study found that BIM and virtual reality integration improved visual perception and project management. The study also identified interoperability and standardization as continuing constraints. ISO 19650 requirements for structured information management are supporting demand for platforms that can render and validate asset data in compliant workflows. This places the real-time 3D (RT3D) visualization platforms market closer to the core design process.
Expansion of Interactive 3D Product Configurators
Interactive product configurators are becoming more common in furniture, automotive, and consumer electronics selling. The tools help buyers inspect options before placing an order. Threekit launched its AI Sales Agent in June 2026 and reported 229% year-over-year revenue growth for the product. Its platform processed more than 10 million configuration-to-quote sessions each month across 150 enterprise customers. A 2026 study by 3D Cloud found that 80% of users who engaged with a 3D configurator considered it very helpful in building purchase confidence. The study also found that 4 in 10 shoppers who customized furniture used a configurator as their primary decision tool. The real-time 3D (RT3D) visualization platforms market is reaching business buyers as manufacturers adopt self-service configuration alongside traditional CPQ processes. That move broadens demand into industrial distribution and made-to-order production.
Restraints Impact Analysis of Real-Time 3D (RT3D) Visualization Platforms Market*
| Restraint | (~) % Impact on CAGR Forecast | Geographic Relevance | Impact Timeline |
|---|---|---|---|
| High Compute, Licensing, and Integration Costs | -1.2% | Global, most acute in South America, the Middle East, and Africa | Short term (≤ 2 years) |
| Shortage of Specialized Real-Time 3D Talent | -0.9% | Global, concentrated in North America, Europe, and Asia-Pacific | Medium term (2-4 years) |
| Data Governance Risks in Cloud-Hosted 3D Workflows | -0.5% | Europe, Asia-Pacific, and North America | Medium term (2-4 years) |
| Energy Intensity of High-Fidelity Real-Time Rendering | -0.4% | Global, highest in energy-constrained markets | Long term (≥ 4 years) |
| Source: Mordor Intelligence | |||
High Compute, Licensing, and Integration Costs
High-fidelity rendering creates a meaningful cost barrier for organizations with limited technology budgets. GPU investments may compete with other digital transformation priorities, especially outside North America and Western Europe. Epic Games applies a 5% royalty on gross product revenue above USD 1 million for qualifying Unreal Engine products. Its non-game commercial licenses begin at USD 1,850 per seat. Cloud GPU rentals add to those recurring costs for large-scale studios. Connecting RT3D software with legacy PLM, ERP, and IoT systems often requires specialist middleware work. The full deployment cost can therefore exceed the license cost considered during procurement. Delayed implementation can defer go-live dates and near-term vendor revenue.
Shortage of Specialized Real-Time 3D Talent
The available specialist workforce is not keeping pace with demand for advanced RT3D deployments. This constraint is affecting developers, visualization specialists, and implementation teams. The result is that some organizations purchase platform licenses before they have the internal capacity to operate them. Deployment backlogs can weaken the expected return from software subscriptions. The real-time 3D (RT3D) visualization platforms market is therefore supporting managed services and AI-assisted authoring tools that reduce specialized labor needs. Staffing constraints can also increase renewal risk when customers cannot move projects into production within their planned timetable.
*Our forecasts treat driver/restraint impacts as directional, not additive. The impact forecasts reflect baseline growth, mix effects, and variable interactions.
Real-Time 3D (RT3D) Visualization Platforms Market Segment Analysis
By Component:
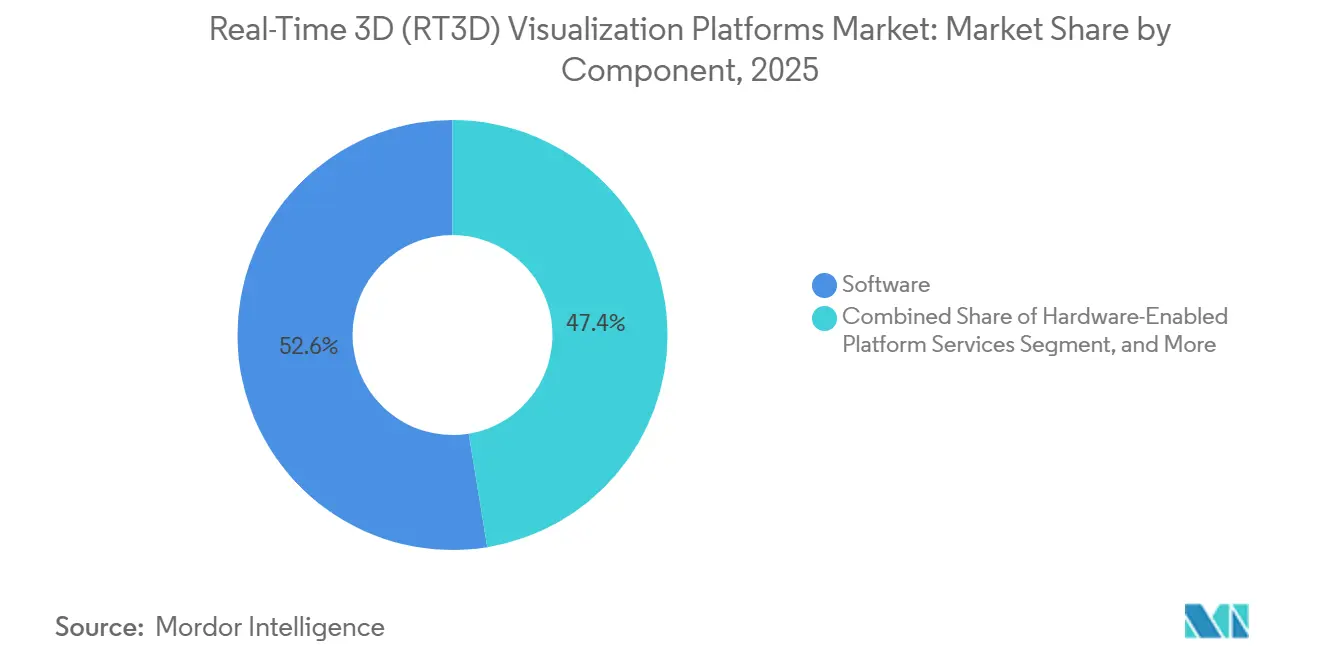
Services Reflect Deeper Enterprise ComplexitySoftware held 52.58% of the real-time 3D (RT3D) visualization platforms market share in 2025, while services is projected to expand at a 15.87% CAGR through 2031. Software revenue includes engine licenses, rendering subscriptions, and workflow platform fees. These products remain central to game development, AEC, and product-design workflows. Services are advancing faster because enterprise deployments often require implementation and managed operations. Hardware-enabled platform services remain the smallest component. Their relevance is increasing as hyperscalers provide colocated GPU rendering as a managed service. Unity reported full-year revenue of USD 1,849.6 million for fiscal year 2025. Its Grow Solutions revenue reached USD 338 million in the fourth quarter, compared with USD 305 million a year earlier. The result supports the view that managed offerings can contribute more strongly as enterprise requirements become more complex. Software will remain the principal revenue base across the real-time 3D (RT3D) visualization platforms industry.
Manufacturing, energy, and healthcare users often need help with deployment, operations, security, and compliance. These needs are less common in smaller standalone visualization projects. Service providers can assist with data connections, workflow design, and user training. This work reduces the burden on enterprise technology teams. It also makes implementation partners more important in purchasing decisions. Platform vendors can use these services to improve onboarding and customer retention. Hardware-enabled services may become more relevant where buyers need predictable rendering performance without owning GPU capacity. The component mix therefore reflects a market that is becoming more operationally embedded. The real-time 3D (RT3D) visualization platforms market will continue to use software licenses as its primary commercial base. Services will capture a larger portion of new spending when internal skills or infrastructure are limited.



By Deployment:
Edge Architecture Supports Industrial RequirementsCloud-based deployment commanded 55.61% of the Real-time 3D visualization platforms market size in 2025, while hybrid and edge-enabled deployment is projected to expand at a 16.04% CAGR through 2031. Cloud platforms are the default option for studios and AEC firms without dedicated rendering hardware. GPU rental also provides a practical path for firms that need capacity only for selected projects. On-premises deployment remains important for organizations with data sovereignty or classified-data requirements. Defense and critical infrastructure users are especially likely to retain local systems. Hybrid and edge deployment supports manufacturing and energy users that need low latency for process control. Industrial digital twins produce continuous sensor data from facilities, substations, and offshore assets. Sending this information repeatedly to a remote cloud can reduce frame rates and slow response times. The real-time 3D (RT3D) visualization platforms market is therefore seeing greater interest in local rendering linked to cloud AI services.
NVIDIA Omniverse libraries used in deployments by ABB and Siemens support low-latency local rendering with cloud-connected AI capabilities. This architecture can keep time-sensitive visual work closer to operational systems. Cloud systems still offer flexible capacity and simplified administration. A hybrid model combines those benefits with local responsiveness. It is particularly relevant for operators that cannot accept long round-trip data paths. Private 5G networks in European and East Asian industrial areas also support this configuration. The deployment decision is increasingly based on data sensitivity, network performance, and operational latency. Edge deployment does not replace cloud delivery across every use case. It expands the real-time 3D (RT3D) visualization platforms market into environments where cloud-only delivery is not sufficient.
By Application:
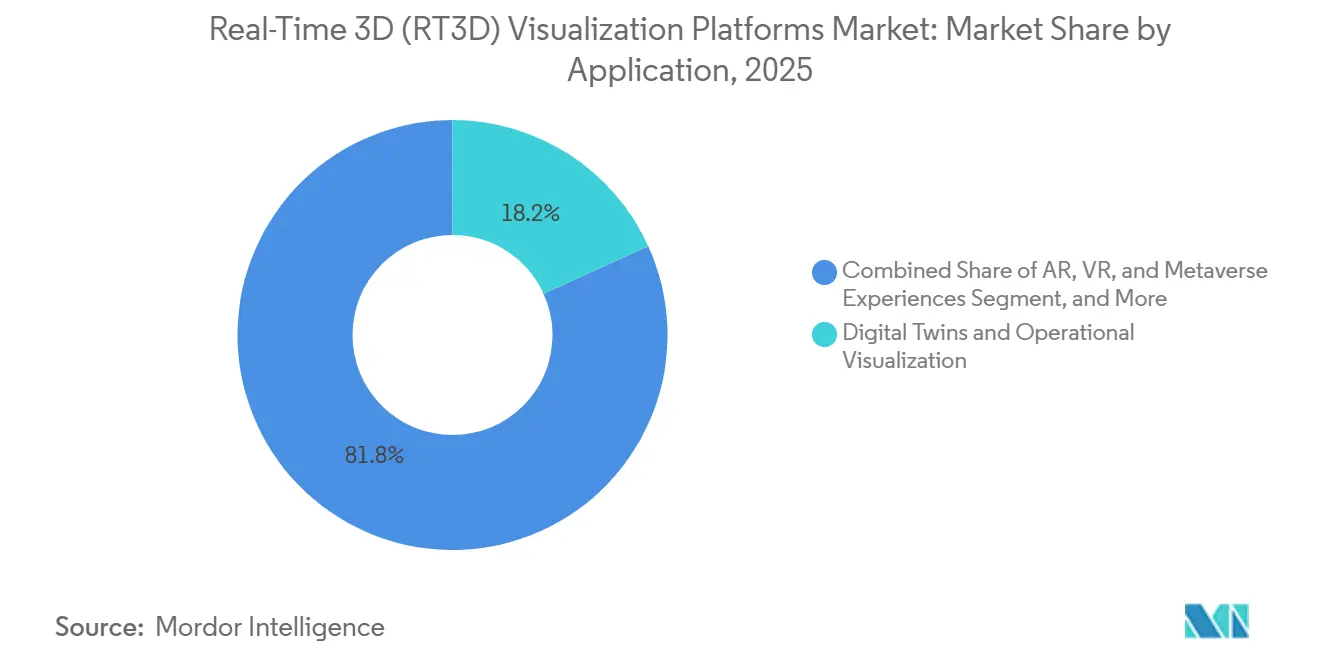
Digital Twins Lead While XR Reaches Production UseDigital twins and operational visualization accounted for 18.23% of the Real-time 3D visualization platforms market size in 2025, while AR, VR, and metaverse experiences is projected to advance at a 16.21% CAGR through 2031. Digital twins support process monitoring and virtual commissioning for automotive, energy, and manufacturing operators. These organizations use RT3D as an interface for operational data and simulation. Product design and modeling maintain a large established user base. Architectural visualization also remains important because design firms require clear stakeholder communication. Animation and visual effects serve mature creative workflows. Marketing and advertising tools face stronger competition from AI-generated content in lower-fidelity use cases. The real-time 3D (RT3D) visualization platforms market is still finding new demand through spatial computing for defense, healthcare, and industrial training. Those deployments are shifting from limited pilots to production programs.
The Khronos Group reported that 74% of non-games RT3D developers use Linux. This points to demand from scientific visualization, high-performance computing-connected simulation, and AI visualization. These users broaden the application base beyond its gaming origins. Simulation and training also benefit from public-sector procurement. The Air Force Research Laboratory and UC Health opened a 30,000-square-foot C-STARS Simulation Center in March 2026. The immersive VR facility increased annual military medical team training capacity from 100 to 300 units. Application demand is increasingly tied to decisions that require a realistic representation of physical settings. This favors platforms that can connect content, data, and simulation without forcing users into separate tools. The real-time 3D (RT3D) visualization platforms industry can therefore draw demand from both creative and operational applications.
By End User:
Infrastructure Digitization Supports Energy DemandManufacturing and industrial held 19.24% of the Real-time 3D visualization platforms market share in 2025, while energy, utilities, and infrastructure is expected to expand at a 15.67% CAGR through 2031. Manufacturing users have invested in factory digital twins, virtual commissioning, and operator training. These uses make visualization part of production planning and plant management. Energy operators need to represent complex assets spread across long distances. RT3D tools can help users inspect these assets without repeated physical site visits. Architecture, engineering, and construction represents another significant revenue pool. Media, entertainment, and gaming also remains a large user group. BIM requirements are supporting AEC adoption across the European Union, the United Kingdom, and the Gulf Cooperation Council. Consolidation among platform providers may reduce the cost of rendering access for media users.
Healthcare and life sciences is gaining visibility through immersive training deployments. The C-STARS center illustrates how medical training providers can use virtual environments to scale complex learning programs. ISO 55001 and IEC 62443 considerations influence the governance of digital twin data in operational technology settings. These requirements add work during procurement and implementation. They also give vendors a reason to demonstrate secure data-governance capabilities. E-commerce and retail use configurators to support product selection and customized orders. Education and training users apply simulation licenses to more structured learning programs. Each end-user group has different data, workflow, and performance requirements. The real-time 3D (RT3D) visualization platforms market can benefit from this range when vendors adapt their platforms to specific operating settings.
Geography Analysis
North America Real-Time 3D (RT3D) Visualization Platforms Market
North America held 35.41% of the real-time 3D (RT3D) visualization platforms market in 2025. The United States is home to game engine developers, cloud GPU providers, and industrial automation companies. Defense and federal procurement create demand for high-fidelity simulation systems. The Air Force Research Laboratory's C-STARS expansion received USD 10 million in congressional and institutional funding. Canada adds demand through XR and digital twin activity in Toronto and Vancouver. Mexico's automotive and aerospace export sectors are beginning to use visualization for supply-chain monitoring and virtual factory commissioning. North America also remains an important export market for international platform vendors. Partner programs and reseller agreements in the region can support wider commercial access.
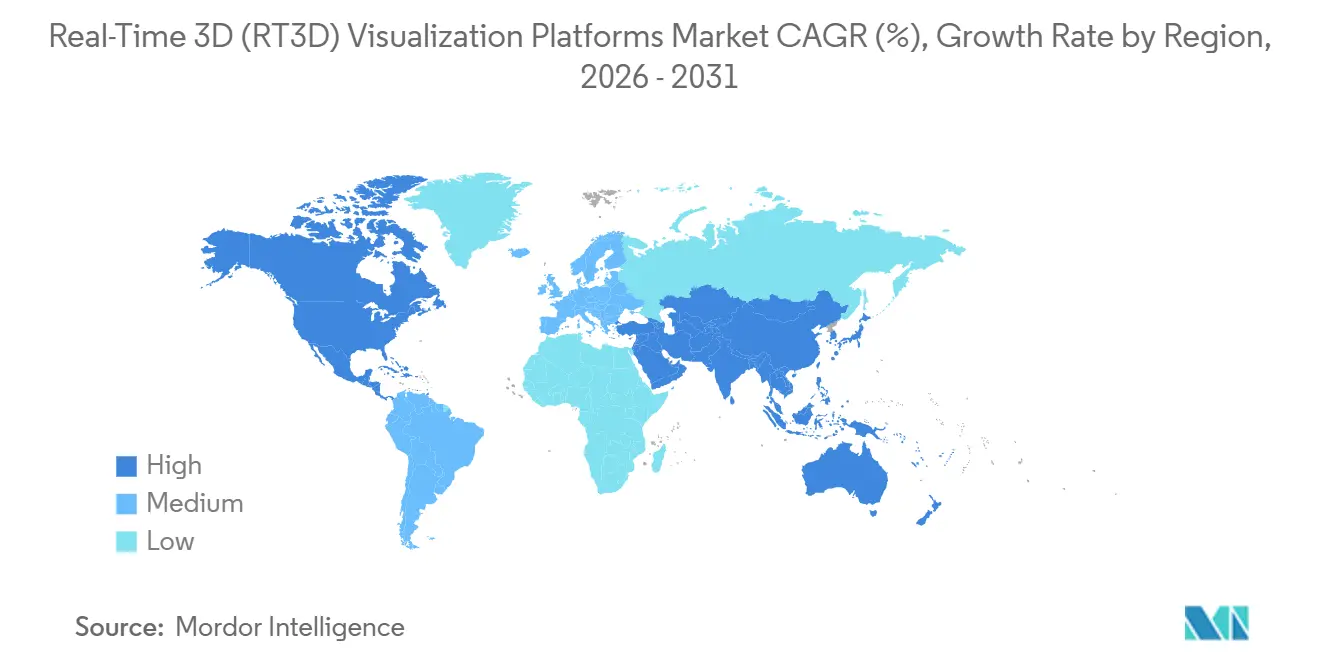
Europe and APAC Real-Time 3D (RT3D) Visualization Platforms Market
Europe is the second-largest regional market, shaped by both industrial demand and regulation. German manufacturers, especially in Bavaria and Baden-Württemberg, use RT3D for factory simulation under Industrie 4.0 programs. The EU Eureka3D-XR project received EUR 830,000 (USD 937,900) through the Digital Europe Program for 2025 to 2026. The project is developing extended reality application scenarios for enterprise use across member states. The EU AI Act and GDPR affect how cloud-hosted platforms handle model data and biometric information. These rules create demand for sovereign cloud and on-premises options. Asia-Pacific combines Japan's robotics and precision manufacturing base with China's industrial digitization programs and India's expanding technology services sector. NEC began selling its Digital Twin Platform in March 2025 and targeted JPY 2 billion (USD 13.6 million) in revenue over 3 years.
MEA and South America Real-Time 3D (RT3D) Visualization Platforms Market
The Middle East is projected to expand at a 15.76% CAGR through 2031. Smart-city projects, industrial diversification plans, and major infrastructure investments support regional demand. Saudi Arabia and the UAE use RT3D tools in project delivery and architectural visualization. South America has an early-stage demand profile led by Brazil and Argentina. Manufacturing exporters in São Paulo and Buenos Aires are beginning to use these platforms to visualize automotive assembly. Economic volatility can limit institutional investment cycles in the region. Africa has lower overall adoption, with South Africa and Egypt among the early markets. Energy utility digitization and infrastructure development support demand, while limited GPU access makes edge-enabled delivery important in many locations.

Competitive Landscape
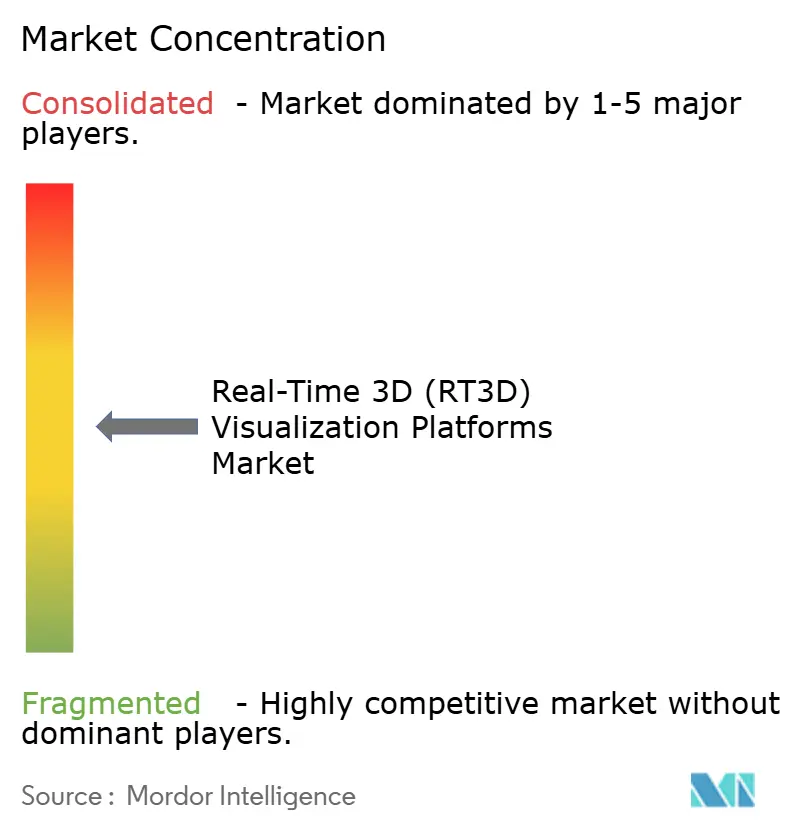
The real-time 3D (RT3D) visualization platforms market is moderately concentrated in rendering engines and more fragmented across vertical applications. Epic Games and Unity have substantial development ecosystem positions. Architectural visualization, product commerce, and geospatial digital twins have a wider range of specialized vendors. Competitive strength increasingly depends on how deeply AI is integrated into workflow stages. Threekit's AI Sales Agent shows how AI can be applied to guided selling and configuration. The company reported 229% year-over-year revenue growth for the product in June 2026. This approach shifts differentiation from rendering output alone toward the usefulness of the wider workflow. SimScale also partnered with Hexagon in February 2026 to integrate the Marc nonlinear solver into its cloud platform. The partnership supports high-fidelity multiphysics simulation from connected devices.
Chaos Software EOOD has consolidated Enscape, Cylindo, and Render Legion within its portfolio. This gives the group coverage across architectural rendering, furniture visualization, and visual-effects workflows. The portfolio approach can reduce opportunities for single-vertical competitors that sell separate tools. Cesium GS is developing 3D Tiles 2.0, broader BIM and CAD support, and Gaussian splat integration. It opened a joint Tokyo office with Bentley and Seequent in 2026 to support the 3D geospatial ecosystem in Asia-Pacific. This move supports the geospatial digital twin opportunity. Browser-delivered RT3D is another area with room for specialized platforms. The real-time 3D (RT3D) visualization platforms market rewards firms that can connect their products with existing enterprise data and design environments.
Technology ecosystems favor providers that coordinate multiple tools rather than only provide point solutions. NVIDIA, Pixar, and Google hold neural-rendering and Gaussian-splatting patents that point to lower-compute rendering as a key area of competition. Compliance certification is also relevant in enterprise buying decisions. Threekit's ISO 27001 certification can support procurement in healthcare, financial services, and defense settings. Vendors need to balance high-quality visual output with cost, security, and integration requirements. Industrial conglomerates also create indirect pressure by embedding RT3D libraries inside their digital twin and automation suites. Siemens built Digital Twin Composer on NVIDIA Omniverse libraries, which demonstrates this direction. The real-time 3D (RT3D) visualization platforms industry remains open to specialized providers where broad platforms do not address specific workflow needs. Consolidation is likely to remain relevant in architecture, commerce, simulation, and geospatial use cases.
Real-Time 3D (RT3D) Visualization Platforms Industry Leaders
Unity Software Inc.
Epic Games, Inc.
Chaos Software EOOD
Maxon Computer GmbH
Lumion B.V.
- *Disclaimer: Major Players sorted in no particular order
Real-Time 3D (RT3D) Visualization Platforms Market Companies Covered in this Report
- Unity Software Inc.
- Epic Games, Inc.
- Chaos Software EOOD
- Enscape GmbH
- Act-3D B.V.
- Lumion B.V.
- Luxion, Inc.
- Maxon Computer GmbH
- Side Effects Software Inc.
- OTOY, Inc.
- Next Limit Technologies S.L.
- Render Legion a.s.
- The Foundry Visionmongers Limited
- D5 Render Inc.
- Threekit, Inc.
- Marxent Labs, LLC
- Emersya SAS
- Cylindo ehf
- Roomle GmbH
- CGTrader UAB
- BRIKL Inc.
- MicroD LLC
- SimScale GmbH
- Cesium GS, Inc.

Recent Industry Developments in Real-Time 3D (RT3D) Visualization Platforms Market
- August 2026: Cesium released CesiumJS 1.144 and launched Sandcastle Copilot, an AI-assisted chat panel enabling developers to create and debug geospatial sandcastles. Cesium also opened a joint office with Bentley and Seequent in Tokyo as a hub for the 3D geospatial ecosystem in Asia-Pacific, extending its digital twin platform footprint into the region's industrial and infrastructure sectors.
- July 2026: The Digital Twin Consortium announced member adoption of multi-agent Front-Running Simulation on a live hydrocarbon processing plant digital twin. The implementation translated predictions into executable operational actions with human oversight.
- July 2026: SimScale released summer 2026 product updates that included Engineering AI agentic simulation accessible from any device, the PAMICS SPH meshless solver running on NVIDIA GPUs for complex fluid dynamics, and new electromagnetics modeling capabilities.
- June 2026: Maxon launched Redshift for Revit at AIA26, integrating real-time ray-traced rendering natively into Autodesk Revit. The company also opened beta access for Redshift for Graphisoft Archicad.


Global Real-Time 3D (RT3D) Visualization Platforms Market Report Scope
The real-time 3D (RT3D) visualization platforms market comprises software platforms and integrated solutions that enable the creation, rendering, simulation, and visualization of interactive three-dimensional digital environments in real time, allowing users to instantly view and manipulate 3D content with minimal latency.
The Real-Time 3D (RT3D) Visualization Platforms Market Report is Segmented by Component (Software, Services, and Hardware-Enabled Platform Services), Deployment (Cloud-Based, On-Premises, and Hybrid and Edge-Enabled), Application (Product Design and Modeling, Architectural Visualization, Animation and Visual Effects, Simulation and Training, Marketing and Advertising, AR, VR, and Metaverse Experiences, and Digital Twins and Operational Visualization), End User (Architecture, Engineering, and Construction, Automotive and Transportation, Manufacturing and Industrial, Media, Entertainment, and Gaming, Healthcare and Life Sciences, E-Commerce and Retail, Education and Training, and Energy, Utilities, and Infrastructure), and Geography (North America, South America, Europe, Asia-Pacific, Middle East, and Africa). The Market Forecasts are Provided in Terms of Value (USD).
| Software |
| Services |
| Hardware-Enabled Platform Services |
| Cloud-Based |
| On-Premises |
| Hybrid and Edge-Enabled |
| Product Design and Modeling |
| Architectural Visualization |
| Animation and Visual Effects |
| Simulation and Training |
| Marketing and Advertising |
| AR, VR, and Metaverse Experiences |
| Digital Twins and Operational Visualization |
| Architecture, Engineering, and Construction |
| Automotive and Transportation |
| Manufacturing and Industrial |
| Media, Entertainment, and Gaming |
| Healthcare and Life Sciences |
| E-Commerce and Retail |
| Education and Training |
| Energy, Utilities, and Infrastructure |
| North America | United States |
| Canada | |
| Mexico | |
| South America | Brazil |
| Argentina | |
| Rest of South America | |
| Europe | Germany |
| United Kingdom | |
| France | |
| Italy | |
| Spain | |
| Russia | |
| Rest of Europe | |
| Asia-Pacific | China |
| Japan | |
| India | |
| South Korea | |
| Australia | |
| Rest of Asia-Pacific | |
| Middle East | Turkey |
| Saudi Arabia | |
| United Arab Emirates | |
| Israel | |
| Rest of Middle East | |
| Africa | South Africa |
| Egypt | |
| Rest of Africa |
| By Component | Software | |
| Services | ||
| Hardware-Enabled Platform Services | ||
| By Deployment | Cloud-Based | |
| On-Premises | ||
| Hybrid and Edge-Enabled | ||
| By Application | Product Design and Modeling | |
| Architectural Visualization | ||
| Animation and Visual Effects | ||
| Simulation and Training | ||
| Marketing and Advertising | ||
| AR, VR, and Metaverse Experiences | ||
| Digital Twins and Operational Visualization | ||
| By End User | Architecture, Engineering, and Construction | |
| Automotive and Transportation | ||
| Manufacturing and Industrial | ||
| Media, Entertainment, and Gaming | ||
| Healthcare and Life Sciences | ||
| E-Commerce and Retail | ||
| Education and Training | ||
| Energy, Utilities, and Infrastructure | ||
| By Geography | North America | United States |
| Canada | ||
| Mexico | ||
| South America | Brazil | |
| Argentina | ||
| Rest of South America | ||
| Europe | Germany | |
| United Kingdom | ||
| France | ||
| Italy | ||
| Spain | ||
| Russia | ||
| Rest of Europe | ||
| Asia-Pacific | China | |
| Japan | ||
| India | ||
| South Korea | ||
| Australia | ||
| Rest of Asia-Pacific | ||
| Middle East | Turkey | |
| Saudi Arabia | ||
| United Arab Emirates | ||
| Israel | ||
| Rest of Middle East | ||
| Africa | South Africa | |
| Egypt | ||
| Rest of Africa | ||


Key Questions Answered in the Report
What is the size of the real-time 3D visualization platforms market?
The market was valued at USD 4.85 billion in 2026 and is projected to reach USD 9.76 billion by 2031, at a 15.01% CAGR.
Which component leads real-time 3D visualization platforms?
Software led with a 52.58% share in 2025. Services is projected to expand faster, at a 15.87% CAGR through 2031.
Why is hybrid and edge-enabled deployment gaining adoption?
Manufacturing and energy operators use it to support low-latency visualization and local processing of continuous operational data.
Which application is expanding fastest through 2031?
AR, VR, and metaverse experiences is projected to advance at a 16.21% CAGR, while digital twins and operational visualization led applications in 2025.
Which end-user group creates the fastest demand?
Energy, utilities, and infrastructure is projected to expand at a 15.67% CAGR, supported by grid digitization and complex asset visualization needs.
Which region is expected to advance fastest?
The Middle East is projected to advance at a 15.76% CAGR through 2031, supported by smart-city, industrial diversification, and infrastructure programs.
Page last updated on:





