
Phenolic Antioxidant Market Size and Share
Market Overview
| Study Period | 2021 - 2031 |
|---|---|
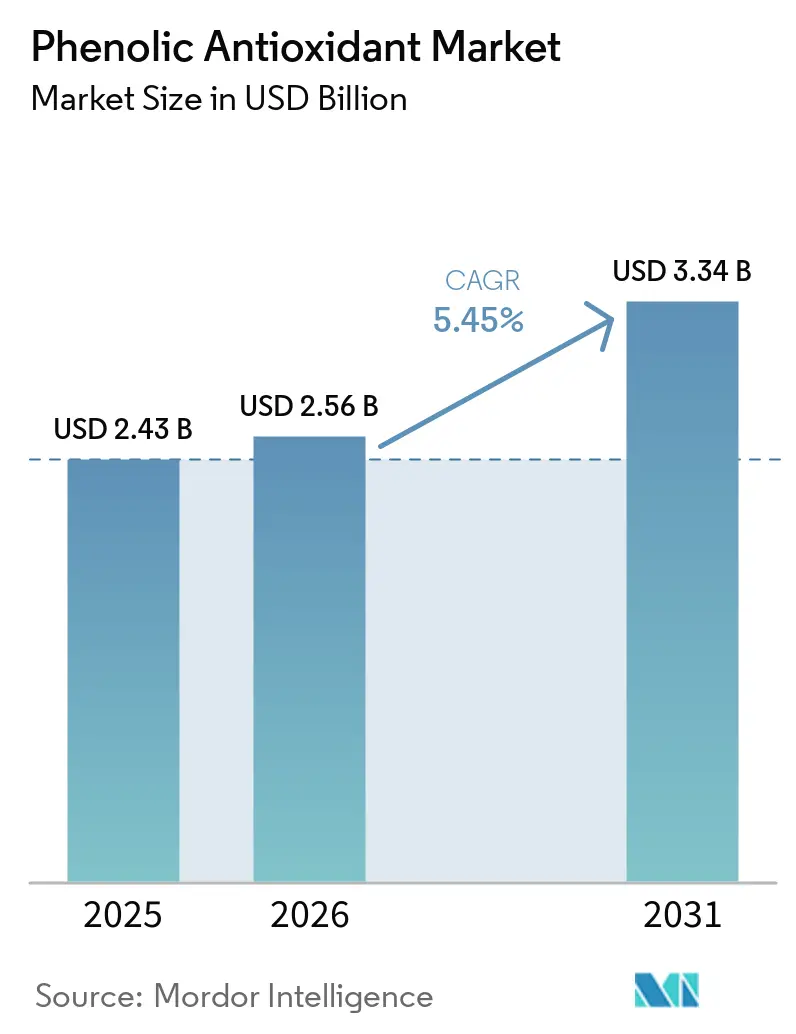
| Market Size (2026) | USD 2.56 Billion |
| Market Size (2031) | USD 3.34 Billion |
| Growth Rate (2026 - 2031) | 5.45 % |
| Fastest Growing Market | Asia-Pacific |
| Largest Market | Asia-Pacific |
| Market Concentration | Medium |
Major Players *Disclaimer: Major Players sorted in no particular order Image © Mordor Intelligence. Reuse requires attribution under CC BY 4.0. | |
Phenolic Antioxidant Market Analysis by Mordor Intelligence
The Phenolic Antioxidant Market size was valued at USD 2.43 billion in 2025 and is estimated to grow from USD 2.56 billion in 2026 to reach USD 3.34 billion by 2031, at a CAGR of 5.45% during the forecast period (2026-2031). The phenolic antioxidant market is supported by wider polymer use in electric vehicles and consumer electronics, where stabilizers help materials retain performance during processing and service. Battery enclosures and high-voltage cable compounds can operate at 120 °C to 150 °C, which supports demand for thermally stable, low-volatility synthetic phenolics. Fuel stabilization also broadens demand as biodiesel blending requirements expand in Southeast Asia and Latin America. Competition is moving suppliers toward high-molecular-weight, low-volatility, and multi-functional formulations as Chinese producers compete strongly in standard grades. The phenolic antioxidant market also faces regulatory review of some food additives, feedstock volatility, and the technical challenges created by additives that accumulate in recycled plastic.
Key Report Takeaways
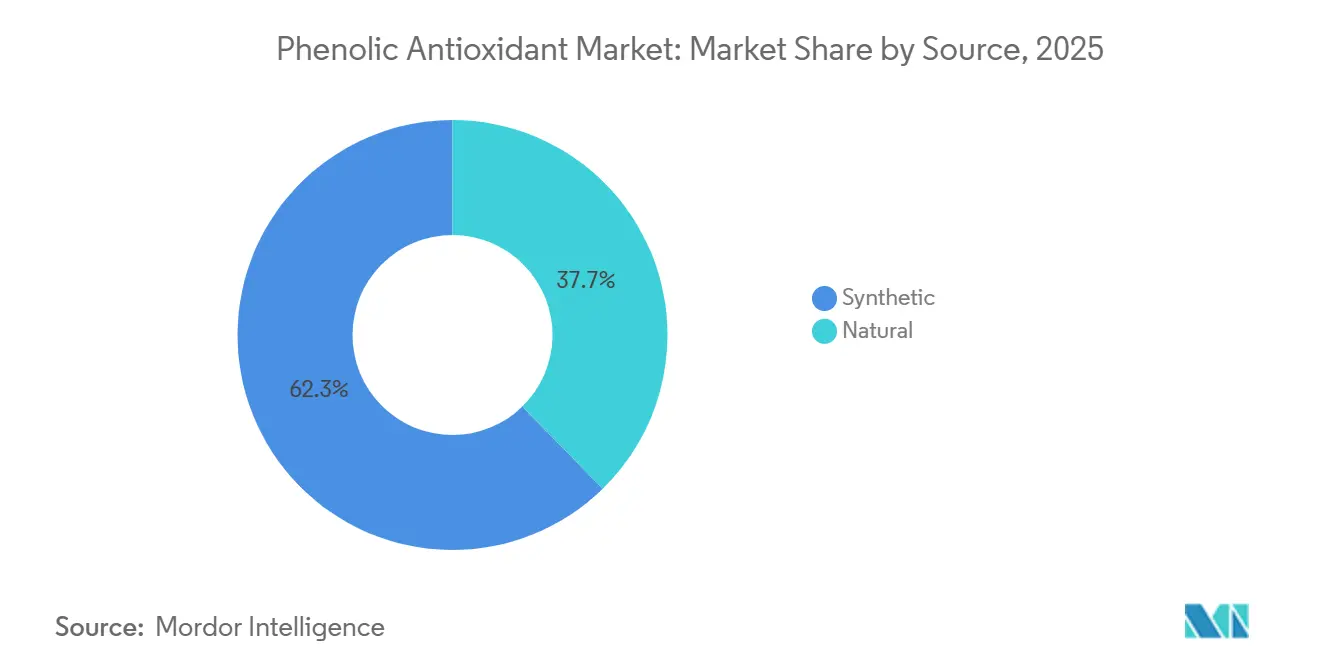
- By source, synthetic held 62.31% of the phenolic antioxidant market share in 2025, while natural is projected to advance at a 5.79% CAGR through 2031.
- By type, mono-functional antioxidants held 38.05% of the phenolic antioxidant market share in 2025, while multi-functional is projected to advance at a 6.33% CAGR through 2031.
- By form, powder held 50.17% of the phenolic antioxidant market share in 2025, while liquid is projected to advance at a 6.45% CAGR through 2031.
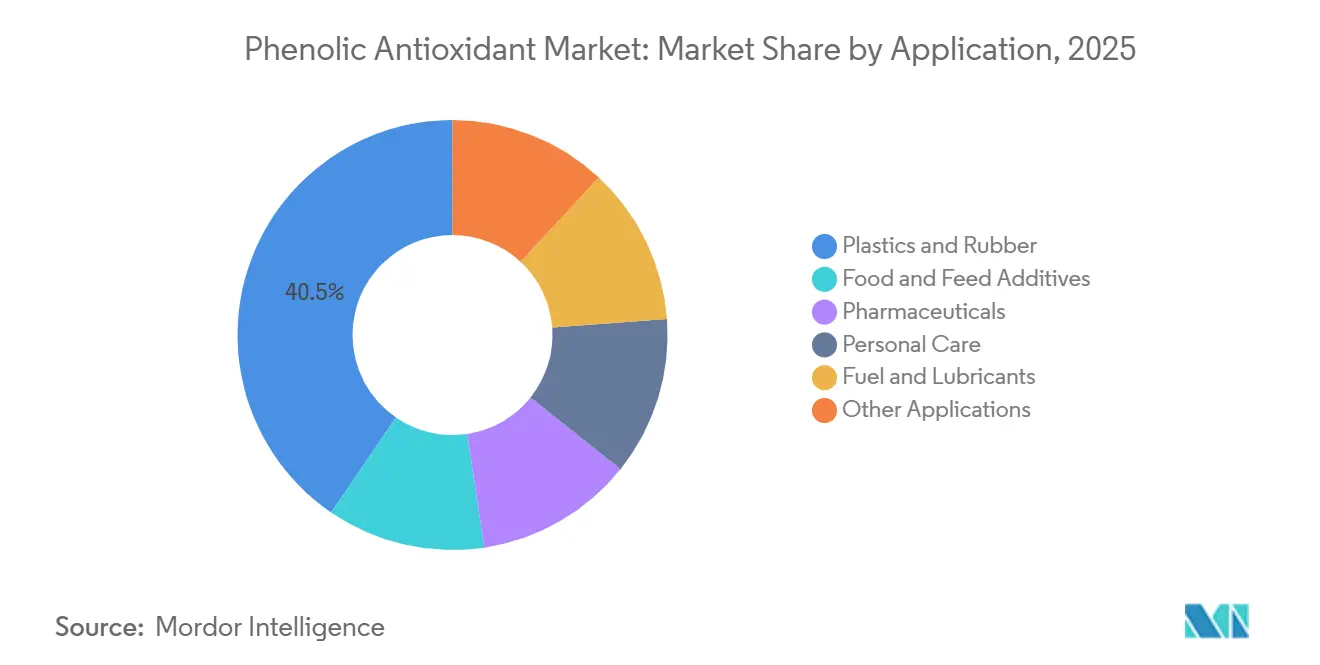
- By application, plastics and rubber held 40.45% of the phenolic antioxidant market share in 2025, while food and feed additives are projected to advance at a 6.74% CAGR through 2031.
- By geography, Asia-Pacific held 36.63% of the phenolic antioxidant market share in 2025 and is projected to advance at a 5.84% CAGR through 2031.
Note: Market size and forecast figures in this report are generated using Mordor Intelligence’s proprietary estimation framework, updated with the latest available data and insights as of January 2026.
Market Trends and Insights
Drivers Impact Analysis of Phenolic Antioxidant Market*
| Driver | (~) % Impact on CAGR Forecast | Geographic Relevance | Impact Timeline |
|---|---|---|---|
| Polymer Lightweighting and Electric-Vehicle Adoption | +1.8% | Global, with APAC & Europe leading | Medium term (2-4 years) |
| Processed-Food Shelf-Life Extension | +1.3% | Global | Short term (≤ 2 years) |
| Recycled Polyolefin Stabilization Requirements | +0.8% | Europe & North America | Medium term (2-4 years) |
| Growth in Fuel, Lubricant, and Biodiesel Applications | +0.6% | MEA, APAC, South America | Medium term (2-4 years) |
| Clean-Label and Plant-Derived Formulation Demand | +0.4% | North America & Europe | Short term (≤ 2 years) |
| Encapsulation and Delivery-System Improvements | +0.2% | Global | Long term (≥ 4 years) |
| Source: Mordor Intelligence | |||
Polymer Lightweighting and Electric-Vehicle Adoption
The phenolic antioxidant market benefits from polymer-intensive electric-vehicle platforms beyond battery housing applications. High-voltage cable insulation requires stabilization systems that can withstand continuous operating temperatures of 150 °C. Antioxidant loadings in these automotive compounds can reach 0.15% by weight. Original equipment manufacturers are qualifying polypropylene and thermoplastic elastomer insulation systems in place of polyvinyl chloride (PVC) in some applications. These material changes require higher antioxidant loading per kilogram of polymer and expand demand beyond vehicle production growth. Cable compounders are also reformulating for new electric-vehicle specifications, which favors suppliers that can support specialty grades.
Processed-Food Shelf-Life Extension
The phenolic antioxidant market is being reshaped by food manufacturers that are reviewing legacy butylated hydroxyanisole (BHA) and butylated hydroxytoluene (BHT) use. The U.S. Food and Drug Administration (FDA) began a post-market reassessment of BHA on February 10, 2026[1]. The FDA then published a request for information on BHT in May 2026. These reviews are redirecting formulation activity toward approved high-purity phenolic chemistries and natural alternatives, including rosemary extract and mixed tocopherols. Food suppliers that can provide complete toxicology documentation and validated replacements are better positioned to respond to reformulation needs. The resulting demand is centered on product substitution rather than a broad reduction in antioxidant use.
Recycled Polyolefin Stabilization Requirements
Recycled polyolefins create a distinct application area for the phenolic antioxidant market because prior processing can weaken polymer performance. Research published in March 2026 found that recycled polypropylene from automotive battery cases underwent thermo-oxidative degradation during reprocessing at 135 °C to 150 °C. The study found that bio-based alditol and thiosynergist combinations performed better than standard phosphite-containing systems in mechanical testing, melt volume rate, and molecular-weight retention. Recyclate stabilization, therefore, requires formulations that differ from products designed for virgin resins. This creates an advantage for suppliers with dedicated application-development capabilities. European recycled-content requirements under the Packaging and Packaging Waste Regulation (PPWR) also support recurring demand for recyclate-focused stabilization packages.
Growth in Fuel, Lubricant, and Biodiesel Applications
Fuel and lubricant applications provide an additional demand channel for the phenolic antioxidant market. Indonesia's B40 biodiesel requirement and Brazil's B15 diesel-blend requirement are expanding biodiesel use in South and Southeast Asia and South America. Biodiesel has lower oxidative stability than petroleum diesel, which increases the need for effective antioxidant treatment. High-unsaturated biodiesel blends also require more demanding stabilization specifications. This supports the use of higher-performance phenolic grades in a price environment that differs from commodity polymer compounding. The application is less exposed to food-additive reviews and the processing history issues that affect recycled plastics.
Restraints Impact Analysis of Phenolic Antioxidant Market*
| Restraint | (~) % Impact on CAGR Forecast | Geographic Relevance | Impact Timeline |
|---|---|---|---|
| Regulatory Scrutiny of Synthetic Phenolics | -0.8% | North America & Europe | Short term (≤ 2 years) |
| Feedstock Price and Supply Volatility | -0.6% | Global, APAC core | Medium term (2-4 years) |
| Additive Proliferation Complicating Polymer Recycling | -0.3% | Europe & North America | Medium term (2-4 years) |
| Source: Mordor Intelligence | |||
Regulatory Scrutiny of Synthetic Phenolics
Regulatory scrutiny is a near-term restraint for food-grade synthetic phenolics. The FDA reassessed BHA in February 2026 and opened a BHT review in May 2026. The European Commission's Scientific Committee on Consumer Safety published a scientific opinion on BHA in April 2026[2]. State actions in Texas, Louisiana, and West Virginia add to the policy pressure around BHA in food. The effect is narrower for polymer-grade products because those materials operate under separate compliance systems. Suppliers with food-grade and polymer-grade portfolios can therefore manage a more varied regulatory position than suppliers focused only on food additives.
Feedstock Price and Supply Volatility
Phenol production through the cumene route links manufacturing costs to benzene and propylene prices. Those input markets were unstable during 2025 because of refinery run-rate changes, oil-market movements, and uncertainty in downstream demand. Chinese bisphenol A (BPA) overcapacity continued to narrow phenol-BPA processing spreads in 2026. This created pressure on phenol production economics and encouraged rationalization rather than stable pricing. Producers also face competition from Chinese standard-grade suppliers that can use lower-cost surplus phenol. Isobutylene price movements can compound this pressure because it is another important input for hindered phenolics.
*Our forecasts treat driver/restraint impacts as directional, not additive. The impact forecasts reflect baseline growth, mix effects, and variable interactions.
Phenolic Antioxidant Market Segment Analysis
By Source:
Synthetic Anchor Revenue While Natural AcceleratesSynthetic accounted for 62.31% of the revenue in 2025. They remained important in polymer processing, lubricant stabilization, and industrial applications where cost efficiency and performance at processing temperatures guide procurement. Synthetic hindered phenolics retain a cost advantage in high-volume polymer compounding. Antioxidant loading is measured in parts per million across large polymer production runs, making unit-price differences significant. Natural is projected to advance at a 5.79% CAGR through 2031. Clean-label expectations and efforts to remove BHA and BHT from ingredient lists support this growth in food and feed uses.
Natural products are gaining wider use in food, personal care, and pharmaceutical formulations. Synthetic is also being upgraded for polymer applications that must meet food-contact and chemical compliance requirements. The European Union update to Regulation (EC) No 1333/2008 in August 2026 added requirements that affect documentation and third-party testing for natural antioxidant exports. This requirement can favor suppliers with sufficient compliance resources over smaller extractors. It may slow supply-chain entry even while the underlying demand for natural options remains strong. Suppliers with both synthetic and natural portfolios can serve the different requirements of these end uses.
By Type:
Mono-Functional Leads Share, Multi-Functional Drives the Growth PremiumMono-functional held 38.05% of the revenue in 2025. These products are widely used in standard polyolefin, rubber, and lubricant formulations where single-mechanism oxidative protection meets technical needs. Their cost profile remains relevant to high-volume polypropylene and polyethylene compounding in the Asia-Pacific. Qualified formulations are not changed easily without a clear performance reason. Bi-functional grades support applications that need primary and secondary stabilization without the higher complexity of multi-functional blends. Rubber and engineering thermoplastics are important end uses for these products.
Multi-functional is projected to advance at a 6.33% CAGR through 2031. Formulators are adopting integrated additive packages that address processing stability, service life, and discoloration control in a single product. Research from the Fraunhofer Institute found that phenyl propionates performed better in polypropylene extrusion than single-mechanism alternatives. Their bimolecular disproportionation mechanism enables antioxidant regeneration and forms additional stabilizing compounds during processing. Electric-vehicle polymer compounds and medical-device plastics reinforce demand for these grades because they need stability through demanding processing cycles.
By Form:
Powder Dominates Compounding, Liquid Targets Precision SectorsPowder held 50.17% of the revenue in 2025. Its position reflects straightforward handling in bulk polymer compounding and compatibility with common polyolefin, engineering-plastic, and rubber processing conditions. Masterbatch producers use powder grades for their dispersion performance in twin-screw extrusion. Uniform dispersion supports consistent mechanical and optical characteristics across production runs. Granules serve applications that require a balance between powder and liquid handling properties. Their relevance rises where dust-exposure standards make pellet handling more attractive.
Liquid is projected to advance at a 6.45% CAGR through 2031. Food and pharmaceutical producers value soluble formats that can be dosed precisely in continuous manufacturing processes. Liquid products can avoid the solid-additive dispersion issues found in some applications. Microencapsulation can support controlled release in biodiesel and lubricant formulations. SONGWON received Roundtable on Sustainable Palm Oil (RSPO) Mass Balance certification for SONGNOX 1076 in January 2026. The certification shows that traceability is becoming a procurement consideration alongside physical form and performance.
By Application:
Plastics and Rubber Anchors Demand as Food and Feed Additives Lead the Growth CurvePlastics and rubber accounted for 40.45% of the phenolic antioxidant market size in 2025. Polyolefin production supports this position because phenolic antioxidants limit thermo-oxidative degradation during melt processing and later use. Electric-vehicle materials have increased stabilizer requirements in some filled polypropylene structural and under-hood parts. These components undergo elevated thermal cycling during service. Topical products can also use phenolic antioxidants as active cosmeceutical ingredients under separate regulatory requirements.
Food and feed additives are projected to advance at a 6.74% CAGR through 2031. The BHA and BHT review cycle is encouraging replacement activity in this application. The FDA's August 2026 requirements for new Generally Recognized as Safe (GRAS) notifications for natural food antioxidants include stability testing and migration assessment. These requirements raise the documentation burden for new entrants and favor suppliers with established dossiers. Fuel and lubricants drive demand as biodiesel blending programs expand. This additional use diversifies the phenolic antioxidant market beyond food reformulation and polymer processing.

Geography Analysis
APAC Phenolic Antioxidant Market
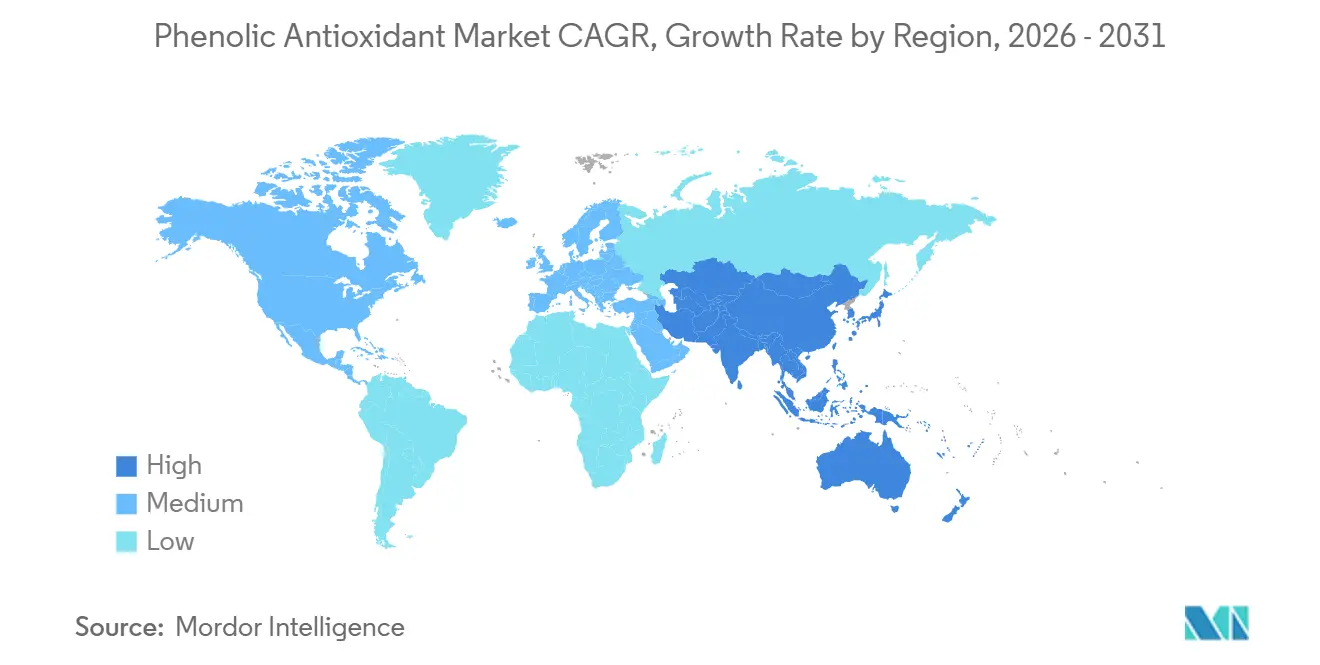
Asia-Pacific held 36.63% of the market revenue in 2025 and is projected to advance at a 5.84% CAGR through 2031. The phenolic antioxidant market in the region is supported by major polyolefin compounding capacity and electric-vehicle production. China accounts for much regional consumption through these activities. Chinese suppliers also export standard-grade products across Southeast Asia, maintaining pressure on regional pricing. Japan contributes demand for specification-grade additives used in lightweight materials for electric and hybrid vehicles. South Korea's automotive polymer supplier base supports demand for products with stringent thermal-stability certifications. India offers a growing opportunity as manufacturing programs and plastics processing expand.
North America and Europe Phenolic Antioxidant Market
North America and Europe have matured but have changing demand patterns. FDA reviews of BHA and BHT are moving food-ingredient demand toward other phenolic chemistries. Higher recycled-polyolefin volumes also raise the need for stabilization during processing. Europe has a substantial recycling base, and recycled materials can need 1.3 to 1.6 times the antioxidant loading of virgin-grade resins. BASF announced an expansion of standard hindered amine light stabilizer (HALS) and NOR HALS capacity in April 2026 to support demand in high-performance plastics and China's plasticulture sector. Germany remains an important center for premium grades used in automotive and industrial polymer applications.
South America and MEA Phenolic Antioxidant Market
South America and Middle East and Africa are developing use areas for fuel, lubricant, and polymer-grade products. Brazil's B15 biodiesel blend requirement and Argentina's soy-based biodiesel production support demand for fuel stabilization. Saudi Arabia's petrochemical capacity expansion supports domestic consumption of polymer and lubricant additives. South Africa remains a distribution point for specialty antioxidants in Sub-Saharan Africa. Infrastructure and construction polymers are expected to support the addressable base through the forecast period. These geographies add demand diversity to the phenolic antioxidant market.
Competitive Landscape
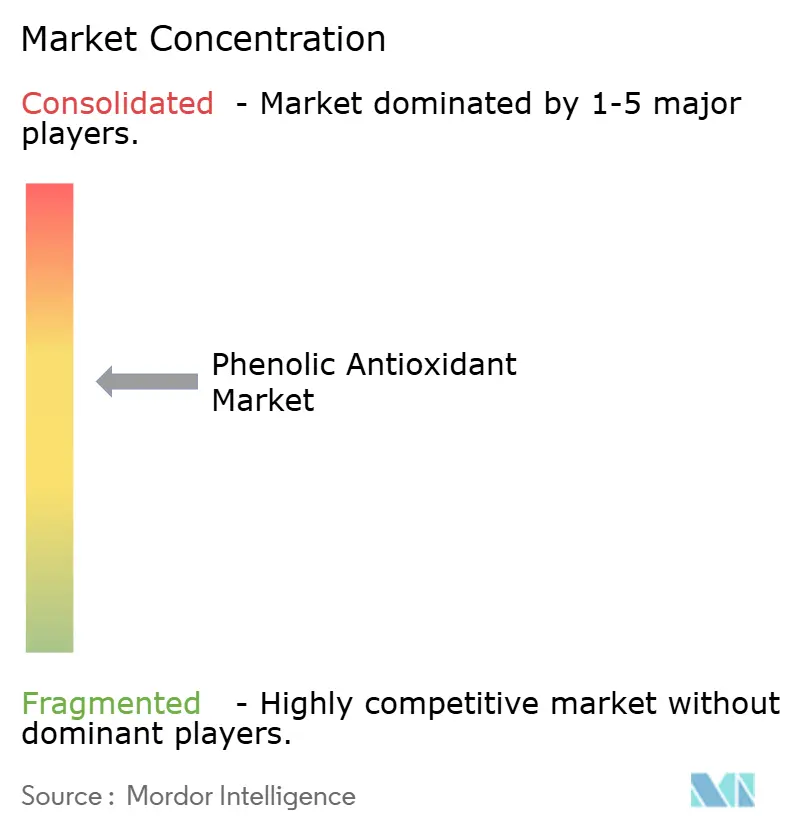
The phenolic antioxidant market is moderately concentrated, with the top five players including BASF, SONGWON, SI Group, Inc., ADEKA CORPORATION, and CLARIANT. Chinese private-label capacity remains significant in standard hindered phenolic products. The phenolic antioxidant market rewards suppliers that combine access to phenol or isobutylene feedstocks with application-development laboratories near automotive and packaging customers. This approach increases switching costs during product design and qualification. Competition is, therefore, strongest where technical support, regulatory documentation, and reliable supply are required.
SONGWON received RSPO Mass Balance certification for SONGNOX 1076 in January 2026 and commercially launched the certified option in July 2026. The move added supply-chain traceability to its product positioning. BASF announced capacity investment for standard hindered amine light stabilizer and NOR HALS products in April 2026. This investment supports its wider performance additives infrastructure for high-performance plastics. These actions reflect the importance of traceability, reliable supply, and technical performance in regulated additive applications.
Recyclate-specific formulations remain a key opportunity because products designed for virgin resins may not manage degradation from repeated processing. Rianlon Corporation and Everspring Chemical Co., Ltd. are developing specialty blends at competitive price points. Their activity challenges the development margins that larger producers use to offset price pressure in commodity grades. Product development is focused on multi-functional, high-molecular-weight, and low-volatility systems. These systems are designed to resist extraction during melt processing and reduce plate-out. Food-contact compliance and rubber standards reinforce barriers in regulated end uses and protect the position of suppliers with established technical resources.
Phenolic Antioxidant Industry Leaders
-
BASF
-
SONGWON
-
SI Group, Inc.
-
ADEKA CORPORATION
-
CLARIANT
- *Disclaimer: Major Players sorted in no particular order
Phenolic Antioxidant Market Companies Covered in this Report
- 3V Sigma S.p.A.
- ADEKA CORPORATION
- BASF
- CLARIANT
- Dover Chemical Corporation
- Eastman Chemical Company
- Everspring Chemical Co., Ltd.
- Evonik Industries AG
- LANXESS
- Oxiris Chemicals S.A.
- Rianlon Corporation
- SI Group, Inc.
- SONGWON
- Sumitomo Chemical Co., Ltd.
- Syensqo
Recent Industry Developments in Phenolic Antioxidant Market
- July 2026: SONGWON completed the commercial launch of a Roundtable on Sustainable Palm Oil (RSPO)-certified version of SONGNOX 1076, a phenolic antioxidant, following its Mass Balance Grade certification in January 2026. The launch expands sustainable phenolic antioxidant offerings and supports compliance with evolving sustainability and supply-chain requirements.
- May 2026: The U.S. FDA initiated a formal post-market reassessment of butylated hydroxytoluene (BHT). The review increases regulatory scrutiny of BHT, a synthetic phenolic antioxidant used in food applications, potentially influencing future demand and formulation requirements.
Global Phenolic Antioxidant Market Report Scope
Phenolic antioxidants are compounds used to inhibit oxidation reactions that can degrade materials and reduce the stability, performance, and service life of products. They function by interrupting oxidation pathways and are incorporated into formulations where protection against heat, oxygen, and processing-related degradation is required.
The Phenolic Antioxidant Market is segmented by source, type, form, application, and geography. By source, the market is segmented into synthetic and natural. By type, the market is segmented into mono-functional, bi-functional, and multi-functional. By form, the market is segmented into powder, granule, and liquid. By application, the market is segmented into plastics and rubber, food and feed additives, pharmaceuticals, personal care, fuel and lubricants, and other applications. The report also covers the market size and forecasts for phenolic antioxidants in 15 countries across major regions. For each segment, the market sizing and forecasts have been done on the basis of value (USD).
Segmentation Overview
| Synthetic |
| Natural |
| Mono-Functional |
| Bi-Functional |
| Multi-Functional |
| Powder |
| Granule |
| Liquid |
| Plastics and Rubber |
| Food and Feed Additives |
| Pharmaceuticals |
| Personal Care |
| Fuel and Lubricants |
| Other Applications |
| Asia-Pacific | China |
| India | |
| Japan | |
| South Korea | |
| Rest of Asia-Pacific | |
| North America | United States |
| Canada | |
| Mexico | |
| Europe | Germany |
| United Kingdom | |
| France | |
| Italy | |
| Rest of Europe | |
| South America | Brazil |
| Argentina | |
| Rest of South America | |
| Middle East and Africa | Saudi Arabia |
| South Africa | |
| Rest of Middle East and Africa |
| By Source | Synthetic | |
| Natural | ||
| By Type | Mono-Functional | |
| Bi-Functional | ||
| Multi-Functional | ||
| By Form | Powder | |
| Granule | ||
| Liquid | ||
| By Application | Plastics and Rubber | |
| Food and Feed Additives | ||
| Pharmaceuticals | ||
| Personal Care | ||
| Fuel and Lubricants | ||
| Other Applications | ||
| By Geography | Asia-Pacific | China |
| India | ||
| Japan | ||
| South Korea | ||
| Rest of Asia-Pacific | ||
| North America | United States | |
| Canada | ||
| Mexico | ||
| Europe | Germany | |
| United Kingdom | ||
| France | ||
| Italy | ||
| Rest of Europe | ||
| South America | Brazil | |
| Argentina | ||
| Rest of South America | ||
| Middle East and Africa | Saudi Arabia | |
| South Africa | ||
| Rest of Middle East and Africa | ||
Key Questions Answered in the Report
What is the size of the phenolic antioxidant market?
The phenolic antioxidant market stands at USD 2.56 billion in 2026 and is projected to reach USD 3.34 billion by 2031.
What is driving demand for phenolic antioxidants?
The phenolic antioxidant market is supported by polymer lightweighting in electric vehicles, food shelf-life needs, recyclate stabilization, and fuel applications.
Which source led the market demand in 2025?
Synthetic led with a 62.31% share because of cost and processing-performance advantages in industrial uses.
Which application is expected to grow fastest through 2031?
Food and feed additives are expected to advance at a 6.74% CAGR through 2031.