
Payment Facilitation Market Size and Share
Market Overview
| Study Period | 2020 - 2031 |
|---|---|
| Market Size (2026) | USD 5.62 Trillion |
| Market Size (2031) | USD 10.39 Trillion |
| Growth Rate (2026 - 2031) | 13.07 % |
| Fastest Growing Market | Asia-Pacific |
| Largest Market | North America |
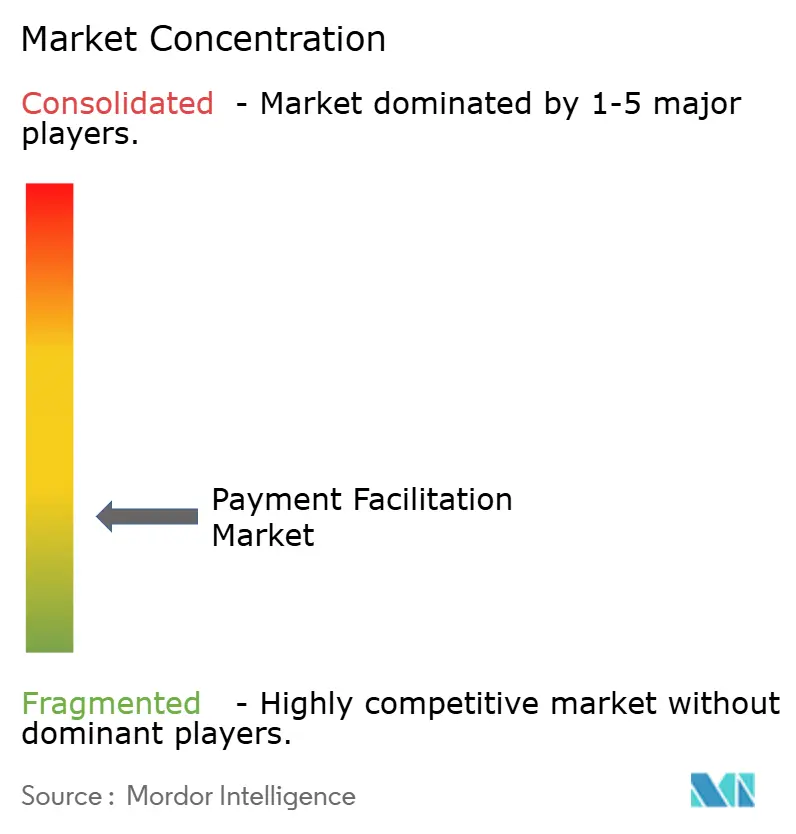
| Market Concentration | Low |
Major Players *Disclaimer: Major Players sorted in no particular order Image © Mordor Intelligence. Reuse requires attribution under CC BY 4.0. | |
Payment Facilitation Market Analysis by Mordor Intelligence
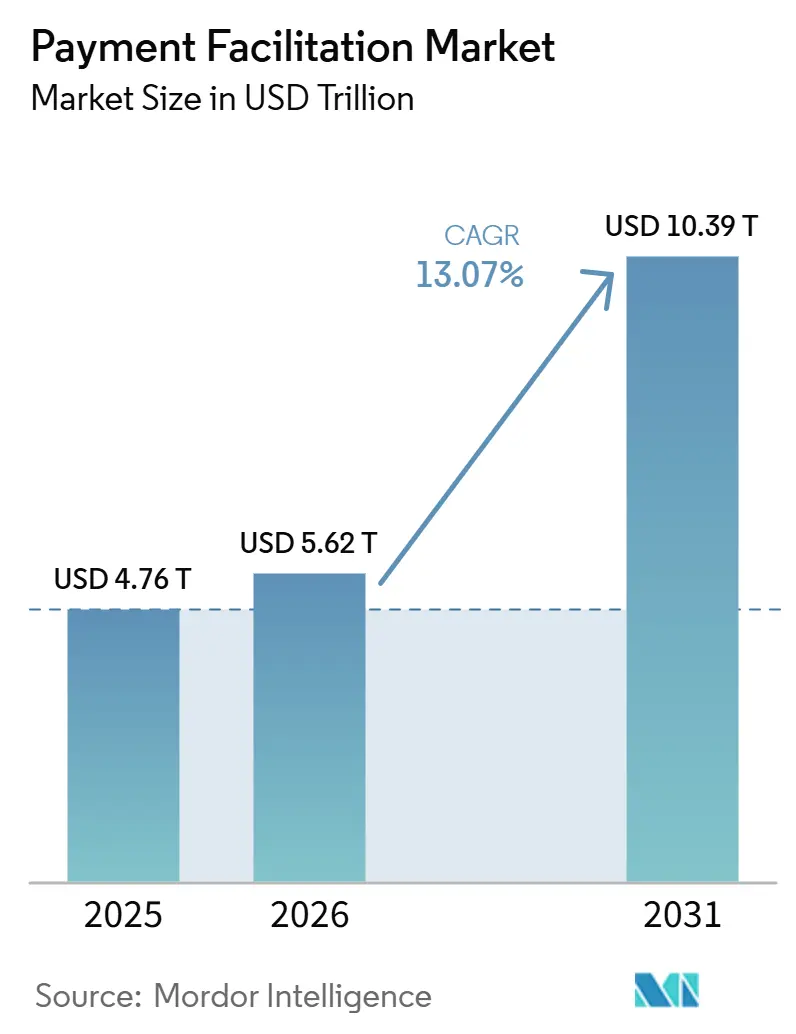
The Payment Facilitation Market size is expected to increase from USD 4.76 trillion in 2025 to USD 5.62 trillion in 2026 and reach USD 10.39 trillion by 2031, growing at a CAGR of 13.07% over 2026-2031.
The payment facilitation market is expanding as software providers move from referring merchants to participating directly in payment revenue through embedded sub-merchant aggregation. North America held the largest geographic position in 2025, supported by mature acquiring infrastructure in the United States and a deep sponsor bank ecosystem. Asia-Pacific is forecast to record the fastest growth, supported by India’s UPI network and by the region’s broad use of alternative payment methods. The payment facilitation market is also moving toward specialized operating models, where healthcare, real estate, and education requirements affect platform selection alongside processing costs. Competition increasingly depends on risk controls, local payment coverage, and the ability to support branded payment journeys within software products.
Key Report Takeaways
- By deployment model, PayFac-as-a-Service captured 57.7% of the payment facilitation market share in 2025 and is projected to grow at a 15.88% CAGR through 2031.
- By enterprise size, small and medium enterprises accounted for 61.8% of the payment facilitation market share in 2025 and are projected to grow at a 15.1% CAGR through 2031.
- By end user, SaaS platforms and ISVs captured 35.2% of the payment facilitation market share in 2025, and are projected to grow at a 16.57% CAGR through 2031.
- By delivery model, API-first delivery accounted for 47.6% of the payment facilitation market share in 2025, while white-label and embedded delivery are projected to grow at a 16.2% CAGR through 2031.
- By industry vertical, retail and consumer goods captured 27.3% of the payment facilitation market share in 2025, while healthcare is projected to grow at a 17.1% CAGR through 2031.
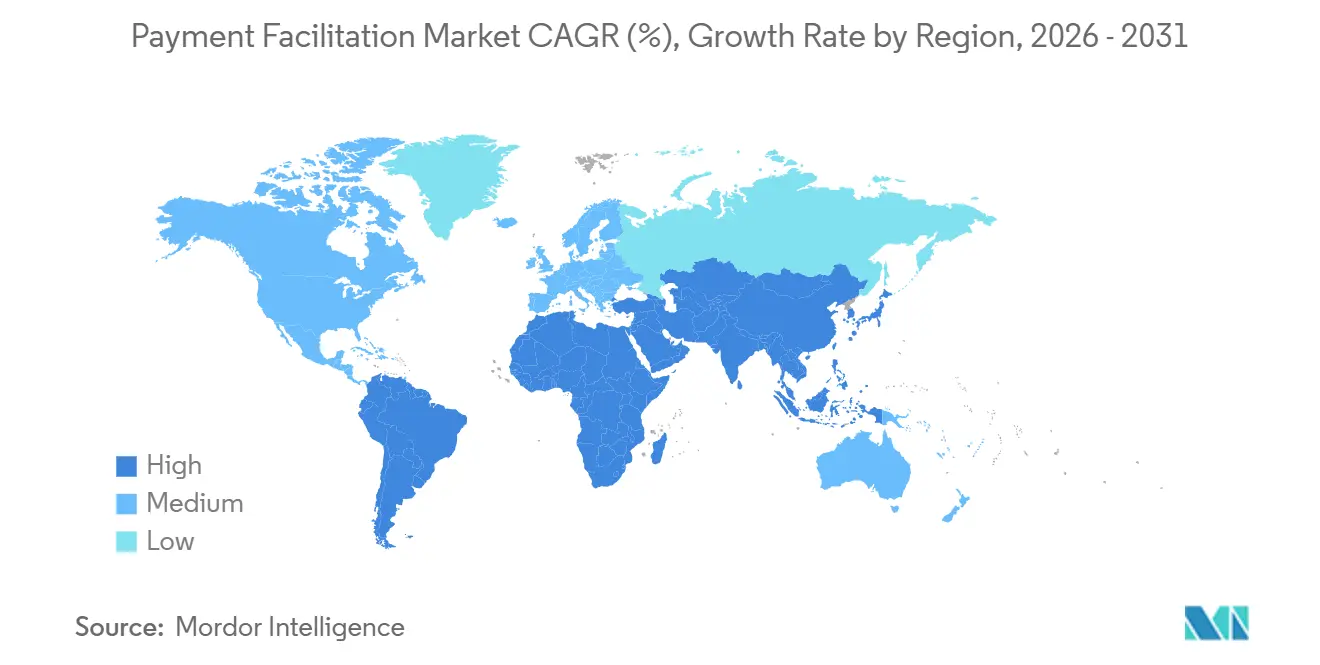
- By geography, North America captured 42.11% of the payment facilitation market share in 2025, while Asia-Pacific is projected to grow at a 17.44% CAGR through 2031.
Note: Market size and forecast figures in this report are generated using Mordor Intelligence’s proprietary estimation framework, updated with the latest available data and insights as of January 2026.
Market Trends and Insights
Drivers Impact Analysis of Payment Facilitation Market*
| Drivers | (~) % Impact on CAGR Forecast | Geographic Relevance | Impact Timeline |
|---|---|---|---|
| Shift Toward Embedded Payments in SaaS and Vertical Platforms | +2.8% | Global, strongest in North America and Europe | Short term (≤ 2 years) |
| Faster Merchant Time-to-Revenue and Instant Boarding | +2.2% | Global | Short term (≤ 2 years) |
| Scalable Underwriting and Compliance Automation | +1.6% | North America and Europe | Medium term (2-4 years) |
| Multi-Merchant and Marketplace Monetization Needs | +1.4% | Global, with growing relevance in Asia-Pacific | Medium term (2-4 years) |
| Cross-Border Commerce and Multi-Currency Acceptance | +1.5% | Asia-Pacific, Europe, and the Middle East and Africa | Medium term (2-4 years) |
| AI-Enabled Fraud and Chargeback Monitoring | +1.5% | Global | Short term (≤ 2 years) |
| Source: Mordor Intelligence | |||
Rapid Shift Toward Embedded Payments in SaaS and Vertical Platforms
The payment facilitation market benefits when vertical software providers add payment acceptance to their core products. More than 50% of relevant ISVs in North America offered embedded payments in 2025. SaaS providers with integrated payments accounted for 36% of SME acquiring revenue in 2024, and the cited BCG estimate expected this share to reach 45% by 2028. Embedded payments can reduce merchant attrition by integrating the payment function into the daily software workflow. Platforms with embedded payments had a 2.5x lower merchant attrition rate than those that used payment referrals. This combines transaction revenue with a stronger reason for merchants to remain with their software provider.
The addressable embedded finance revenue opportunity for SaaS platforms in North America and Europe was estimated at USD 185 billion, with a penetration of less than 20%. This indicates that many software providers are still evaluating whether to take a larger role in the payment experience. The payment facilitation market enables these providers to monetise payments without having to build every compliance and payment capability internally. PayFac-as-a-Service is particularly attractive to businesses seeking faster market entry without assuming the regulatory and operational responsibilities of becoming a fully registered payment facilitator. As a result, the operating model influences product development, merchant retention, and the speed at which software platforms can generate payment-related revenue. It also creates opportunities for established payment facilitators to support emerging vertical SaaS platforms before they transition to an independent PayFac model.
Need for Faster Merchant Time-to-Revenue and Instant Boarding
Faster merchant activation supports growth because a platform cannot earn payment revenue until its sub-merchants are live and processing. Traditional underwriting could require weeks of document review, while PayFac-as-a-Service platforms can complete sub-merchant onboarding in minutes. Mastercard and Cardstream described this change in their February 2025 payment facilitation publication[1]. Earlier activation can reduce abandonment during setup and accelerate the shift of payment volume onto a platform. The payment facilitation market, therefore, places greater value on automated onboarding than on transaction processing capacity. Faster workflows are especially important where software providers serve many small merchants with limited time for document collection.
The Worldpay survey found that 81% of merchants identified access to funds within 24 hours as a leading embedded finance requirement. This places settlement speed alongside onboarding as part of the merchant experience. Automated know-your-business tools can replace static collection processes with real-time business verification where risk rules allow it. The process still requires controls because a faster decision that overlooks risk can lead to chargebacks or sponsor bank concern. The payment facilitation market is consequently rewarding providers that can shorten onboarding while maintaining a complete view of the sub-merchant. The practical advantage is not speed in isolation, but the ability to connect verification, approval, settlement, and ongoing monitoring in one operating process.
Cross-Border Commerce Requiring Multi-Currency Merchant Acceptance
Cross-border commerce increases the need for facilitators that can support local payment methods, foreign exchange handling, and merchant settlement across jurisdictions. India’s cross-border UPI transactions grew 1,936% year over year in fiscal year 2024-25[2]. The payment facilitation market must support domestic real-time rails as those rails gain cross-border connections. It also cited an estimate that the Asia-Pacific would add USD 15 trillion in payment volume through 2030. That volume creates a need for providers that can reconcile transactions across currencies and payment methods. It also makes local payment coverage more important than a simple card acceptance proposition.
Stripe introduced an Adaptive Pricing Engine in July 2026 that localizes currency, payment method availability, and installment options at checkout using real-time signals. The launch was described for Shopify, WooCommerce, and BigCommerce merchants. This type of product shows how payment providers are integrating local checkout into their core services. In the payment facilitation market, the basic requirement is to reliably accept and settle payments across relevant corridors. Providers can then differentiate through transparent foreign exchange costs, faster settlement, and more dependable reconciliation. These capabilities matter to platforms whose merchants sell across borders and expect the software provider to manage payment complexity without forcing them into separate systems.
AI-Enabled Monitoring Reducing Fraud and Chargeback Losses
AI-supported monitoring has become an important operating tool for controlling fraud and chargeback exposure in payment facilitation. The research stated that organizations lost an average of USD 60 million annually to payment fraud and that the global financial impact exceeded USD 485 billion in 2024. Mastercard’s 2026 research reported that 42% of issuers and 26% of acquirers saved more than USD 5 million in fraud losses over 2 years through AI adoption[3]. The payment facilitation market needs these controls because a sub-merchant’s performance can affect the sponsor relationship for the whole program. Monitoring, therefore, has to continue after onboarding rather than end when an account is approved. A facilitator that detects unusual behavior early can help protect both merchants and the acquiring relationship.
The Airwallex data indicated that its fraud engine prevented 45% more fraud year over year than in 2024. This kind of result illustrates why providers are investing in models that identify patterns across large payment datasets. Synthetic identity fraud was identified as the fastest-growing threat by 61% of payment leaders in the cited Mastercard research. Continuous model retraining is needed because fraud methods change as quickly as payment channels. The payment facilitation market also depends on chargeback monitoring because individual sub-merchants can exceed card network thresholds. Strong monitoring can reduce losses, protect merchant continuity, and help a provider meet sponsor bank and scheme expectations.
Restraints Impact Analysis of Payment Facilitation Market*
| Restraint | (~) % Impact on CAGR Forecast | Geographic Relevance | Impact Timeline |
|---|---|---|---|
| KYC, AML, PCI, and Scheme Compliance Burden | -1.8% | Global, highest in Europe under PSD3 and PSR | Long term (≥ 4 years) |
| Sponsor Bank Dependency and Contracting Friction | -1.4% | North America and Europe | Medium term (2-4 years) |
| Chargeback Volatility in High-Risk Merchant Categories | -1.0% | Global | Short term (≤ 2 years) |
| Integration and Risk-Certification Cycles for Legacy Merchant Stacks | -0.9% | North America and Europe | Medium term (2-4 years) |
| Source: Mordor Intelligence | |||
Elevated Compliance Burden From KYC, AML, PCI, and Scheme Rules
KYC, AML, PCI DSS Level 1, and card scheme requirements create a fixed cost burden for payment facilitators. The BSA and AML, sanctions screening, and PCI DSS Level 1 costs range from USD 100,000 to USD 500,000 before variable transaction-monitoring costs. These obligations can make it impractical for early-stage software platforms to obtain full payment facilitator registration. The payment facilitation market consequently retains a strong role for providers that take on compliance functions for their customers. Platforms that use those services can focus on their merchant proposition while relying on a specialist for core control processes. The trade-off is that they have less direct control over some risk and operating decisions.
Jurisdictional differences add further complexity for operators working in more than one region. The European PSD3 and PSR package, United States FedNow requirements, and India’s data localization mandates are examples of separate regulatory considerations. A smaller facilitator may find it difficult to maintain a compliance structure that meets all these requirements simultaneously. The cost is not limited to technology because it also includes policy work, reporting, review, and sponsor bank engagement. The payment facilitation market may therefore favor firms that already have the staff and systems to apply controls across several regimes. It can also increase demand for PayFac-as-a-Service where the provider absorbs more of the operating burden.
Sponsor Bank Dependency and Contracting Friction
Every card-rail payment facilitator depends on a sponsoring bank for access to the card networks through a BIN and an acquiring relationship. This dependency gives the sponsor bank a central role in assessing the platform's controls, merchant categories, compliance framework, financial strength, and operational capabilities. Sponsor banks typically require adequate capitalisation, detailed compliance plans, and, in many cases, audited financial statements, with specific financial requirements varying by institution and risk profile. These entry conditions can make it difficult for many early-stage platforms to adopt a full PayFac model. The payment facilitation market, therefore, faces a structural barrier that extends beyond product design alone. A platform must establish a trusted relationship with a sponsor bank before it can operate independently at scale on card rails.
A sponsor bank can end a relationship if it identifies compliance failures or changes its risk appetite. Such a decision can disrupt payment revenue and require a platform to quickly secure a new operating arrangement. Growth can also create challenges if merchant risk evolves beyond the sponsor bank's original approval assumptions. Smaller operators may not have the account management capacity needed to maintain close alignment with their sponsor bank. The payment facilitation market rewards businesses that treat sponsor bank relationships as an ongoing responsibility rather than a one-time contracting task. This requirement reinforces the value of providers with established banking relationships and experienced compliance teams.
*Our forecasts treat driver/restraint impacts as directional, not additive. The impact forecasts reflect baseline growth, mix effects, and variable interactions.
Payment Facilitation Market Segment Analysis
By Deployment Model:
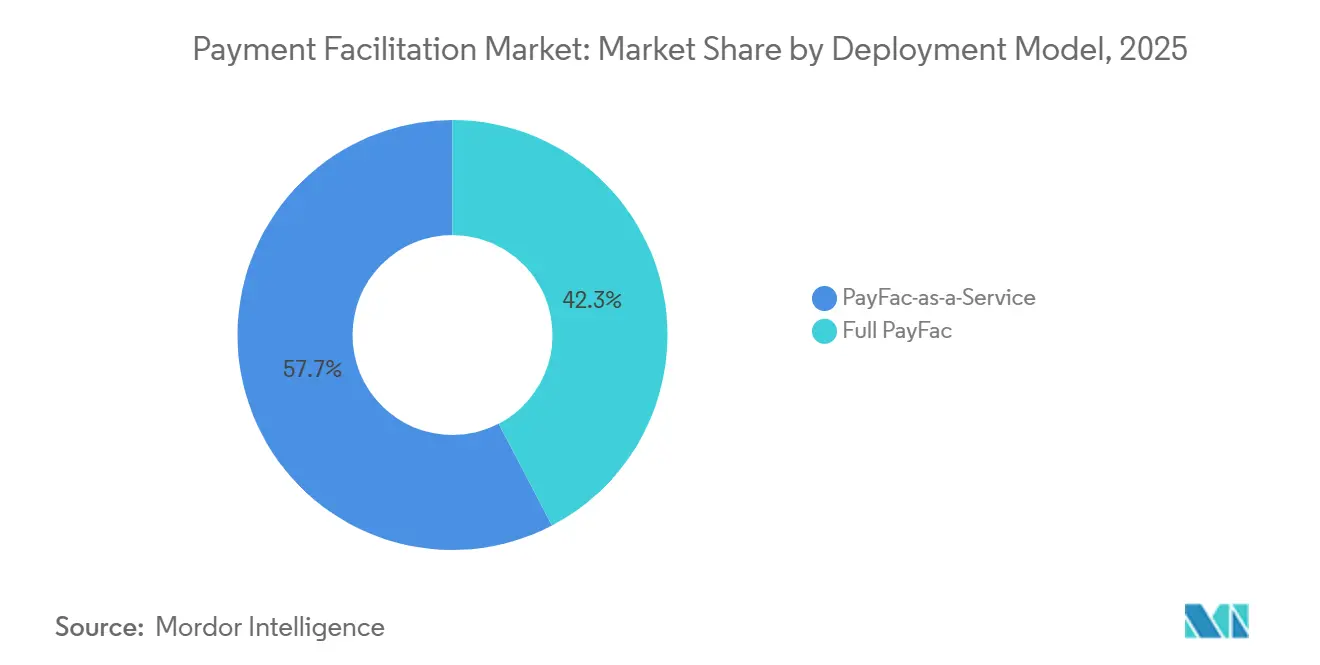
PayFac-as-a-Service Wins on Compliance EconomicsPayFac-as-a-Service held 57.7% of the payment facilitation market share in 2025. This position reflected demand from software-led businesses seeking embedded payment capability without bearing the full cost of registration. Full PayFac registration requires BSA and AML programs, PCI DSS Level 1 certification, card network registration fees, and dedicated sponsor bank compliance support. PayFac-as-a-Service shifts much of this responsibility to the service provider. Mastercard and Cardstream reported in February 2025 that this model supported hundreds of new PayFac formations each quarter. It can shorten time-to-market from months to weeks and reduce merchant onboarding time from weeks to minutes.
Full PayFac remains relevant for high-volume platforms that can absorb compliance costs and want to retain a larger share of the payment margin. These platforms may also place greater value on direct control of sub-merchant data and operating policies. Several PayFac-as-a-Service providers offer pathways for customers to move toward full registration as their volume grows. This creates a staged approach rather than a permanent choice between two separate models. The payment facilitation market can therefore support a platform at various stages of its development. The model that best fits depends on transaction volume, risk capacity, internal resources, and the level of control the platform needs.
By Enterprise Size:
SMEs Command Share With Structural Tailwinds Across Software PlatformsSMEs accounted for 61.8% of the payment facilitation market share in 2025 and are forecast to expand at a 15.1% CAGR through 2031. Their position reflects the broad use of vertical software as an operating system for daily business activity. This software provides a distribution route through which payment services can reach many sub-merchants. The adoption of vertical software among United States SMEs reached 59% in 2024, up from 50% in 2022. Software providers with integrated payments generated 36% of SME acquiring revenue in 2024. The payment facilitation market benefits when these platforms make payment acceptance part of their standard product.
The Oliver Wyman survey stated that 64% of SMEs planned to adopt new or additional embedded finance products through software providers within 12 months. That behavior supports the software provider's role as a payment distribution channel. SMEs may prefer an integrated service because it reduces the number of separate vendors they need to manage. The result is a large addressable base for embedded payment functionality. Large enterprises have different requirements because they may pursue full PayFac registration or direct acquiring relationships. Their scale can lower compliance costs per transaction and enable greater direct control over sub-merchant information, but the SME segment remains the primary source of distributed demand.
By End User:
SaaS Platforms Lead, Marketplaces Define the Complexity FrontierSaaS platforms and ISVs held 35.2% of the payment facilitation market share in 2025. Their importance stems from their role in merchants’ daily workflows and their ability to embed payments within broader software packages. More than 60% of North American ISVs have embedded payments into their platforms. Payment revenue generated through United States software vendors is expected to rise from USD 6.5 billion in 2020 to USD 16 billion in 2025. This channel is growing faster than traditional acquiring. The payment facilitation market relies on this channel because it combines merchant acquisition and payment processing into a single commercial relationship.
Marketplaces face more complex implementation challenges because they require multi-seller split payments, commission withholding, cross-border foreign exchange, and payout scheduling. Digital commerce and e-commerce platforms can generate high transaction volumes, but basic acquiring can come under pressure as payment orchestration becomes more common. Other software platforms, including property management, field services, and legal applications, extend the addressable base through white-label arrangements. These arrangements let a platform add payments with lower direct compliance responsibility. The end-user mix, therefore, includes both large platforms with specialized requirements and a long tail of vertical applications. Each group needs a provider that can match its technical requirements, merchant risk profile, and preferred degree of control.
By Delivery Model:
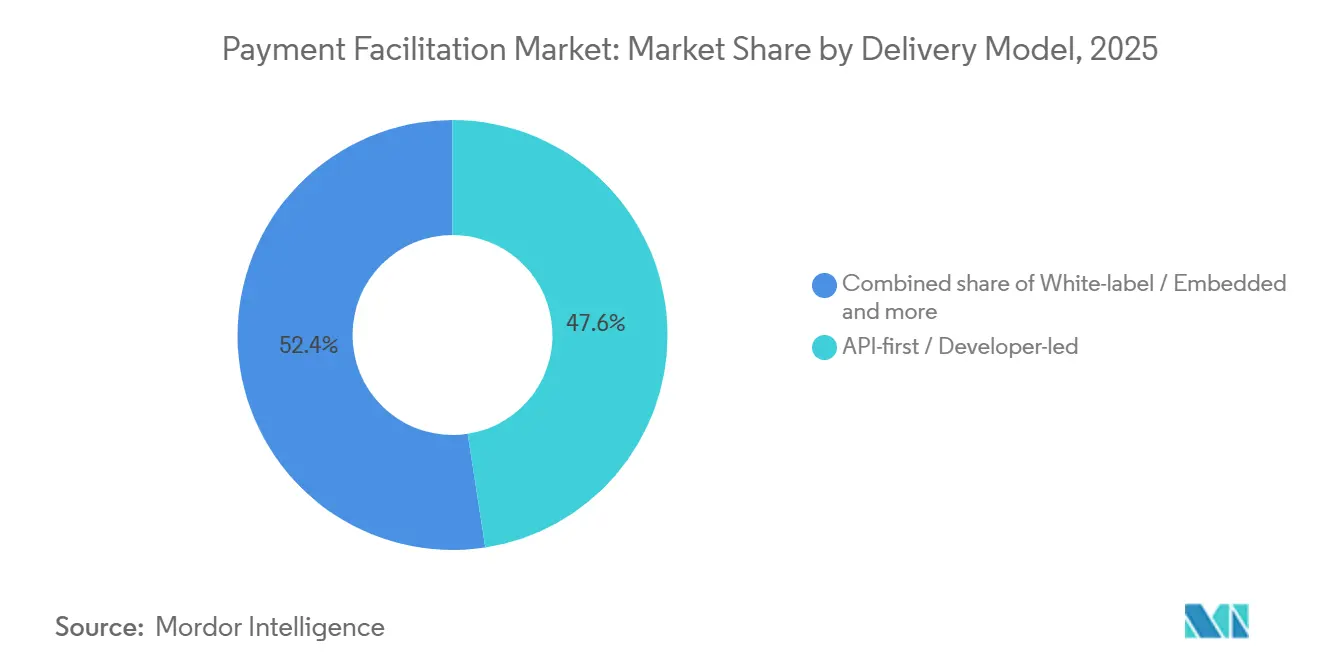
API-first Holds Scale as White-label Gains Strategic MomentumAPI-first delivery held 47.6% of the payment facilitation market share in 2025. It remains a common starting point because developers can integrate payment functions directly into their product workflow. White-label and embedded delivery is forecast to grow at a 16.2% CAGR through 2031. This model gives the software provider a branded payment experience that appears within its own application. The payment facilitation market can benefit, as merchants may view the payment service as part of the platform rather than an external referral. That closer connection can make the product relationship harder to replace.
The vertical SaaS platforms that embed financial services under their own brand can increase revenue per customer by 2x to 5x without adding users, according to industry experts. API-first delivery still has a role because many platforms first test payment economics via an integration before investing in branding. Fully managed delivery remains relevant where a platform has limited technical capacity or needs a provider to operate more of the payment process. The boundaries among delivery models are becoming less rigid. Adyen for Platforms, Stripe Connect, and Finix offer API-first and white-label layers that can support a staged rollout. This allows platforms to change their delivery approach as merchant volume and product priorities develop.
By Industry Vertical:
Healthcare Fastest-Growing, Retail and Consumer Goods Anchors VolumeRetail and consumer goods held 27.3% of the payment facilitation market share in 2025, while healthcare is forecast to grow at a 17.1% CAGR from 2026 to 2031. Healthcare growth reflects rising patient payment responsibility and the continued replacement of fragmented billing systems. Finix data stated that out-of-pocket healthcare spending grew by 5.9% to 11% of total health spending in 2025. Stripe stated that 85% of medical providers in the United States use software to manage their practices [4]. These conditions create a large software-led base for payment facilitation.
Healthcare providers also need payment partners that can meet stringent data and workflow requirements. The patient health data breaches rose from 6 million affected records in 2010 to 170 million in 2024. This makes security and compliance relevant to how healthcare ISVs select payment partners. Real estate and education require specialized modules for payment timing, escrow, and refunds. Travel and hospitality require support for dynamic pricing, multiple currencies, bookings, and refunds. Professional services and food and beverage contribute broad transaction volume across a large number of smaller merchants. Specialized modules can help a facilitator compete when a generic acquiring service does not meet the vertical's operating needs.
Geography Analysis
North America Payment Facilitation Market
North America held 42.1% of the payment facilitation market share in 2025. The region benefits from the United States' concentration of enterprise SaaS vendors, broad sponsor bank coverage, and mature ISV payment monetisation. Payment processing revenue from United States software vendors reached USD 16 billion in 2025 and grew at a 20% annual rate. SaaS-led acquiring accounted for 36% of SME acquiring revenue, with BCG projecting 45% by 2028. Canada's open banking consultation and Mexico's Fintech Law were identified as regulatory developments supporting cross-border investment. These factors make the region an established base for providers seeking both large merchants and a wide software-led merchant network.
Europe Payment Facilitation Market
Europe's role in the payment facilitation market is affected by regulatory transition and by a remaining gap in embedded finance adoption. The European Parliament's ECON committee approved the PSD3 and PSR framework on May 5, 2026, with the framework expected to apply in the first half of 2028. It introduced stricter fraud liability, payee name verification, and enhanced open banking API obligations. The United Kingdom, Germany, France, Italy, and Spain form the region's core revenue base. Germany's B2B payment digitisation and the United Kingdom's Faster Payments infrastructure continue to support market growth. Embedded finance accounted for one-third of SME payment volume in advanced European markets, compared with two-thirds in the United States, leaving significant room for further adoption.
APAC, South America and MEA Payment Facilitation Market
Asia-Pacific is projected to expand at a 17.4% CAGR from 2026 to 2031, the fastest regional growth rate in the payment facilitation market. The region is expected to add USD 15 trillion in payment volume through 2030, bringing the total to USD 41.7 trillion. In Japan, 31 major payment processing companies recorded combined revenue of JPY 580.5 billion (USD 3.9 billion) in 2025, up 21.7% year over year. India's UPI-linked credit card transactions generated USD 12 billion per month, and its cross-border UPI expansion covered eight live countries. South America, the Middle East, and Africa remain earlier-stage opportunities as payment infrastructure and regulatory frameworks continue to develop.
Competitive Landscape
The payment facilitation market comprises high-volume payment processors and a broader set of specialist providers. Stripe, PayPal, Adyen, Fiserv, FIS, and Global Payments compete on processing scale, global reach, and enterprise service capabilities. Meanwhile, Finix, Rapyd, NMI, Stax, BlueSnap, and Checkout.com primarily target mid-market SaaS platforms and software providers through modular payment infrastructure, embedded payments, and industry-specific compliance capabilities.
Emerging infrastructure providers such as Juspay are differentiating through open-source payment orchestration rather than payment acquiring. Their platforms allow merchants to route transactions across multiple payment service providers, optimize authorization rates, and reduce vendor lock-in, intensifying competition in enterprise payment infrastructure. In July 2026, Stripe and Advent International submitted a joint bid valued at USD 53.4 billion for PayPal. If completed, the combined entity would process an estimated USD 3.7 trillion in annual payment volume. The proposed transaction highlights the competitive importance of scale in the payment facilitation market, as larger payment platforms can strengthen underwriting capabilities, fraud prevention, merchant acquisition, and operational efficiency.
Specialization remains important because software platforms often need workflows that match the requirements of their end markets. Healthcare modules that support HIPAA-related requirements, real estate escrow workflows, and education tuition management can help a provider win platform relationships. Stripe’s Radar system processed USD 1.9 trillion in annual payment volume and reduced dispute rates by 17% for its user base. Stripe also deployed its Agentic Commerce Protocol with Facebook and Meta in 2026. The protocol enables AI agents to complete payment flows with a Shared Payment Token without merchants storing sensitive card data. These moves show how product development is linking fraud controls, tokenization, and checkout experiences.
Adyen for Platforms and Worldpay for Platforms compete with unified in-store and online payment architectures. Checkout.com and Global Payments are investing in API modernization to remain competitive with developer-led providers. Visa’s Payment Facilitator and Marketplace Risk Guide sets scheme-level expectations for underwriting and sub-merchant monitoring. Stronger controls can therefore provide a competitive advantage where sponsor banks seek evidence that a provider exceeds minimum requirements.
Payment Facilitation Industry Leaders
-
Stripe, Inc.
-
PayPal Holdings, Inc.
-
Fiserv, Inc.
-
Global Payments Inc.
-
Adyen
- *Disclaimer: Major Players sorted in no particular order
Payment Facilitation Market Companies Covered in this Report
- Stripe
- PayPal Holdings, Inc.
- Block, Inc.
- Adyen
- Fiserv, Inc.
- Global Payments Inc.
- FIS
- Worldline
- Checkout.com
- Rapyd Financial Network Ltd.
- Paysafe Limited
- Juspay Technologies
- NMI
- Marqeta, Inc.
- Stax Payments, Inc.
- BlueSnap, Inc.
- Helcim Inc.
- Authorize.Net
- Braintree
- WePay
- Finix Payments, Inc.
Recent Industry Developments in Payment Facilitation Market
- July 2026: Juspay partnered with Recurly to integrate its open-source payment orchestration platform, Hyperswitch, enabling subscription merchants to access over 300 payment service providers through a single integration, improving payment resilience and global scalability.
- July 2026: Stripe and Advent International submitted a joint bid to acquire PayPal Holdings for approximately USD 53.4 billion, supported by USD 50 billion in committed bank financing. The deal would have combined platforms that processed a total of USD 3.7 trillion annually, prompting immediate strategic repositioning across the mid-market and enterprise tiers.
- April 2026: Stripe launched its Adaptive Pricing Engine, automatically localizing currency, payment methods, and installment options at checkout using real-time IP, device, and browser signals, initially for Shopify, WooCommerce, and BigCommerce merchants.
- March 2026: The European Parliament's ECON committee approved PSD3 and the Payment Services Regulation, with publication in the Official Journal in July 2026. The first half of 2028 will impose stricter fraud liability, mandatory payee name verification, and enhanced open banking requirements.
Global Payment Facilitation Market Report Scope
Segmentation Overview
| Full PayFac |
| PayFac-as-a-Service |
| Large Enterprises |
| Small and Medium Enterprises |
| Marketplaces (horizontal and vertical) |
| SaaS Platforms and ISVs |
| Digital Commerce / E-commerce Platforms |
| Other Software Platforms & Vertical Applications |
| API-first / Developer-led |
| White-label / Embedded |
| Fully Managed Platform |
| Healthcare |
| Real Estate |
| Education |
| Travel & Hospitality |
| Professional Services |
| Retail & Consumer Goods |
| Food & Beverage |
| Other Verticals |
| North America | United States |
| Canada | |
| Mexico | |
| South America | Brazil |
| Argentina | |
| Rest of South America | |
| Europe | United Kingdom |
| Germany | |
| France | |
| Italy | |
| Spain | |
| Rest of Europe | |
| Asia-Pacific | China |
| Japan | |
| India | |
| South Korea | |
| Australia | |
| Indonesia | |
| Thailand | |
| Malaysia | |
| Singapore | |
| Vietnam | |
| Rest of Asia-Pacific | |
| Middle East and Africa | Saudi Arabia |
| United Arab Emirates | |
| Turkey | |
| South Africa | |
| Egypt | |
| Rest of Middle East and Africa |
| By Deployment Model | Full PayFac | |
| PayFac-as-a-Service | ||
| By Enterprise Size | Large Enterprises | |
| Small and Medium Enterprises | ||
| By End User | Marketplaces (horizontal and vertical) | |
| SaaS Platforms and ISVs | ||
| Digital Commerce / E-commerce Platforms | ||
| Other Software Platforms & Vertical Applications | ||
| By Delivery Model | API-first / Developer-led | |
| White-label / Embedded | ||
| Fully Managed Platform | ||
| By Industry Vertical | Healthcare | |
| Real Estate | ||
| Education | ||
| Travel & Hospitality | ||
| Professional Services | ||
| Retail & Consumer Goods | ||
| Food & Beverage | ||
| Other Verticals | ||
| By Geography | North America | United States |
| Canada | ||
| Mexico | ||
| South America | Brazil | |
| Argentina | ||
| Rest of South America | ||
| Europe | United Kingdom | |
| Germany | ||
| France | ||
| Italy | ||
| Spain | ||
| Rest of Europe | ||
| Asia-Pacific | China | |
| Japan | ||
| India | ||
| South Korea | ||
| Australia | ||
| Indonesia | ||
| Thailand | ||
| Malaysia | ||
| Singapore | ||
| Vietnam | ||
| Rest of Asia-Pacific | ||
| Middle East and Africa | Saudi Arabia | |
| United Arab Emirates | ||
| Turkey | ||
| South Africa | ||
| Egypt | ||
| Rest of Middle East and Africa | ||
Key Questions Answered in the Report
What is payment facilitation?
Payment facilitation allows a platform to onboard sub-merchants under a master merchant arrangement and offer payment acceptance within its own software experience.
How large is the payment facilitation sector?
The payment facilitation market size is estimated at USD 5.62 trillion in 2026 and is forecast to reach USD 10.39 trillion by 2031 at a 13.1% CAGR.
Why is PayFac-as-a-Service widely used?
PayFac-as-a-Service held 57.7% share in 2025 because it lets software providers use payment infrastructure without taking on the full direct compliance burden.
Which business users are most important for payment facilitators?
SaaS Platforms and ISVs held 35.2% share in 2025, while SMEs accounted for 61.8% and are forecast to grow at a 15.1% CAGR through 2031.
Which vertical is growing fastest for embedded payment services?
Healthcare is forecast to grow at a 17.1% CAGR from 2026 to 2031, supported by payment responsibility, software use, and billing modernization needs.
Which region is growing fastest for payment facilitation?
Asia-Pacific is forecast to grow at a 17.4% CAGR through 2031, supported by payment volume growth and real-time payment infrastructure.