
Market Overview
| Study Period | 2020 - 2031 |
|---|---|
| Forecast Data Period | 2026 - 2031 |
| Historical Data Period | 2020 - 2024 |
| Growth Rate | 4.05 % |
Major Players_Market_-_Key_Players.webp) *Disclaimer: Major Players sorted in no particular order Image © Mordor Intelligence. Reuse requires attribution under CC BY 4.0. | |
North America Pressure Sensitive Adhesives (PSA) Market Analysis by Mordor Intelligence
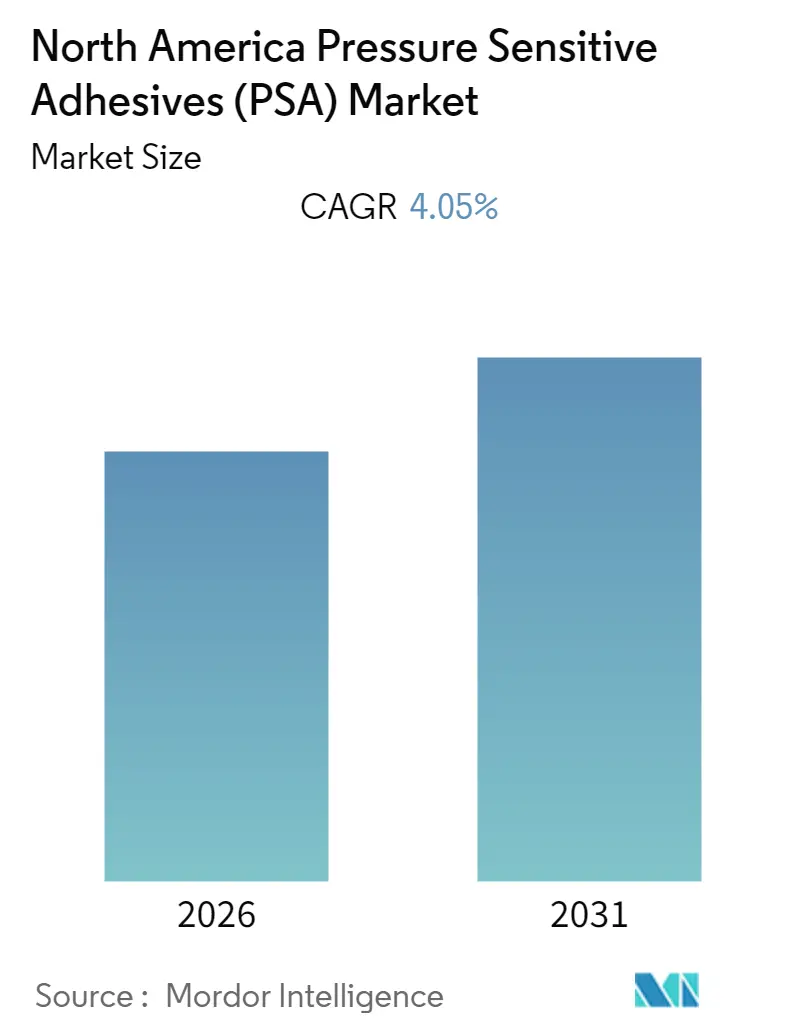
The North America Pressure Sensitive Adhesives(PSA) Market size is expected to register a CAGR of 4.05% during the forecast period 2026-2031.
- Adoption of bio-based pressure sensitive adhesives is expected to provide a major growth opportunity for the market studied in the coming future.
- United States accounted for the highest share of the market studied and is likely to continue dominating the market during the forecast period.
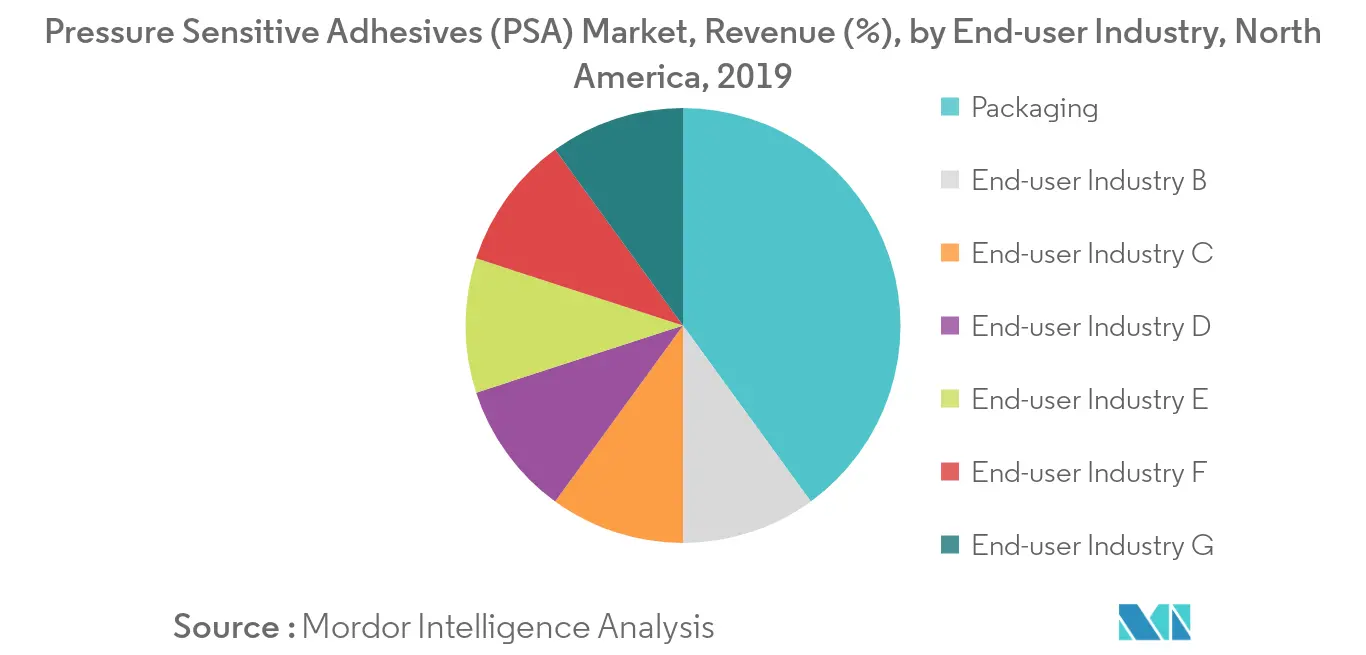
- Among the end-user industries, packaging industry accounted for the highest market share and is expected to dominate the market during the forecast period.
Note: Market size and forecast figures in this report are generated using Mordor Intelligence’s proprietary estimation framework, updated with the latest available data and insights as of 2026.
North America Pressure Sensitive Adhesives (PSA) Market Trends and Insights
Packaging Industry to Dominate the Market
- The North America Pressure Sensitive Adhesives (PSA) Market continues to benefit from the growing use of pressure-sensitive adhesives (PSAs) across the packaging industry, where they offer multiple operational and visual advantages.
- PSAs offer a timely way to make products compliant and shelf-ready. Pressure-sensitive adhesives are safer than glue sticks and more discrete than traditional tape. Unlike glue sticks, pressure-sensitive adhesives do not require heat during application. The absence of heat eliminates burns and increases safety among plant workers. Additionally, PSAs are less intrusive on packaging graphics, providing the required adhesion without sacrificing the brand image. Pressure-sensitive adhesives are less visible packaging solutions, which preserve the brand and maximise the impact.
- Application of pressure-sensitive adhesives is time-saving, as there is no need to wait until they cure. The moment they are applied, they compress the substrate, right at the moment when adhesion takes place. Instant bonding increases the processing speed, as well as improves production.
- PSAs provide a bond that removes cleanly without damaging the packaging or leaving behind residue. Preserving brand image adds to your consumer appeal.
- Additionally, in the last few years, the packaging industry in North America has been experiencing a transition, where the manufacturing and industrial sector has been adapting to flexible packaging.
- Hence, owing to the above-mentioned factors, packaging industry is likely to dominate the North America Pressure Sensitive Adhesives(PSA) Market


Acrylic Resin to Dominate the Market
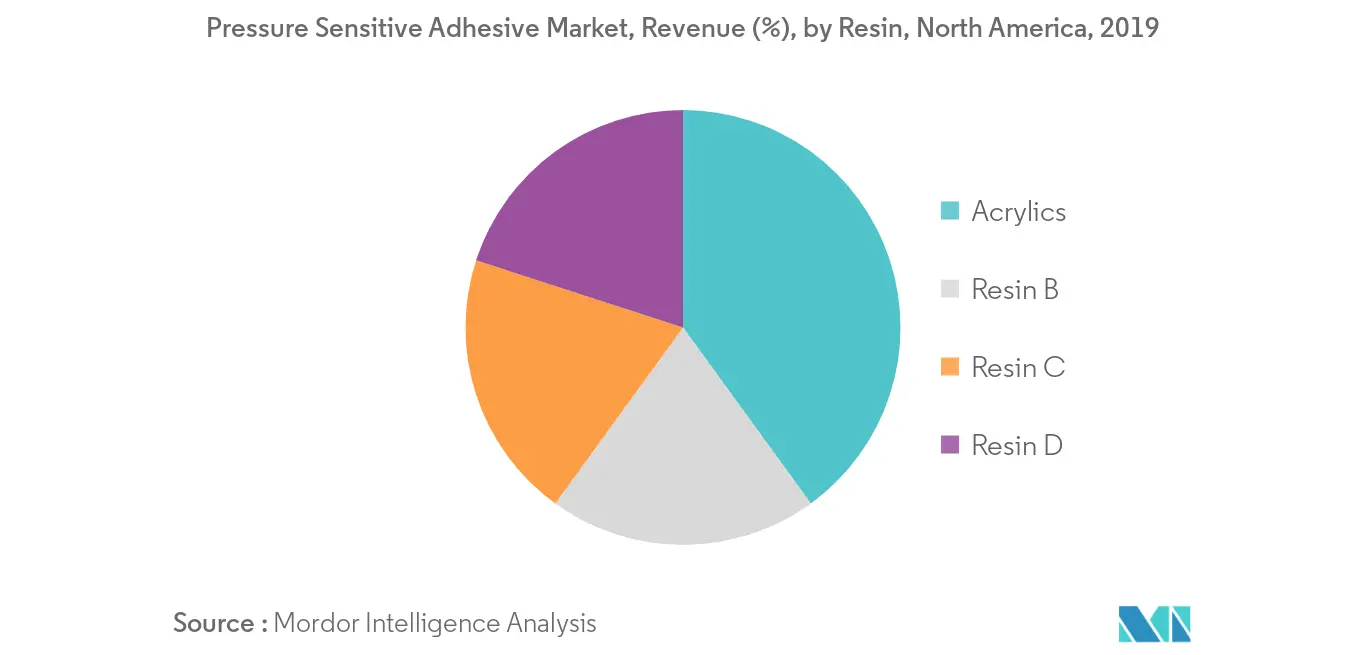
- Acrylics copolymers are known to be one of the most widely-used polymers for manufacturing pressure sensitive adhesives.
- These copolymers are made from a variety of acrylic monomers. These monomers offer viscoelastic performance characteristics. Moreover, numerous high-performance applications, which demand coating thickness and material properties, use acrylic borne PSA.
- Solvent-borne thermoplastic acrylic resin has good substrate adhesion, making it well suited for UV coating and metallic and pigmented base coats on substrates of ABS, ABS+PC, PS, PC, and metals.
- Acrylic resin-borne adhesives are highly used in the automotive sector. They also finding growing applications in the aerospace and marine sectors.
- Hence owing to the above-mentioned factors, acrylic resin types is expected to dominate the North America Pressure Sensitive Adhesives(PSA) Market.
Regulatory Landscape
Environmental and chemical-composition compliance is a central constraint for pressure sensitive adhesives (PSAs) in North America, particularly for solvent-borne formulations subject to volatile organic compound (VOC) controls. In the United States, VOC limits for adhesives and sealants are implemented through state air programs that align with federal Clean Air Act requirements. U.S. EPA actions provide a visible compliance anchor, including its June 2026 final approval of Connecticut state implementation plan revisions that clarify VOC calculation methods for adhesives and sealants (effective July 13, 2026).
In Canada, federal substance controls under CEPA and program administration through the Chemicals Management Plan shape raw-material selection and reformulation pathways. These controls are reinforced by the coming into force of the Prohibition of Certain Toxic Substances Regulations, 2025 (repealing the 2012 iteration). Cross-border supply chain planning also runs alongside trade governance, with industry bodies such as the American Chemistry Council flagging the 2026 USMCA review process as a focal point for maintaining regional chemical competitiveness and duty-free movement for inputs used in adhesive manufacturing.
Competitive Landscape
The North America pressure sensitive adhesives market is moderately consolidated as the market of the market share is divided among a few players. Some of the key players in the market include 3M, Arkema Group, Dow, Henkel AG & KGaA, and H.B. Fuller Company, among others.
North America Pressure Sensitive Adhesives (PSA) Industry Leaders
3M
Arkema Group
H.B. Fuller Company
Dow
Henkel AG & Co. KGaA
- *Disclaimer: Major Players sorted in no particular order
_Market_-_Market_Concentration.webp)

Market Opportunities and Future Outlook
Bio-based and lower-emission PSA formulations represent a clear whitespace in North America as end users and brand owners look for alternatives that align with VOC-focused compliance and broader chemical-content scrutiny, including PFAS-related attention in materials selection. The pull from packaging is reinforced by the report's market structure, with packaging as the largest end-user share, and the Adhesive and Sealant Council (ASC) as a reference point for downstream demand. ASC reported a 2025 combined North America adhesive and sealant market value of USD 24.83 billion and highlighted paper and board as the largest adhesive volume segment, a key substrate set for labels and tapes.
On the supply side, companies are pursuing opportunities through manufacturing and capability investments linked to advanced label and tape constructions that use PSA systems across facestocks, release liners, and lamination layers. UPM Adhesive Materials, for instance, announced plans in August 2025 to implement new proprietary coating technology at its Mills River, North Carolina facility to increase capacity for advanced label materials, reflecting ongoing demand for higher-performance, more sustainable label structures. Within the report scope, this supports continued product development around water-based PSAs, reformulated acrylic systems, and specialized tape and label constructions for packaging and other high-throughput converting applications.
Recent Industry Developments
- July 2026: 3M expanded its Scotch brand portfolio with the launch of Scotch Kids Tape for crafting and building projects. While positioned for consumer use, the launch keeps tape innovation and brand-led category development visible in a region where PSA-based tapes remain a core application. It also reinforces the strategic importance of differentiated tape performance attributes in mature distribution channels.
- January 2026: Henkel signed an agreement to acquire ATP Adhesive Systems, an expert in high-performance water-based specialty tapes with operations in North America and Europe. The deal strengthens Henkel's specialty tapes platform and supports a broader shift toward water-based technologies that align with customer sustainability and VOC-reduction requirements. It also adds application know-how in engineered tape constructions that rely on PSA performance consistency.
- December 2024: Arkema finalized the acquisition of Dow's flexible packaging laminating adhesives business. The transaction expands Arkema's packaging adhesives footprint and deepens its exposure to packaging converting customers that also consume PSA-based label and tape systems. It also underscores continued portfolio reshaping among major suppliers serving packaging-centric adhesive demand in North America.


Research Methodology Framework and Report Scope
Market Definition and Coverage
For this study, the North America pressure sensitive adhesives (PSA) market is defined as the value of PSA sold for use in tapes, labels, graphics, and other PSA-based applications across the United States, Canada, and Mexico, counted at the point of sale by producers and formulators.
Scope exclusions: This sizing excludes non-PSA adhesive systems (such as reactive and structural adhesives) and any downstream converted product value beyond the adhesive itself.
Segmentation Overview
- Resin
- Acrylics
- Silicones
- Elastomers
- Other Resins
- Technology
- Water-based
- Solvent-based
- Hot Melt
- Radiation
- Application
- Tapes
- Labels
- Graphics
- Other Applications
- End-user Industry
- Packaging
- Woodworking and Joinery
- Medical
- Commercial Graphics
- Transportation
- Electronics
- Other End-user Industries
- Geography
- United States
- Canada
- Mexico
Data Sources, Market Sizing, and Validation
Desk Research
Desk research was used to build the starting shape of the market and to keep inputs grounded in observable indicators. We relied on public sources such as the US Census Bureau and US International Trade Commission trade statistics, Statistics Canada industrial and trade releases, the US Bureau of Labor Statistics price series, and public resources from groups such as the Adhesive and Sealant Council and TAPPI for packaging and label context.
To connect demand signals to adhesives consumption, we also reviewed annual reports and investor presentations of listed materials and chemicals suppliers, along with technical papers and journals that describe PSA usage patterns and formulation shifts. Where company-level financial splits were not clear, paid subscriptions for company financials and intelligence, patent databases, and shipment-level import and export data were used selectively to validate business exposure and to cross-check supply movement trends. The desk sources listed here are illustrative only, and additional public and internal references were used for data collection, validation, and clarification.
Primary Interviews and Surveys
Primary work was used to pressure-test the desk model and to fill gaps that are common in PSA, especially where volume shifts get masked by price mix changes. We spoke with stakeholders across resin suppliers, PSA formulators, converters, and large end users, and then cross-checked assumptions across the United States, Canada, and Mexico so regional mix and trade flows were reflected consistently.
Distribution of primary research fieldwork respondents
| Company type | Respondent position |
|---|---|
| Top tier: 29% | CXOs: 14% |
| Mid tier: 54% | Functional/Unit leaders: 26% |
| Smaller Players: 17% | Managers: 60% |
Market-Sizing & Forecasting
The market was first constructed using a top-down demand pool build based on North America end use activity that typically drives PSA consumption, and then reconciled against production and trade signals. In practice, we tie the addressable pool to packaging and labeling output trends, tape consumption patterns in logistics and industrial use, and the mix of water-based, solvent-based, hot melt, and radiation-cured PSAs being adopted.
Once that demand picture is formed, selective bottom-up approximations are used as a reasonableness check, such as sampled supplier revenue splits by PSA, channel checks with converters, and value estimates built from volume proxies multiplied by typical average selling price bands. When coverage gaps appear for smaller suppliers or private players, the model fills them using capacity and utilization cues, import penetration logic, and application mix shares confirmed during interviews.
For forecasting, we rely mainly on scenario analysis supported by simple regression checks, where drivers such as packaging shipment trends, manufacturing activity, raw material cost direction, and technology substitution are varied within ranges that industry participants consider realistic. Assumptions are reviewed for consistency so growth is not created only by price inflation when interview feedback indicates mix or volume is changing.
Data Validation & Update Cycle
Outputs are validated through multiple cross-checks before sign-off, including variance checks against independent signals like trade movement, pricing direction, and reported capacity changes. If a segment shows an unusual jump, the underlying drivers are re-reviewed and, when needed, experts are re-contacted to confirm whether the shift is real or a modeling artifact.
A second analyst review is completed to confirm that definitions, unit conversions, and currency treatment are consistent across countries and years. Reports are refreshed annually, with interim updates when material events occur that can change supply, demand, or pricing, and a final pre-delivery sweep is done so clients receive the most current view.
Mordor Intelligence's North America Pressure Sensitive Adhesives Psa Market Estimate Compared With Other Published Estimates
Different publishers often land on different market sizes because the boundary of what counts as PSA can move, and the value can be captured at different points in the chain. Differences also show up when one estimate leans more on pricing assumptions, while another leans more on volume proxies, which matters in a market where mix and raw material pass-through can change quickly.
By tracking technology mix shifts and checking price progression against trade and inflation signals, Mordor Intelligence keeps the estimate focused on adhesive value (not converted tapes and labels), and it is further filtered through country-level consistency checks across the United States, Canada, and Mexico.
Benchmark comparison
| Source | Market Size | Gaps in Research Methodology |
|---|---|---|
| Mordor Intelligence | USD 3.17 B (2024) | |
| Global Consultancy A | USD 3.02 B (2024) | Uses a narrower chemistry and application mapping and appears to apply a more conservative price realization for the year, which can understate value when mix shifts toward higher-performance PSAs. |
| Industry Association B | USD 3.45 B (2024) | Blends adhesive value with portions of converter economics in tapes and labels for select end uses, and it also applies broader inclusion for specialty PSA uses, which inflates the counted revenue base. |
The spread across estimates mainly comes from what is counted as in-scope PSA revenue and how price and mix are treated in the base year. A model that ties value to clear application demand signals, and then cross-checks against trade and technology splits, tends to produce totals that are easier to repeat and audit year to year.


Key Questions Answered in the Report
What is the current North America Pressure Sensitive Adhesives (PSA) Market size?
The North America Pressure Sensitive Adhesives (PSA) Market is projected to register a CAGR of 4.05% during the forecast period (2026-2031)
Who are the key players in North America Pressure Sensitive Adhesives (PSA) Market?
3M, Arkema Group, H.B. Fuller Company, Dow and Henkel AG & Co. KGaA are the major companies operating in the North America Pressure Sensitive Adhesives (PSA) Market.
What years does this North America Pressure Sensitive Adhesives (PSA) Market cover?
The report covers the North America Pressure Sensitive Adhesives (PSA) Market historical market size for years: 2019, 2020, 2021, 2022, 2023 and 2024. The report also forecasts the North America Pressure Sensitive Adhesives (PSA) Market size for years: 2026, 2027, 2028, 2029, 2030 and 2031.
Page last updated on:


 Your data is secure and never sold or shared.


