
Non-GMO Yogurt Market Size and Share
Market Overview
| Study Period | 2021 - 2031 |
|---|---|
| Market Size (2026) | USD 1.56 Billion |
| Market Size (2031) | USD 1.98 Billion |
| Growth Rate (2026 - 2031) | 4.86 % |
| Fastest Growing Market | Middle East and Africa |
| Largest Market | North America |
| Market Concentration | Medium |
Major Players *Disclaimer: Major Players sorted in no particular order Image © Mordor Intelligence. Reuse requires attribution under CC BY 4.0. | |
Non-GMO Yogurt Market Analysis by Mordor Intelligence
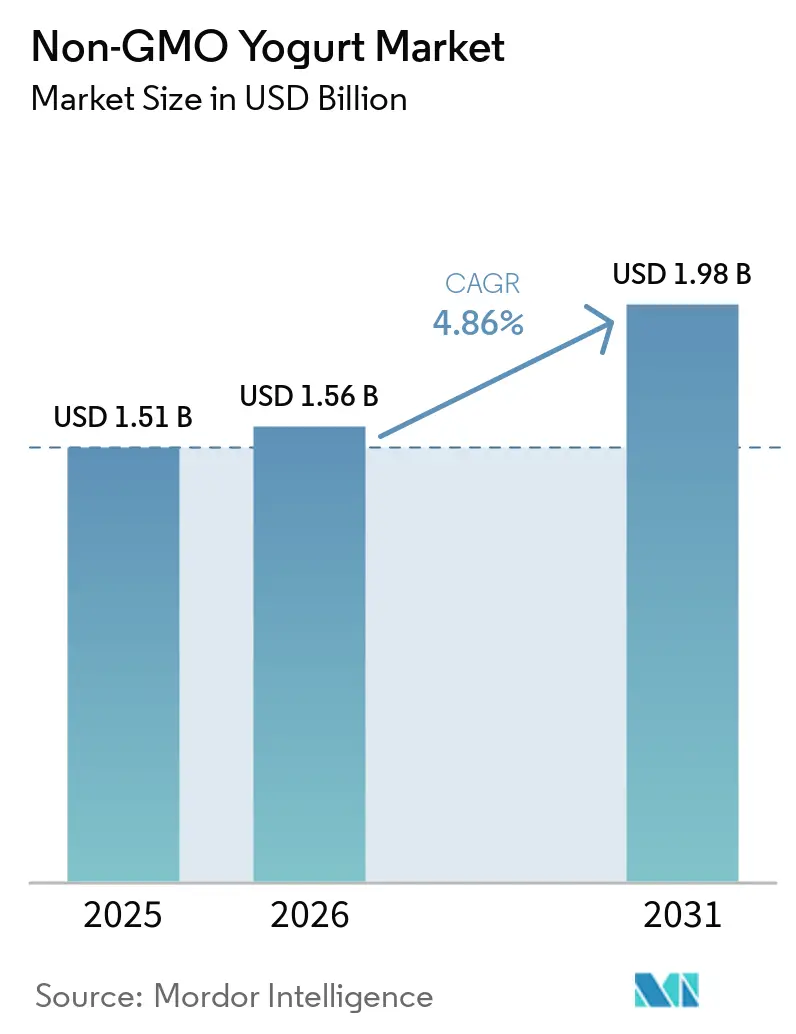
The non-GMO (non-Genetically Modified Organism) yogurt market is projected to grow from USD 1.51 billion in 2025 to USD 1.56 billion in 2026, and reach USD 1.98 billion by 2031, at a CAGR of 4.86% during 2026–2031. Demand for transparent ingredient sourcing, clean-label products, and verifiable claims drives this growth as consumers increasingly seek greater visibility into dairy production. The non-GMO verification requires traceability across animal feed, ingredients, processing, and packaging, supported by testing, segregation, and annual certification renewals. These requirements help manufacturers demonstrate compliance with non-GMO standards and strengthen consumer trust in product claims. The market also benefits from rising demand for high-protein, functional cultured dairy products, particularly among health-conscious consumers seeking convenient and nutritious options.
Key Report Takeaways
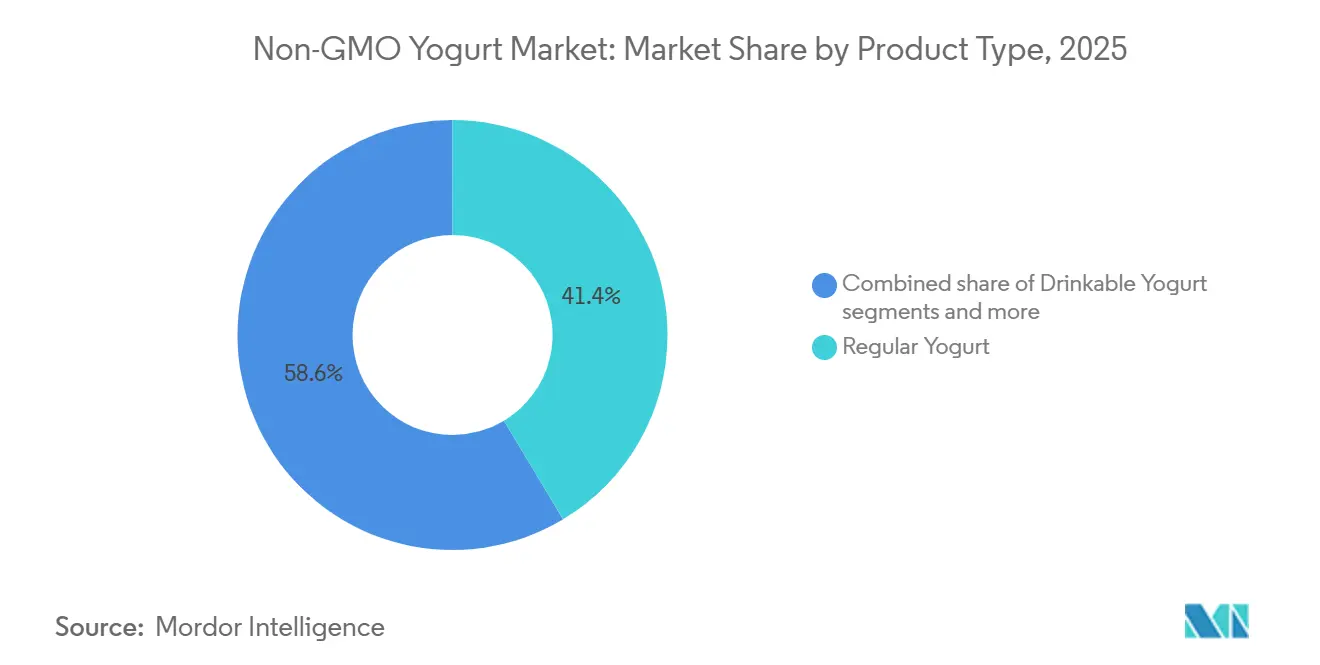
- By product type, regular yogurt held 41.42% of the non-GMO yogurt market share in 2025, while drinkable yogurt is forecasted to grow at a 7.02% CAGR through 2031.
- By fat content, low-fat accounted for 44.02% of the non-GMO yogurt market share in 2025 and is forecast to register the fastest growth at a 5.17% CAGR through 2031.
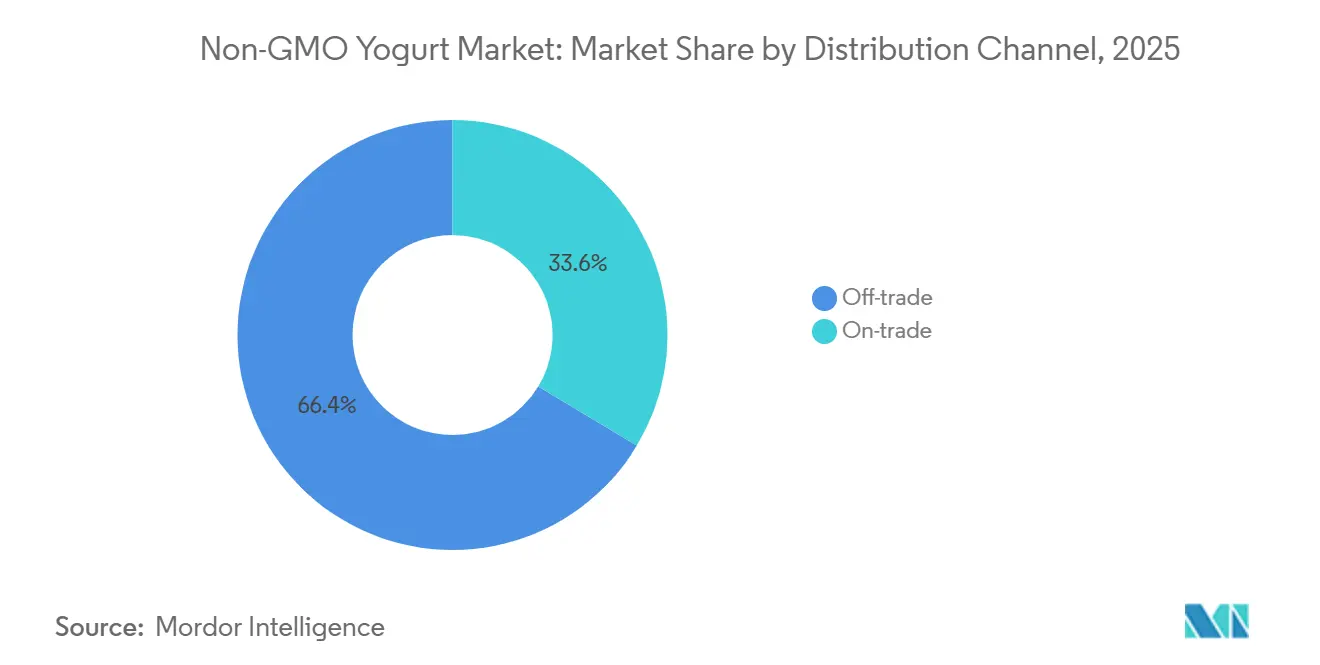
- By distribution channel, off-trade accounted for 66.40% of category sales in 2025 and is forecasted to grow at a 5.02% CAGR through 2031.
- By geography, North America accounted for 34.20% of global category sales in 2025, while Western Asia is forecast to grow at a 5.40% CAGR through 2031.
Note: Market size and forecast figures in this report are generated using Mordor Intelligence’s proprietary estimation framework, updated with the latest available data and insights as of January 2026.
Market Trends and Insights
Drivers Impact Analysis of Non-GMO Yogurt Market*
| Driver | (~) % Impact on CAGR Forecast | Geographic Relevance | Impact Timeline |
|---|---|---|---|
| Rising Demand for Clean-Label and Non-GMO Ingredients | +1.3% | Global, led by North America and Europe | Short term (≤ 2 years) |
| Growing Demand for Functional and Probiotic Yogurt | +1.1% | North America, Europe, and core Asia-Pacific markets | Medium term (2-4 years) |
| Increasing Consumer Focus on Sustainable Dairy Production | +0.8% | Europe and North America | Medium term (2-4 years) |
| Growing Consumer Preference for Animal Welfare and Ethical Dairy Sourcing | +0.6% | Europe, with spillover into North America | Medium term (2-4 years) |
| Increasing Supply Chain Traceability and Non-GMO Verification | +0.5% | Global | Long term (≥ 4 years) |
| Greater Product Innovation Following Yogurt Standard Modernization | +0.7% | North America | Short term (≤ 2 years) |
| Source: Mordor Intelligence | |||
Rising Demand for Clean-Label and non-GMO Ingredients
Growing consumer preference for transparent ingredients and traceable sourcing is driving demand for clean-label and non-GMO yogurt products. Non-GMO verification provides an additional sourcing credential alongside organic certification, helping brands differentiate their products [1]. The trend is supported by consumers increasingly evaluating multiple value-based claims, including organic, non-GMO, and animal-welfare attributes. However, manufacturers must maintain strong supplier documentation and traceability to substantiate these claims. Evolving non-GMO Project standards may further encourage manufacturers to strengthen ingredient sourcing and verification practices.
Growing Demand for Functional and Probiotic Yogurt
Rising demand for high-protein, probiotic, and functional dairy products is driving growth in the non-GMO yogurt market. Consumers increasingly seek products that support digestive health, provide nutritional benefits, and align with preferences for clean-label and transparently sourced ingredients. According to the FDA (Food and Drug Administration), manufacturers use various methods to produce high-protein yogurt, including straining, membrane concentration, and protein fortification[2]. These methods enable brands to offer differentiated products that combine protein, live cultures, and transparent sourcing. Innovation in cultured dairy products, including protein- and probiotic-rich drinkable formats, is further expanding the applications of functional yogurt and supporting product diversification across the market.
Increasing Consumer Focus on Sustainable Dairy Production
Growing consumer interest in sustainable and transparent dairy sourcing is driving demand for non-GMO yogurt products. Consumers increasingly seek information on farm practices, ingredient origins, animal welfare, and environmental standards in addition to non-GMO claims. Large dairy companies are strengthening traceability and supplier management systems to support multiple sourcing credentials. These measures improve transparency and enable brands to substantiate their non-GMO and sustainability claims. As premium dairy products increasingly emphasize responsible sourcing, robust supply chain controls can provide a competitive advantage in the non-GMO yogurt market.
Growing Consumer Preference for Animal Welfare and Ethical Dairy Sourcing
The rising consumer interest in animal welfare and ethical dairy sourcing is driving demand for transparent and non-GMO yogurt products. Consumers increasingly seek assurance that dairy products are produced responsibly with attention to animal care, feed quality, and ingredient integrity. Independent animal welfare certifications, traceable supply chains, and transparent farm sourcing practices can strengthen consumer trust by increasing visibility into animal care standards, farming practices, and ingredient sourcing. This trend is particularly relevant in the premium yogurt market, where credible sourcing attributes can differentiate products, strengthen brand credibility, and justify premium pricing. As consumers increasingly assess dairy production practices, brands that demonstrate verifiable sourcing, uphold animal welfare standards, and provide clear product labeling can gain a competitive advantage and foster stronger consumer loyalty.
Restraints Impact Analysis of Non-GMO Yogurt Market*
| Restraint | (~) % Impact on CAGR Forecast | Geographic Relevance | Impact Timeline |
|---|---|---|---|
| Price Premium Compared with Conventional Yogurt | -0.7% | Global, most acute in Latin America and Middle East and Africa | Short term (≤ 2 years) |
| Higher Costs of Non-GMO Certification and Compliance | -0.5% | Global | Medium term (2-4 years) |
| Limited Availability of Non-GMO Dairy Inputs | -0.3% | North America and Europe | Long term (≥ 4 years) |
| Complexity in Maintaining Non-GMO Supply Chain Integrity | -0.2% | Global | Long term (≥ 4 years) |
| Source: Mordor Intelligence | |||
Price Premium Compared with Conventional Yogurt
Non-GMO yogurt typically commands a price premium over conventional yogurt due to its additional verification, testing, traceability and supply chain management requirements. This premium may limit adoption among price sensitive consumers particularly in markets where conventional private label yogurt is widely available at lower prices. The challenge is more pronounced for protein-fortified, probiotic and flavored products which often require more complex ingredient sourcing and verification processes. Although some consumers are willing to pay more for certified attributes, manufacturers must clearly communicate the product’s value to justify the premium. Consequently manufacturers need, to balance certification and sourcing costs with competitive pricing to sustain consumer demand.
Higher Costs of non-GMO Certification and Compliance
Higher certification and compliance costs can constrain the non-GMO yogurt market by increasing expenses beyond the initial verification fee. Manufacturers must manage supplier documentation, ingredient traceability, testing, segregation, and ongoing record maintenance, which adds operational complexity. These requirements become more challenging for products with multiple ingredients, including flavored, probiotic, and protein-fortified yogurts. Smaller manufacturers may face greater cost pressures due to limited resources and lower purchasing volumes. As verification standards evolve, companies may also need to review and adjust their sourcing practices, further increasing compliance costs.
*Our forecasts treat driver/restraint impacts as directional, not additive. The impact forecasts reflect baseline growth, mix effects, and variable interactions.
Non-GMO Yogurt Market Segment Analysis
By Product Type:
Regular Yogurt Leads, Protein Formats AccelerateRegular yogurt remained the dominant product type, accounting for 41.42% of category sales in 2025. Its familiarity, widespread availability, and suitability for everyday breakfast and snacking supported this position. Drinkable yogurt is projected to grow at a CAGR of 7.02% through 2031, driven by demand for convenient, portable dairy options. Its liquid format appeals to consumers seeking quick consumption without preparation. This format also enables manufacturers to introduce flavored, fortified, and functional variants. The established demand for regular yogurt and rising preference for convenience continue to shape product innovation in the market.
Greek and strained yogurt, blended yogurt, and other formats are gaining importance as manufacturers diversify non-GMO yogurt offerings beyond traditional products. Greek and strained yogurt benefit from their thick texture and high-protein positioning, attracting consumers seeking more substantial yogurt options. Blended yogurt offers greater flexibility for flavor, fruit, and ingredient combinations, supporting product differentiation. The other category includes specialized and emerging formats that cater to niche consumer preferences and consumption occasions. These formats enable manufacturers to expand their product portfolios while meeting demand for variety and differentiated attributes.

By Fat Content:
Low-Fat Retains a Broad Consumer BaseLow-fat yogurt is both the largest and fastest-growing fat-content segment, accounting for 44.02% of category sales in 2025 and projected to grow at a 5.17% CAGR through 2031. Its leading position reflects consumer preference for products that balance protein content with calorie-conscious choices. Low-fat yogurt also provides a versatile base for protein, fruit, and probiotic formulations. This makes it an attractive format for manufacturers seeking to combine non-GMO positioning with functional attributes. Robust ingredient controls can further support transparent sourcing and verification. Overall, its strong market share and growth outlook make low-fat yogurt a key focus for product innovation.
Full-fat yogurt remains relevant among consumers seeking a richer texture and among those who prefer products positioned as organic or grass-fed dairy. Non-fat yogurt primarily appeals to consumers seeking lower-calorie options, though manufacturers must formulate it carefully to maintain taste and texture. Both segments offer opportunities for differentiation through flavors, protein content, probiotics, and clean-label formulations. However, flavored variants may require more extensive ingredient documentation to meet non-GMO verification requirements. Manufacturers can benefit from simplified formulations and well-documented ingredient sourcing enabling brands to balance product differentiation, compliance and consumer expectations.
By Distribution Channel:
Off-Trade Retail Remains CentralOff-trade remained the dominant distribution channel, accounting for 66.40% of category sales in 2025 and is projected to grow at a CAGR of 5.02% through 2031. Supermarkets, hypermarkets, specialty stores, and other retail outlets provide strong visibility for non-GMO yogurt products. These channels enable consumers to compare labels, prices, flavors, and pack sizes when making purchase decisions. Reliable cold-chain infrastructure also supports the distribution of refrigerated yogurt across physical retail networks. Retailers can further enhance product visibility through strategic shelf placement, promotions, and clear communication of non-GMO credentials.
On-trade channels, including restaurants, cafés, hotels, and other foodservice establishments, offer opportunities to expand non-GMO yogurt consumption beyond household use. Growing consumer interest in transparent ingredient sourcing and premium dairy products supports demand through these channels. Foodservice operators can incorporate yogurt into breakfast menus, smoothies, desserts, and other prepared foods, creating a variety of applications. On-trade channels can strengthen market opportunities by expanding non-GMO yogurt into prepared foods and premium foodservice offerings. Strong supplier documentation and traceability can further support credible non-GMO positioning across the foodservice supply chain.
Geography Analysis
North America and Western Asia Non-GMO Yogurt Market
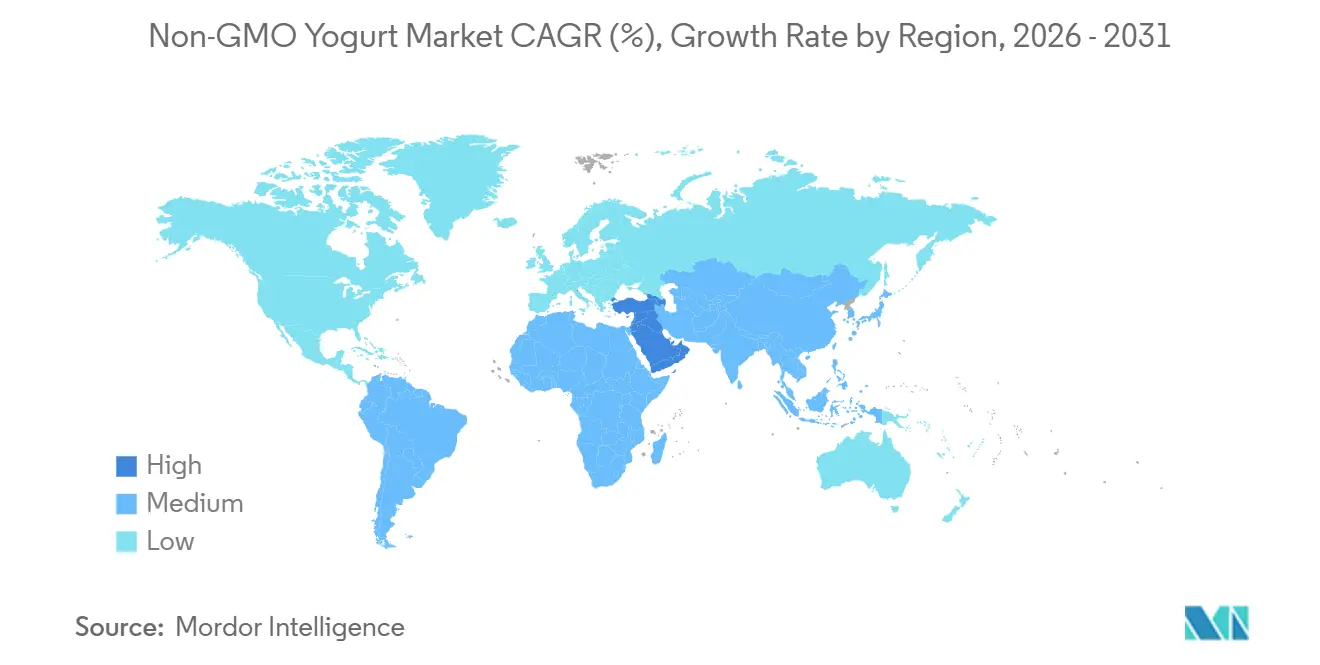
North America accounted for the largest market share at 34.20% in 2025. Strong consumer demand for organic, clean-label and verified dairy products coupled with well-established non-GMO certification and retail infrastructure supports this position[3]. Western Asia is expected to be the fastest-growing region registering a CAGR of 5.40% through 2031. Urban development, the expansion of modern retail channels and rising demand for premium dairy products drive this growth. The United Arab Emirates and Saudi Arabia represent key markets supported by improving cold-chain infrastructure and the growing distribution of premium food products. North America is expected to retain its leading revenue position while Western Asia is likely to experience faster market growth over the forecast period.
Europe and APAC Non-GMO Yogurt Market
Europe remains a key market for non-GMO yogurt, driven by strong consumer awareness of organic, traceable, and responsibly sourced dairy products. The United Kingdom, Germany, France, Italy, and Spain represent major markets supported by established dairy consumption, well-developed retail networks, and demand for premium products. The Netherlands, Belgium, Sweden, and Poland also offer additional growth opportunities. Asia-Pacific offers significant growth potential particularly in China, India, Japan, South Korea, Australia, Indonesia, Thailand and Singapore. Expanding modern retail channels, rising demand for convenient and functional dairy products drive market growth across the region. China and India provide substantial volume opportunities while Japan, South Korea, Australia and Singapore are more suited to premium and specialized yogurt offerings.
Europe, APAC and South America Non-GMO Yogurt Market
South America presents an emerging growth opportunity led by Brazil while Argentina, Colombia, Chile and Peru offer additional potential as modern retail channels expand and premium dairy consumption increases. Consumers increasingly prioritize protein content, ingredient transparency, product quality and responsible sourcing, supporting demand for differentiated yogurt products. Manufacturers can address through localized sourcing, appropriately sized packaging and selective distribution through modern retail channels. Across Europe, Asia-Pacific and South America, brands that combine non-GMO positioning with affordability, clear labeling and familiar product formats are best positioned to capitalize on opportunities.
Competitive Landscape
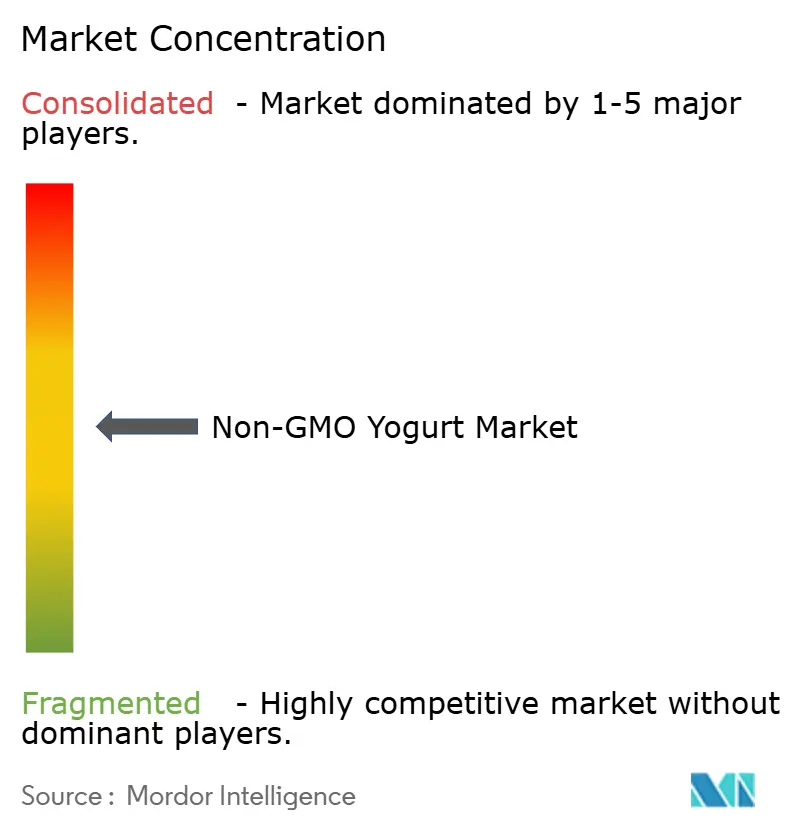
The non-GMO yogurt market is moderately fragmented, with a diverse competitive landscape. The market comprises large dairy companies, organic specialists, and focused cultured dairy brands. Key competitive factors include brand recognition, distribution reach, sourcing capabilities, product innovation, and the credibility of non-GMO claims. Large manufacturers benefit from production scale and established supply chain networks, while specialist brands compete through focused product portfolios and differentiated sourcing strategies. Ongoing verification and traceability requirements favor companies with robust supply chain systems. Overall, the market remains moderately fragmented rather than highly consolidated, creating opportunities for both major manufacturers and niche brands.
Portfolio expansion and strategic acquisitions are reshaping competition across the broader yogurt category, enabling companies to strengthen their brand presence, diversify product offerings, and enter new consumer segments. Effective digital traceability systems can further strengthen supplier management, documentation, and sourcing transparency, while supporting quality control and compliance across the supply chain. Functional and premium cultured dairy innovation also remains a key competitive factor in the market. Companies are introducing products that emphasize protein, probiotics, convenience, and clean-label formulations to meet evolving consumer preferences for health, transparency, product quality, and differentiated nutritional benefits.
Large manufacturers benefit from economies of scale, established brand recognition and extensive distribution networks that support broad market reach and efficient product availability. In contrast specialist brands compete by building consumer trust, maintaining focused sourcing practices and offering distinctive products tailored to specific consumer preferences. Companies that combine credible non-GMO verification with clear functional or premium positioning are likely to strengthen their competitive position, differentiate their offerings and capture demand across premium cultured dairy product categories.
Non-GMO Yogurt Industry Leaders
-
Chobani, LLC
-
FAGE International S.A.
-
Yili Group
-
Lactalis Group
-
Danone SA
- *Disclaimer: Major Players sorted in no particular order
Non-GMO Yogurt Market Companies Covered in this Report
- Chobani, LLC
- Danone S.A.
- FAGE International S.A.
- Lactalis Group (Stonyfield Farm, Inc.)
- Yili Group
- Straus Family Creamery
- Springfield Creamery (Nancy's)
- Emmi Group (Redwood Hill Farm & Creamery)
- Clover Sonoma
- Organic Meadow Limited Partnership
- Kite Hill
- Kalona SuperNatural
- Brown Cow
- Maia Yogurt
- Old Chatham Creamery
- Seven Stars Farm
- Milchwerke Schwaben eG
- Trimona
- YoGut
- Walmart Inc. (bettergoods) (Global Market Insights Inc.)
Recent Industry Developments in Non-GMO Yogurt Market
- March 2026: Smoothie King launched a high-protein Greek yogurt lineup featuring yogurt bowls and gut-health smoothies made with non-GMO fruits, Greek yogurt, granola, chia seeds, and protein.
- January 2026: KEFIRKULT highlighted its Coconut Kefir Yogurt, a non-GMO Project Verified product featuring proprietary probiotic strains and a high probiotic count. The product combines non-GMO positioning with clean-label and functional attributes, including a simple ingredient profile and formulations without thickeners, emulsifiers or additives.
- May 2025: Nounós Creamery launched its A2 Greek Yogurt made with 100% A2/A2 milk and non-GMO Project Verified. The product combines non-GMO verification with Greek-style yogurt, probiotic positioning and regenerative farming practices reflecting growing product differentiation within premium dairy.
Global Non-GMO Yogurt Market Report Scope
The non-GMO yogurt market comprises yogurt products made with non-genetically modified ingredients and supported by verified sourcing practices. The market is segmented by product type, fat content, distribution channel, and geography. Product types include regular yogurt, Greek and strained yogurt, drinkable yogurt, blended yogurt, and other yogurt formats. By fat content, the market includes full-fat, low-fat, and non-fat formulations. Distribution channels include on-trade and off-trade, with off-trade further categorized into supermarkets and hypermarkets, convenience stores, specialty organic stores, and other channels. Geographically, the market is analyzed across North America, Europe, Asia-Pacific, South America, the Middle East, and Africa.
Segmentation Overview
| Regular Yogurt |
| Greek and Strained Yogurt |
| Drinkable Yogurt |
| Blended Yogurt |
| Others |
| Full Fat |
| Low Fat |
| Non-Fat |
| On-Trade | |
| Off-Trade | Supermarkets and Hypermarkets |
| Convenience Stores | |
| Specialty Organic Stores | |
| Others |
| North America | United States |
| Canada | |
| Mexico | |
| Rest of North America | |
| Europe | United Kingdom |
| Germany | |
| France | |
| Italy | |
| Spain | |
| Netherlands | |
| Poland | |
| Belgium | |
| Sweden | |
| Rest of Europe | |
| Asia-Pacific | China |
| Japan | |
| India | |
| Australia | |
| Indonesia | |
| South Korea | |
| Thailand | |
| Singapore | |
| Rest of Asia-Pacific | |
| South America | Brazil |
| Argentina | |
| Colombia | |
| Chile | |
| Peru | |
| Rest of South America | |
| Middle East and Africa | South Africa |
| Saudi Arabia | |
| United Arab Emirates | |
| Nigeria | |
| Egypt | |
| Morocco | |
| Turkey | |
| Rest of Middle East and Africa |
| By Product Type | Regular Yogurt | |
| Greek and Strained Yogurt | ||
| Drinkable Yogurt | ||
| Blended Yogurt | ||
| Others | ||
| By Fat Content | Full Fat | |
| Low Fat | ||
| Non-Fat | ||
| By Distribution Channel | On-Trade | |
| Off-Trade | Supermarkets and Hypermarkets | |
| Convenience Stores | ||
| Specialty Organic Stores | ||
| Others | ||
| By Geography | North America | United States |
| Canada | ||
| Mexico | ||
| Rest of North America | ||
| Europe | United Kingdom | |
| Germany | ||
| France | ||
| Italy | ||
| Spain | ||
| Netherlands | ||
| Poland | ||
| Belgium | ||
| Sweden | ||
| Rest of Europe | ||
| Asia-Pacific | China | |
| Japan | ||
| India | ||
| Australia | ||
| Indonesia | ||
| South Korea | ||
| Thailand | ||
| Singapore | ||
| Rest of Asia-Pacific | ||
| South America | Brazil | |
| Argentina | ||
| Colombia | ||
| Chile | ||
| Peru | ||
| Rest of South America | ||
| Middle East and Africa | South Africa | |
| Saudi Arabia | ||
| United Arab Emirates | ||
| Nigeria | ||
| Egypt | ||
| Morocco | ||
| Turkey | ||
| Rest of Middle East and Africa | ||
Key Questions Answered in the Report
What is the market size of non-GMO yogurt market?
The global non-GMO yogurt market was valued at USD 1.51 billion in 2025 and is estimated at USD 1.56 billion in 2026. The market is projected to reach USD 1.98 billion by 2031, registering a CAGR of 4.86% during the forecast period (2026–2031).
Which non-GMO yogurt product type is growing fastest?
Drinkable Yogurt is the fastest-growing product type with a forecast CAGR of 7.02% through 2031.
Which region leads sales of non-GMO yogurt?
North America led with 34.20% share in 2025 supported by developed verification infrastructure and established demand for organic and clean-label dairy.
What limits wider adoption of non-GMO yogurt?
Price premiums, verification costs, the availability of documented inputs and supply chain traceability requirements can limit adoption especially in price-sensitive channels.