India Private Equity Market Size and Share
Market Overview
| Study Period | 2019 - 2030 |
|---|---|
| Forecast Data Period | 2025 - 2030 |
| Historical Data Period | 2019 - 2023 |
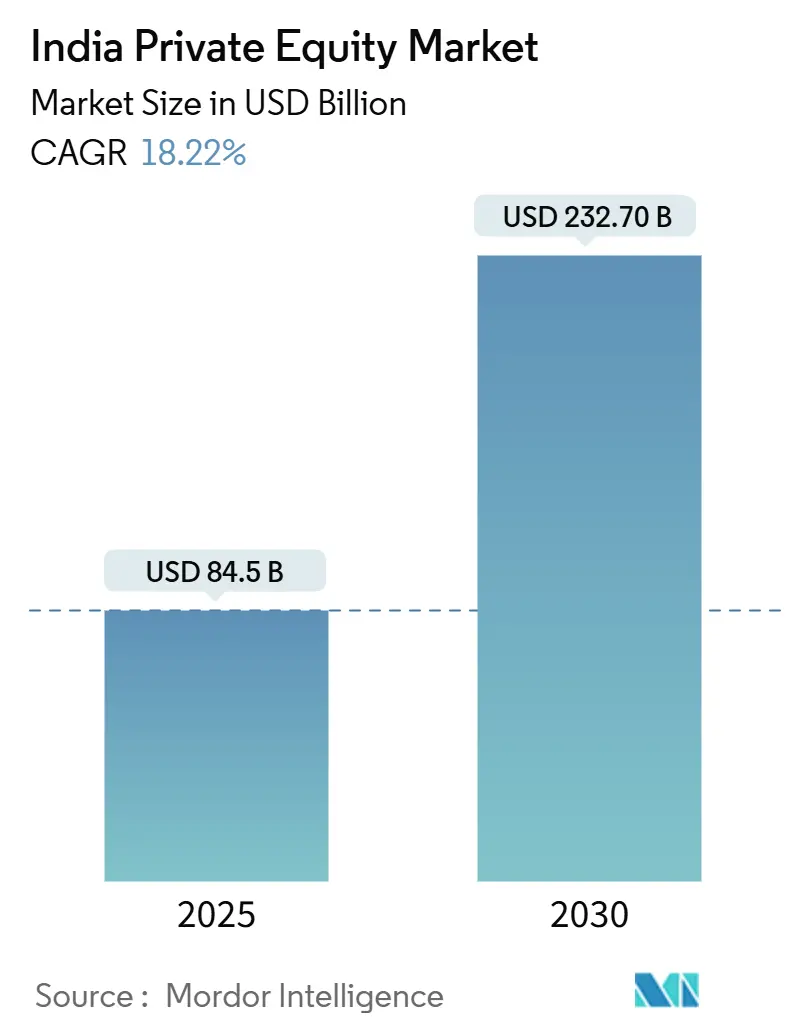
| Market Size (2025) | USD 84.5 Billion |
| Market Size (2030) | USD 232.70 Billion |
| Growth Rate (2025 - 2030) | 18.22% CAGR |
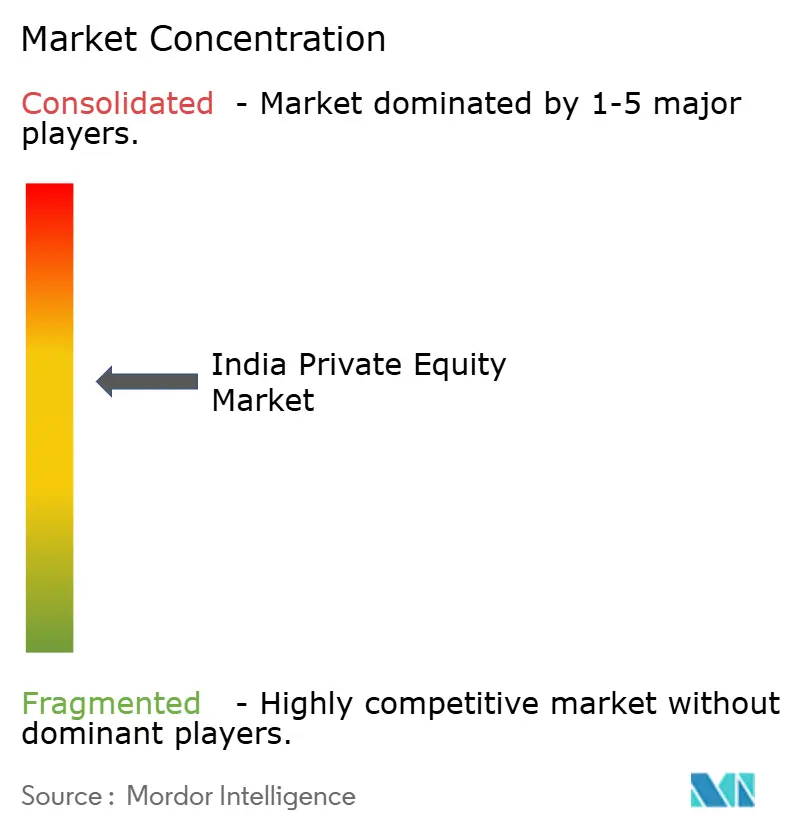
| Market Concentration | Medium |
Major Players *Disclaimer: Major Players sorted in no particular order Image © Mordor Intelligence. Reuse requires attribution under CC BY 4.0. | |
India Private Equity Market Analysis by Mordor Intelligence
The India private equity market stands at USD 84.5 billion in 2025 and is on track to swell to USD 232.7 billion by 2030, compounding at 18.22%CAGR annually. This expansion reflects the country’s appeal as a capital destination that combines macroeconomic resilience, regulatory modernization, and deepening domestic liquidity. 2024 reforms under the Specialized Investment Fund (SIF) framework gave institutional investors a domestic on-ramp to private-market strategies and raised governance standards. Family-office participation has broadened the local investor base, while digitised deal-sourcing tools compress transaction timelines and level the playing field for emerging managers. Sector rotation into renewables, healthcare, and deep-tech adds a diversified pipeline of growth assets; meanwhile, a more stable rupee and tighter hedging regimes lower currency-related return erosion. Heightened competition among large global funds is encouraging value-creation expertise, partnership structures, and exit innovation, particularly GP-led secondaries, cementing India’s position as a core allocation for global limited partners.
Key Report Takeaways
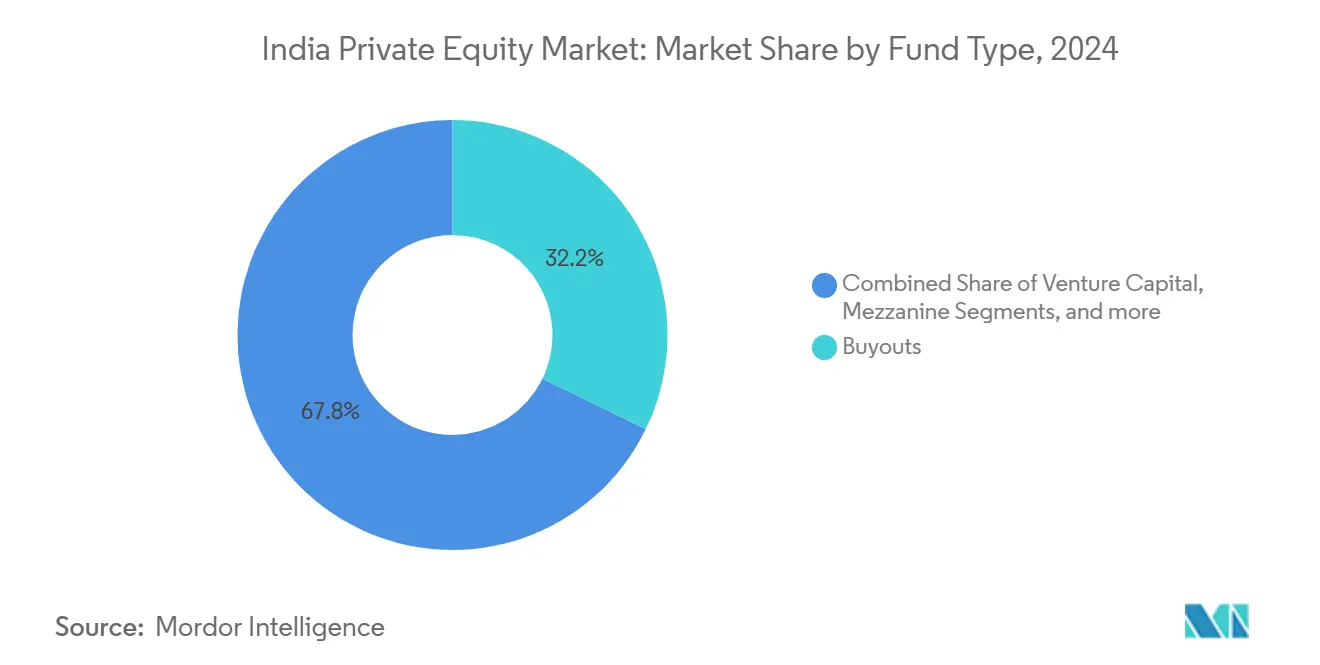
- By fund type, buyout strategies led with 32.20% of the India private equity market share in 2024; secondaries and fund-of-funds are projected to expand at an 18.32% CAGR through 2030.
- By sector, technology software captured 23.45% revenue share in 2024, while energy and power is forecast to advance at a 24.11% CAGR to 2030.
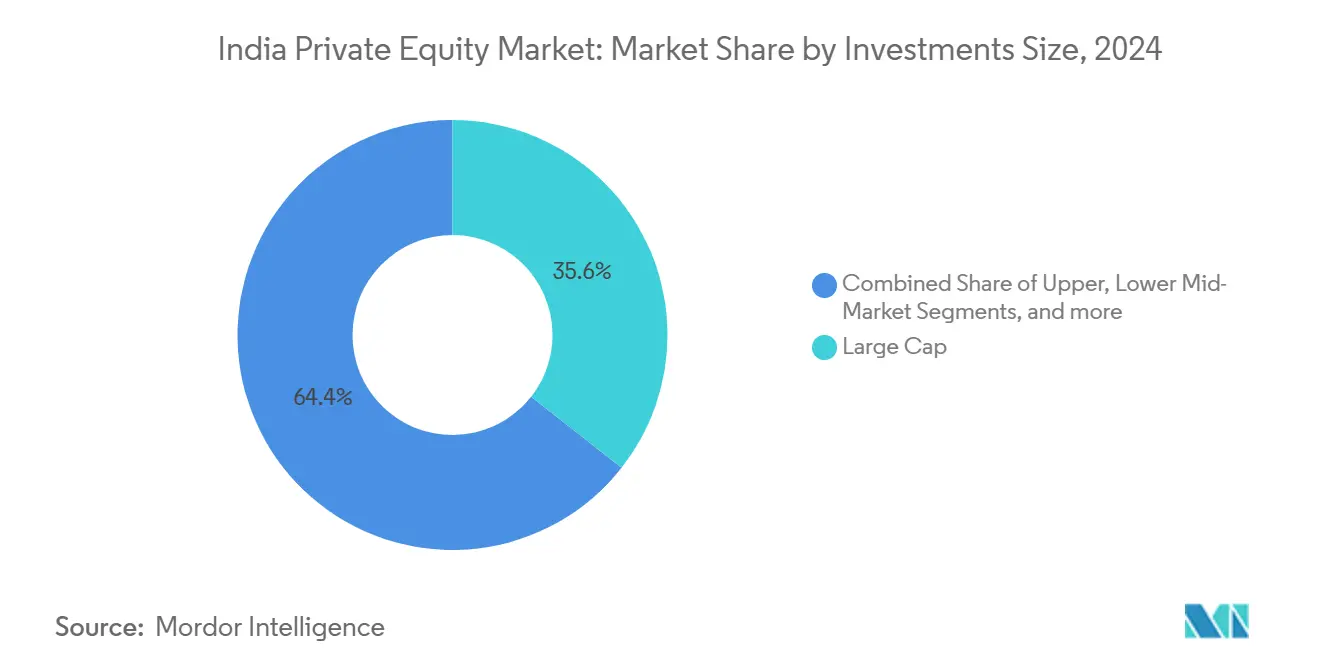
- By investment size, large-cap deals commanded 35.60% of the India private equity market size in 2024; the small and SMID-cap cohort is expected to grow at a 16.81% CAGR between 2025-2030.
- By region, West India held 34.56% of the India private equity market share in 2024 and is set to post a 16.75% CAGR through 2030.
- Blackstone, KKR, and Temasek together accounted for more than one-fifth of disclosed 2024 deployment volumes in the India private equity market.
India Private Equity Market Trends and Insights
Drivers Impact Analysis*
| Driver | ( ~ ) % Impact on CAGR Forecast | Geographic Relevance | Impact Timeline |
|---|---|---|---|
| Digitisation of deal-sourcing platforms | +2.1% | Global; early adoption in West India | Short term (≤ 2 years) |
| Surge in family-office capital allocations | +2.8% | National; dense in West & North | Medium term (2-4 years) |
| Government push for domestic AIF structures | +1.9% | National; hubs in Mumbai & GIFT City | Medium term (2-4 years) |
| Emergence of deep-tech & climate-tech corridors | +2.4% | South & West; spillover to North | Long term (≥ 4 years) |
| Mainstream adoption of GP-led secondary funds | +1.7% | Global; centered in financial hubs | Short term (≤ 2 years) |
| Private credit replacing bridge rounds | +2.2% | National; strong in industrial belts | Medium term (2-4 years) |
| Source: Mordor Intelligence | |||
Digitization of Deal-Sourcing Platforms
Machine-learning engines now scrape filings, IP databases, and social platforms to surface hidden targets, enabling mid-market funds to triple their qualified-pipeline volume without proportional head-count expansion. Integrated virtual-data-room tools compress diligence to weeks, allowing GPs to table term-sheets ahead of slower rivals and lift win rates in competitive auctions[1]NASSCOM, “India’s DeepTech Dawn: Forging Ahead,” community.nasscom.in. Platform APIs pipe real-time metrics straight to valuation models, which reduces mis-pricing risk and supports tighter bid spreads. For LPs, digital transparency lowers information asymmetry and makes fund selection more quantitative, driving a virtuous loop of capital re-allocation toward top-quartile managers. The dynamic also fuels co-investment syndication because deal snapshots can be broadcast instantly to LP dashboards. These efficiencies collectively enhance velocity inside the India private equity market, pushing throughput without sacrificing underwriting rigor.
Surge in Family-Office Capital Allocations
Average cheque sizes from Indian family offices rose from USD 8 million in 2022 to USD 13 million in 2024, reflecting rising comfort with direct control stakes. Many offices are now hiring ex-investment-bank teams, which upgrades diligence sophistication and positions them as credible lead investors rather than passive co-investors. Because these entities recycle domestic dividends, capital is stickier than foreign inflows and allows funds to navigate risk-off global cycles without pausing deployment. Direct participation also shortens fund-raising timelines; GPs routinely close 20-30% of a vehicle in a single anchor round backed by prominent families. A growing number of cross-border diaspora offices funnel capital through GIFT City AIFs in foreign currency, sidestepping rupee-volatility drag. As their governance expectations rise, they press managers for ESG dashboards and independent portfolio valuations, indirectly lifting industry standards across the India private equity market.
Government Push for Domestic AIF Structures
SEBI’s 2024–25 ruleset now permits Category II AIFs to warehouse seed assets for 12 months, letting managers show a live track record before broader launch and thus de-risking first-time funds[2]Securities and Exchange Board of India, “Consultation Paper on Introduction of New Asset Class/Product Category,” sebi.gov.in. Harmonized capital-gains treatment removes the earlier ambiguity between business income and investment income, an uncertainty that inflated effective tax outgo by up to 400 basis points. Pension and insurance regulators have raised exposure caps to 5% of total investible corpus, releasing a sizeable rupee pool that previously sat in low-yield debt. Mandatory independent custodians and valuation advisers boost institutional comfort, driving an uptick in ticket sizes from USD 100 million-plus allocators. Meanwhile, GIFT City has begun fast-tracking fund registrations in under 45 days, down from 120 days last year, narrowing the friction gap with Singapore and Mauritius. Combined, these levers reinforce the India private equity market as a home-domiciled, full-stack ecosystem rather than an offshore-centered satellite.
Emergence of Deep-Tech and Climate-Tech Corridors
Deep-tech patents filed by Indian start-ups jumped 38% in 2024, giving private-equity funds proprietary R&D assets that support premium valuations at exit. Anchor customers include the defense ministry and global automakers seeking low-cost innovation labs, which shortens commercialization runways and underwrites revenue visibility. Climate-tech plays such as battery storage or green hydrogen enjoy multi-decade government demand guarantees, mitigating policy-reversal risk. Venture-growth crossover funds now syndicate with infrastructure specialists, blending operational skill sets and unlocking mega-rounds that previously exceeded single-fund capacity. Knowledge clusters in Bengaluru and Hyderabad create supplier-investor-university loops, ensuring talent inflow and lowering attrition in core engineering roles. These synergies deepen the future pipeline for the India private equity market while expanding optionality beyond consumer-tech mainstays.
Restraints Impact Analysis*
| Restraint | ( ~ ) % Impact on CAGR Forecast | Geographic Relevance | Impact Timeline |
|---|---|---|---|
| Uncertain capital-gains tax regime | -1.8% | National; heavier on offshore structures | Short term (≤ 2 years) |
| Scarcity of late-stage IPO windows | -1.4% | National; metro exchanges | Medium term (2-4 years) |
| Currency-hedging costs for offshore LPs | -1.1% | Global limited partners | Short term (≤ 2 years) |
| Stewardship & ESG-related litigations | -0.9% | National; listed companies | Long term (≥ 4 years) |
| Source: Mordor Intelligence | |||
Uncertain Capital-Gains Tax Regime
The Budget 2025 proposal to classify all Category II AIF holdings as capital assets offers clarity yet lack of grandfathering forces funds to reassess legacy positions for potential retrospective exposure. Offshore sponsors remain apprehensive about GAAR override risk if treaty shopping is alleged, leading some to split structures between onshore feeders and offshore masters, which inflates administrative drag. Carry taxation is still silent on whether waterfall distributions could be treated as salary for resident managers, clouding personal-tax planning. Some LPs respond by embedding tax-gross-up clauses that push liability uncertainty onto GPs, complicating fund documents. The ambiguity drives scenario-based pricing models that shave 50–75 basis points off targeted net IRRs, tempering enthusiasm for fresh commitments. Until definitive circulars land, the India private equity market loses momentum at the margin relative to policy-stable peers.
Scarcity of Late-Stage IPO Windows
Price-to-sales multiples for high-growth tech dropped from 9 times in 2021 to 4 times in 2024, making public exits value-dilutive for many PE-backed firms[3]International Bar Association, “India Capital Markets Year in Review 2024,” ibanet.org. Exchange approval timelines widened to 78 days on average after enhanced risk-factor disclosures, locking up capital earmarked for redeployment. Domestic mutual funds, dominant in IPO book-building, rotate toward cash-flow positive issuers, limiting demand depth for still-scaling platforms. Global depository receipts remain underutilised because overseas listing frameworks await final Reserve Bank notifications. Consequently, fund structure earn-out based trade sales that transfer upside to strategic buyers but cap mark-to-model returns. The choke point elongates portfolio holding periods, nudging internal rate of return curves downward within the India private equity market.
*Our forecasts treat driver/restraint impacts as directional, not additive. The impact forecasts reflect baseline growth, mix effects, and variable interactions.
Segment Analysis
By Fund Type: Buyouts Drive Institutional Allocation
Buyout pools captured a 32.20% slice of 2024 inflows as control deals unlock succession transitions in ageing promoter-led companies. Managers implement board-level talent refreshes, digitize ERP backbones and spin off non-core assets to lift EBITDA margins by 400–600 basis points within 24 months, validating the strategy’s appeal to global pensions seeking operational alpha. Venture cheques continue but tilt toward later-stage Series C or beyond, reflecting a flight to proven unit economics after 2023’s funding reset. Secondaries and fund-of-funds, clocking an 18.32% CAGR, give LPs shorter J-curves and risk diversification; insurers in particular favour them to match asset-liability durations. Distressed and mezzanine funds, while sub-scale, leverage improved Insolvency and Bankruptcy Code recoveries that average 32 cents on the dollar, feeding counter-cyclical performance and rounding out the India private equity industry product stack.
In parallel, regulatory easing allows Category III SIFs to employ long-short overlays on private book valuations, offering hedged exposure absent in conventional vehicles. Co-investment sidecars now accompany most flagship funds, giving LPs fee-efficient access to single-asset deals that exceed fund concentration limits. Family-office spin-offs, often staffed by ex-PE principals, launch micro-buyout vehicles focusing on niche manufacturing clusters, further fragmenting the landscape. These layers collectively broaden participation and cement the India private equity market as a multi-strategy platform capable of absorbing capital across risk spectra.


By Sector: Technology Leadership Amid Energy Transition
The software cluster still leads with 23.45% allocation, fuelled by enterprise SaaS exports where average deal ARR multiples stabilised at 7.2 times in 2024, down from the 11 times peak yet attractive after foreign exchange translation benefits. Health-tech and med-device sub-verticals draw healthcare allocations beyond traditional hospital platforms, diversifying revenue profiles and reducing regulatory exposure. Renewable energy’s 24.11% CAGR rides on 25-year solar and wind power-purchase agreements that deliver quasi-sovereign cash flows, a draw for infrastructure-adjacent funds. Financial-services investments recalibrate toward embedded-finance APIs rather than balance-sheet lenders, lowering credit risk while preserving upside via revenue-sharing models. Industrials benefit from China-plus-one supply-chain shifts as global OEMs co-invest alongside PE sponsors in joint-venture factories, securing order backlogs and anchoring exit stories.
Consumer demand for premium packaged foods fuels minority stakes in heritage brands seeking omnichannel expansion; digital advertising efficiencies make scale-up capital-light, appealing to growth equity. Meanwhile, climate-tech crossovers such as carbon-capture service providers lure specialist funds that tag along with ESG-mandated LP capital. Each vertical’s evolving thesis underscores the sectoral agility of the India private equity market and lowers correlation risk across the broader portfolio mix.
By Investment Size: Large-Cap Dominance Amid SMID Growth
USD 1 billion-plus cheques form 35.6% of the 2024 value as sovereign wealth and pension giants prefer governance comfort and liquidity in mature assets. These mega-deals often include stapled co-investment tranches, enabling sponsors to warehouse minority stakes for follow-on syndication and blend return horizons. Mid-market transactions, USD 100–500 million, gain momentum as tighter credit pushes corporate owners to swap equity for deleveraging, a theme visible in chemicals and auto ancillaries. Small and SMID-cap deals climbing 16.81% CAGR prosper from SME exchange listings that provide credible public exit paths within three to five years, shortening duration risk for funds specialising in this bracket.
Structured equity instruments, including preferred shares with downside floors, help bridge valuation gaps in smaller companies where information asymmetry is higher. Regional banks partner with PE funds to offer clubbed financing, lowering all-in cost for target firms and creating pipeline exclusivity. Digital-intelligence platforms supply granular benchmarking on SMID EBITDA multiples, making underwriting more data-driven and lowering dispersion in exit outcomes. The layers collectively embed scalability into what used to be a fragmented corner of the India private equity market.
Geography Analysis
West India remains the undisputed command centre, yet its 16.75% CAGR hides a qualitative pivot from traditional financial services to digital-infrastructure carve-outs and media-streaming platforms that leverage Mumbai’s talent pool. Mumbai’s Metropolitan Region Development Authority is fast-tracking transit-oriented projects, expanding commercial real-estate options and underpinning valuation resilience even amid higher interest rates. GIFT City complements this hub by offering dollar-denominated listing venues that allow dual-class shares, a structure popular with tech founders wary of domestic voting-right constraints.
South India sustains the most diversified sector mix: Bengaluru anchors cloud-native SaaS; Hyderabad dominates life-sciences contract research; Chennai scales electronics assembly under production-linked incentives. State governments provide power-tariff rebates of up to 12% for renewable-backed industrial parks, directly improving project IRRs. Cross-city fibre networks lower latency for fintech and gaming start-ups, thereby increasing technology multiples and feeding premium exit valuations. Academic-industry consortia in Karnataka funnel proof-of-concept grants that derisk early R&D for PE-backed deep-tech ventures, shortening time to Series B raises.
North India, though still infrastructure-constrained, leverages its political proximity to secure fast-track clearances in defence offsets and public-private-partnership highways, attracting yield-plus-growth infrastructure funds. New dedicated freight-corridor links to western ports cut export lead-times by 20%, reviving manufacturing clusters in Haryana and Rajasthan. Tier-2 cities such as Lucknow witness rising consumer-spend density, making them attractive for roll-up strategies in organised retail and diagnostics chains. East and Northeast allocations inch upward as mining royalties reform creates clearer cash-flow models for specialty-minerals projects. Central India’s lower land costs encourage auto-ancillary suppliers to relocate, helped by state capital-subsidy schemes covering up to 30% of plant setup expenditure. In aggregate, these developments drive a nuanced, multi-pole expansion pattern across the India private equity market’s regional map.
Competitive Landscape
The competitive intensity of the India private equity market has escalated as global mega funds pledge multi-year capital rollouts. Blackstone targets USD 25 billion of new exposure through 2030, with active pipelines in real estate and digital infrastructure. KKR accelerates thematic platforms in healthcare and renewables, committing over USD 1.2 billion during 2024 alone. Temasek’s USD 1 billion consumer-sector infusion signals sovereign enthusiasm for domestic consumption upgrades.
Domestic franchises such as Kedaara Capital and Multiples Alternate Asset Management scale beyond USD 6 billion in assets, leveraging local networks and sector knowledge to compete on equal footing. Cross-border syndicates, for instance, IFC-ADB-DEG’s clean-energy consortium, blend concessional capital with commercial returns, further crowding the deal arena. Technology adoption is the new battleground: AI-driven diligence, predictive exit modeling, and operational dashboards shorten value-creation cycles and differentiate managers. Regulatory uplifts under SEBI’s AIF rulebook elevate compliance costs, nudging consolidation toward well-capitalised firms while still leaving room for specialist emerging managers in niches like climate-tech or GP-led secondaries.
White-space remains in underserved tier-2 geographies, succession-bound SMEs and under-digitised industrial verticals. Managers that couple operational playbooks with sector depth and responsible-investment rigor are best placed to win mandates in the evolving India private equity market.
India Private Equity Industry Leaders
Chrys Capital
Sequoia Capital
Blackstone Group
Advent International
KKR
- *Disclaimer: Major Players sorted in no particular order

Recent Industry Developments
- June 2025: Adani’s Mumbai Airport secured a USD 750 million investment through a stake purchase by a consortium led by Apollo Global. The deal is aimed at strengthening the airport’s infrastructure development and supporting its long-term expansion plans.
- March 2025: Temasek closed its INR 8,500 crore (USD 1 billion) Haldiram Snacks investment at a USD 10 billion valuation.
- February 2025: KKR acquired a controlling interest in Healthcare Global Enterprises (HCG) in a deal valued at USD 400 million. The investment is expected to support HCG’s expansion in oncology and specialty healthcare services across India.
- January 2025: Kedaara Capital deployed USD 350 million into Impetus Technologies to acquire a significant stake in the company. The investment will help accelerate Impetus’s global growth and strengthen its capabilities in data, analytics, and cloud services.


India Private Equity Market Report Scope
| Buyout & Growth |
| Venture Capital |
| Mezzanine & Distressed |
| Secondaries & Fund of Funds |
| Technology (Software) |
| Healthcare |
| Real Estate and Services |
| Financial Services |
| Industrials |
| Consumer & Retail |
| Energy & Power |
| Media & Entertainment |
| Telecom |
| Others (Transportation, etc.) |
| Large Cap |
| Upper Middle Market |
| Lower Middle Market |
| Small & SMID |
| North India |
| West India |
| South India |
| East & Northeast India |
| Central India |
| By Fund Type | Buyout & Growth |
| Venture Capital | |
| Mezzanine & Distressed | |
| Secondaries & Fund of Funds | |
| By Sector | Technology (Software) |
| Healthcare | |
| Real Estate and Services | |
| Financial Services | |
| Industrials | |
| Consumer & Retail | |
| Energy & Power | |
| Media & Entertainment | |
| Telecom | |
| Others (Transportation, etc.) | |
| By Investments | Large Cap |
| Upper Middle Market | |
| Lower Middle Market | |
| Small & SMID | |
| By Region | North India |
| West India | |
| South India | |
| East & Northeast India | |
| Central India |


Key Questions Answered in the Report
What is the current India Private Equity Market size in 2025?
The market stands at USD 84.5 billion with an 18.22% forecast CAGR to 2030.
Which fund strategy is growing fastest in India Private Equity Market size?
Secondary and fund-of-fund vehicles are projected to grow at 18.32% annually to 2030.
Why is West India pivotal for private-equity development?
Mumbai’s capital-market infrastructure, regulatory proximity and deep advisory talent give West India 34.56% market share and a 16.75% growth outlook.
How does the Specialized Investment Fund Framework benefit investors?
SIFs allow high-net-worth and institutional investors to access private-market strategies via SEBI-regulated rupee vehicles that lower currency-hedging and tax frictions.
Page last updated on:


