
Virtual Tourism Market Size and Share
Market Overview
| Study Period | 2022 - 2032 |
|---|---|
| Market Size (2027) | USD 15.46 Billion |
| Market Size (2032) | USD 31.67 Billion |
| Growth Rate (2027 - 2032) | 15.42 % |
| Fastest Growing Market | Asia-Pacific |
| Largest Market | North America |
| Market Concentration | Medium |
Major Players *Disclaimer: Major Players sorted in no particular order Image © Mordor Intelligence. Reuse requires attribution under CC BY 4.0. | |
Virtual Tourism Market Analysis by Mordor Intelligence
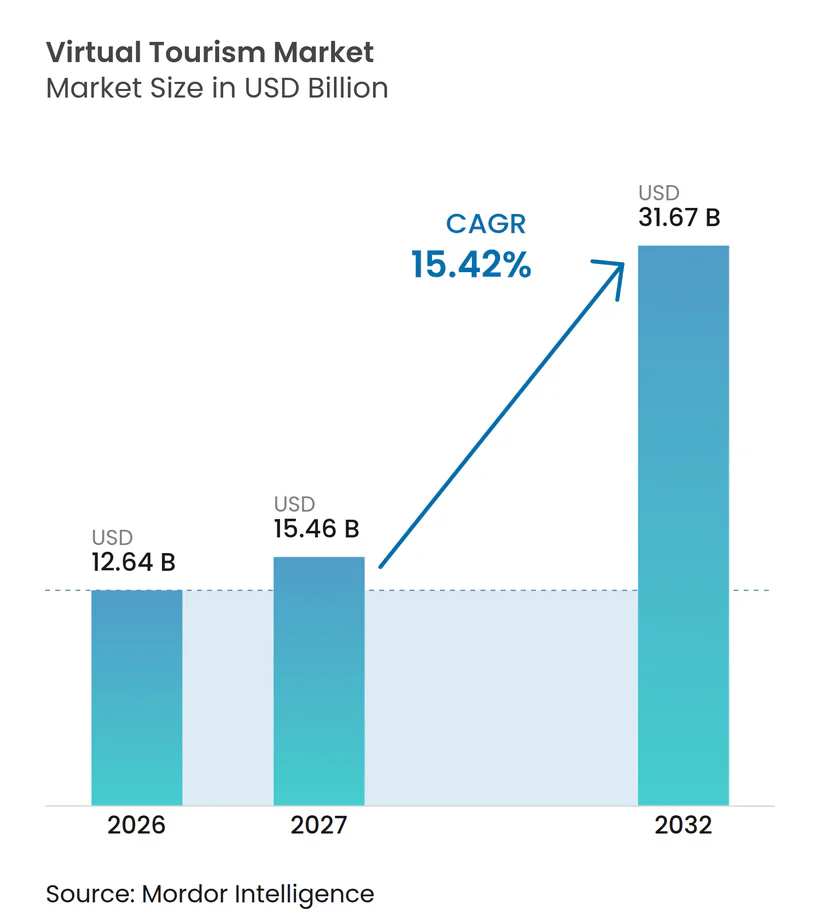
The Global Virtual Tourism Market size was valued at USD 12.64 billion in 2026 and is estimated to grow from USD 15.46 billion in 2027 to reach USD 31.67 billion by 2032, at a CAGR of 15.42% during the forecast period (2027-2032). Spatial computing, cloud-hosted 360-degree content, and AI-enabled personalization are increasingly supporting travel discovery and property marketing. Destination marketing organizations, hotel operators, and real estate developers use immersive content to improve pre-purchase engagement. An Amadeus Hospitality survey found that 70% of travelers were likely or very likely to use virtual reality or virtual tours before visiting a destination[1]. In India, mobile commerce and digital payments support web-based experiences. Wider adoption will depend on content quality, affordable access, and clear booking pathways. The Global Virtual Tourism Market is developing as a practical component of travel discovery rather than a replacement for physical travel.
Key Report Takeaways
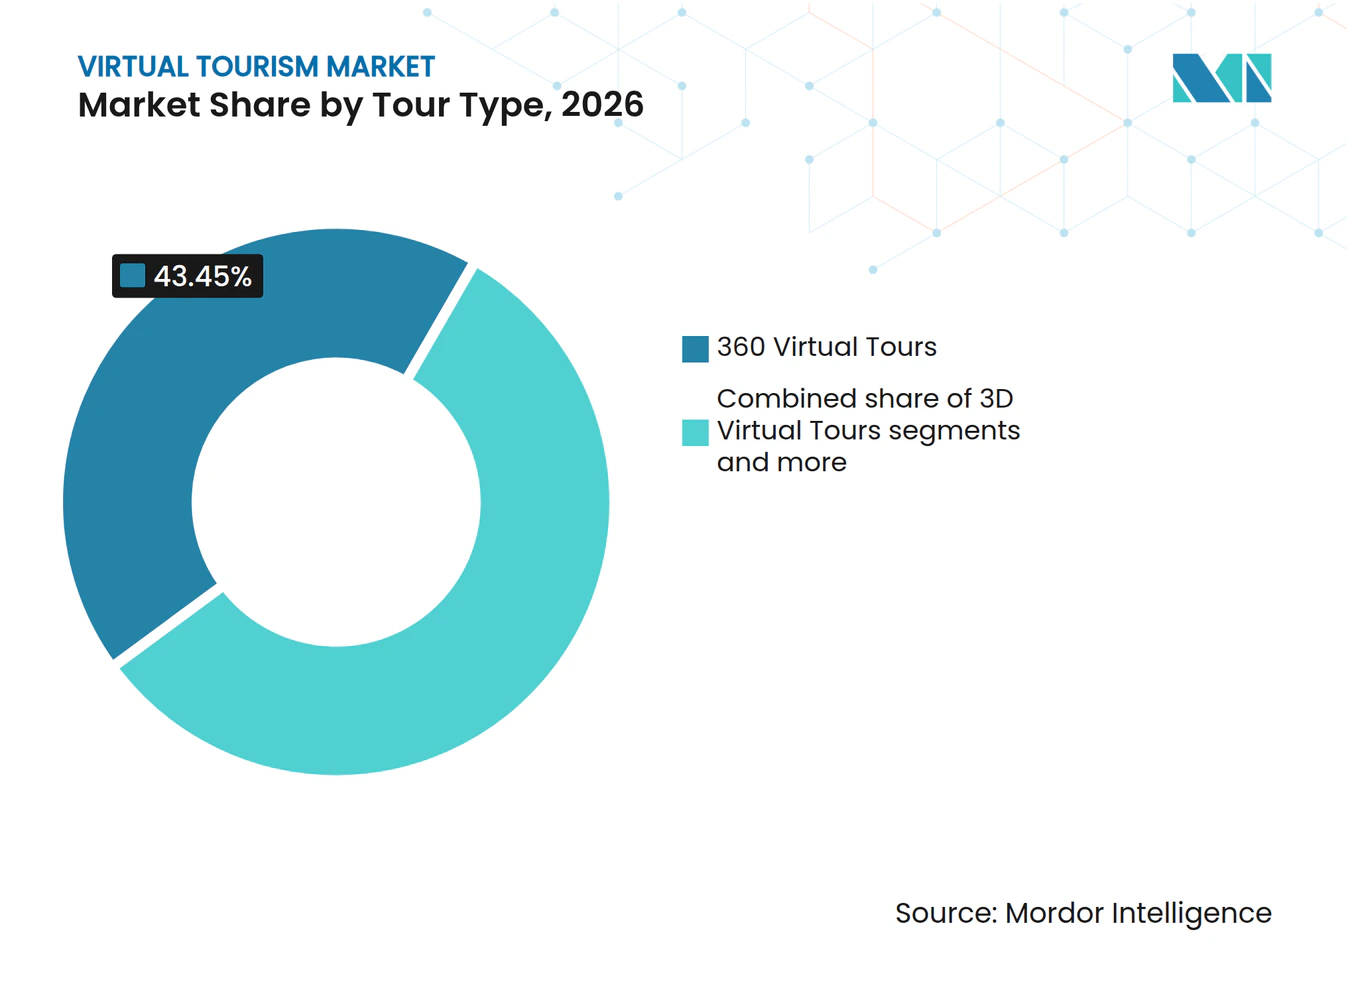
- By tour type, 360 virtual tours accounted for 43.45% of the global virtual tourism market share in 2026, and VR tours are projected to grow at a 16.34% CAGR through 2032.
- By delivery platform, web and browser-based solutions accounted for 47.41% of the global virtual tourism market share in 2026, and dedicated VR applications are projected to grow at a 16.45% CAGR through 2032.
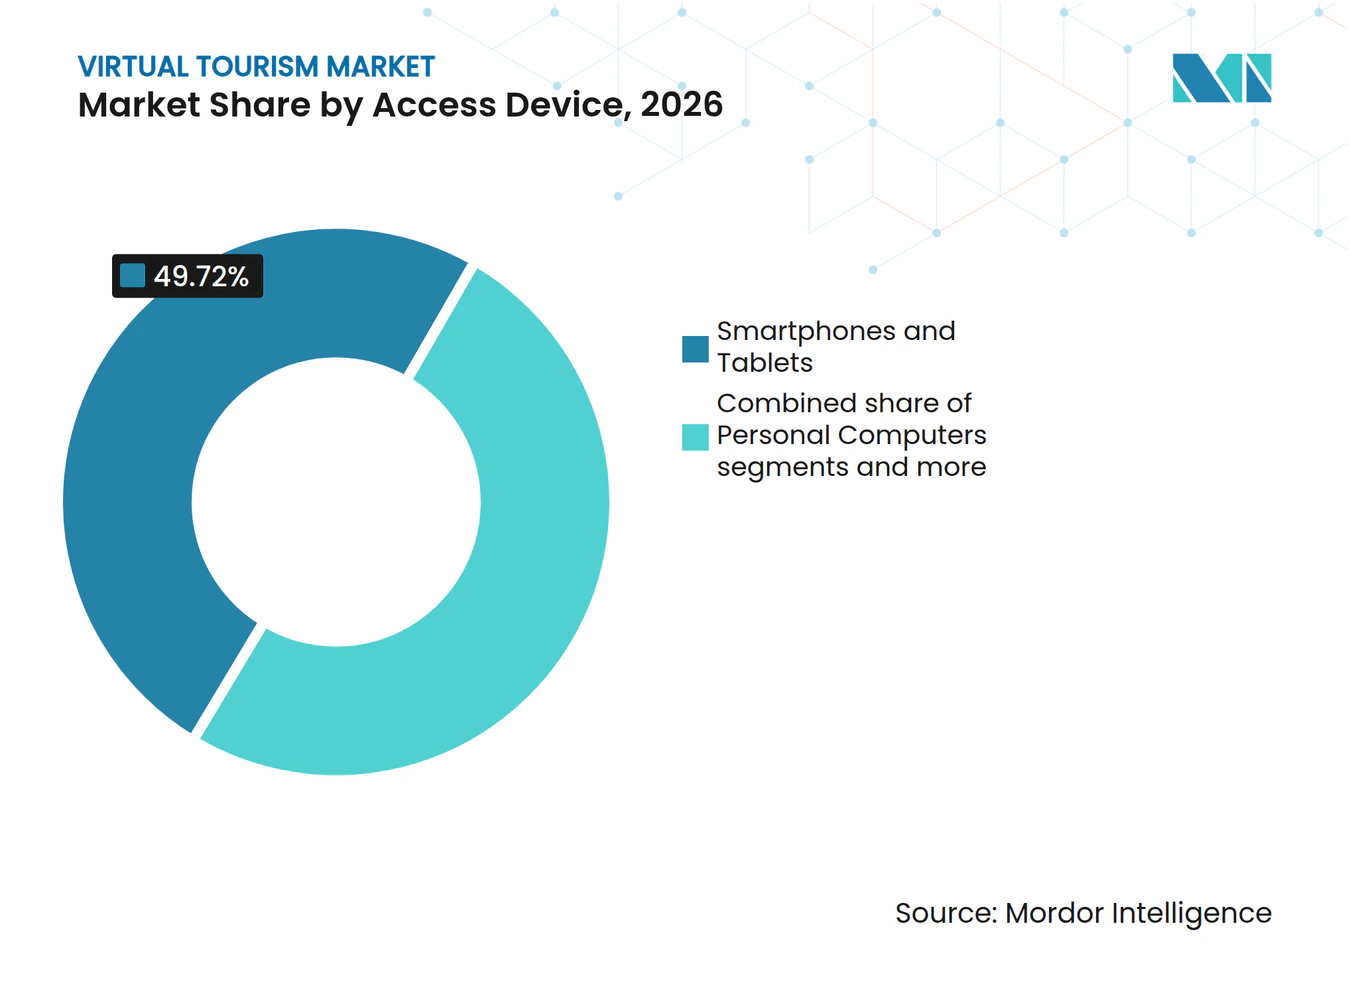
- By access device, smartphones and tablets accounted for 49.72% of the global virtual tourism market share in 2026, and head-mounted displays are projected to grow at a 16.93% CAGR through 2032.
- By application, tourism and destination experiences accounted for 52.53% of the global virtual tourism market share in 2026, and real estate and hospitality properties are projected to grow at a 17.24% CAGR through 2032.
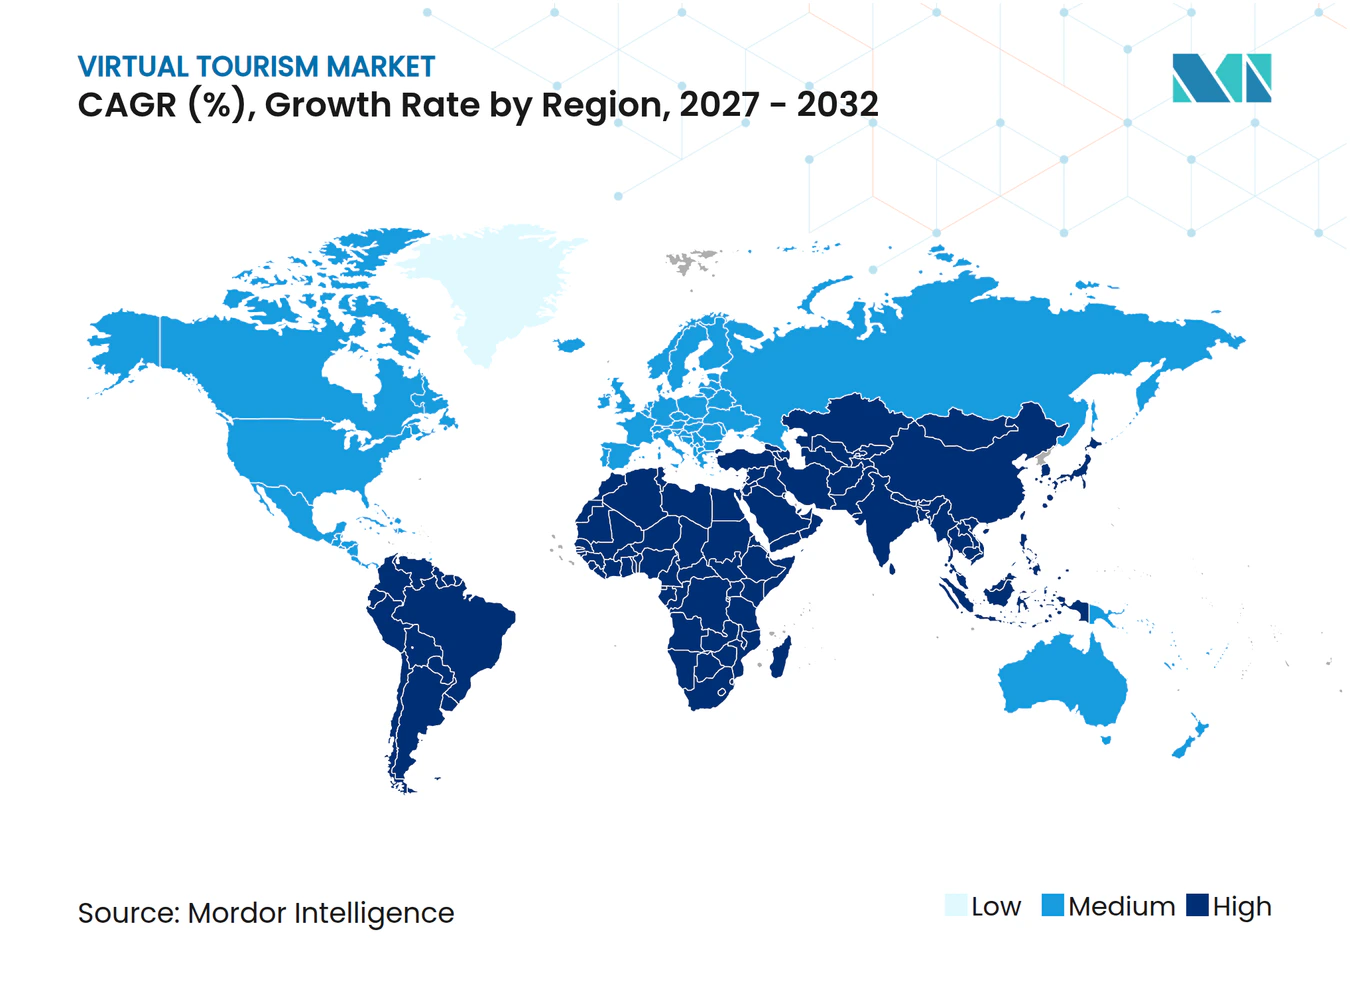
- By geography, North America accounted for 35.64% of the global virtual tourism market share in 2026, and Asia-Pacific is projected to grow at a 17.13% CAGR through 2032.
Note: Market numbers in this report are based on Mordor Intelligence's proprietary estimation framework, which combines nine months of actuals with Q4 projections for base year 2026.
Market Trends and Insights
Drivers Impact Analysis of Virtual Tourism Market*
| Driver | (~) % Impact on CAGR Forecast | Geographic Relevance | Impact Timeline |
|---|---|---|---|
| Demand for Immersive Destination Previews | +3.2% | Global | Short term (≤ 2 years) |
| Advances in 360-Degree Capture, 3D Scanning, and VR Delivery | +2.8% | Global | Medium term (2-4 years) |
| Expansion of Digital Destination Marketing and Virtual Events | +2.1% | North America and Europe | Medium term (2-4 years) |
| Access to Inaccessible, Fragile, or Capacity-Constrained Destinations | +1.5% | Europe, Asia-Pacific, and Middle East and Africa | Long term (≥ 4 years) |
| AI-Personalized and Multilingual Virtual Itineraries | +2.3% | Asia-Pacific with global spillover | Medium term (2-4 years) |
| Virtual Access as a Crowd-Management and Heritage-Preservation Tool | +1.2% | Europe, Middle East, and Asia-Pacific | Long term (≥ 4 years) |
| Source: Mordor Intelligence | |||
Demand for Immersive Destination Previews
Travel planning is shifting toward digital validation before travelers commit to a trip. Amadeus Hospitality reported that 70% of travelers were likely or very likely to use virtual reality or virtual tours to explore a destination before visiting. Research involving 602 online museum users found that information and service quality influenced perceived usefulness and travel intention[2]. The ITU reported that 6 billion people used the internet in 2025, after more than 240 million people came online that year. These factors increase the relevance of the Global Virtual Tourism Market for destination operators seeking accessible digital discovery tools. For Indian destination managers, browser-based previews can reduce information gaps before physical visits without specialized devices.
Advances in 360-Degree Capture, 3D Scanning, and VR Delivery
New capture tools are reducing the effort required to create immersive destination content. In its 2025.1 release, 3DVista introduced support for Gaussian splatting and the SPZ format. Nokia introduced viewport-dependent delivery through its 5G 360 Camera and RXRM system, reducing bandwidth requirements while maintaining 360-degree viewing. A Multimedia Systems study demonstrated multiuser cultural experiences using 5G, AI, and free-viewpoint video with latency below 100 milliseconds. These advances expand the ability of organizations with limited technical teams to create and distribute richer experiences, benefiting the Global Virtual Tourism Market.
Expansion of Digital Destination Marketing and Virtual Events
Virtual content is integrated into booking, venue sourcing, and corporate travel workflows. In June 2025, Cvent launched its 3D Walkthrough feature, integrating Matterport scans into its Supplier Network. Matterport reported that Lindner Hotels increased website clicks by 25% after adding its tours to Google My Business listings. This integration places immersive media closer to where corporate planners and leisure travelers compare options. It enables operators to showcase room layouts, venue capacity, and property features before in-person visits. The Global Virtual Tourism Market gains commercial relevance when tours connect with sourcing and booking processes rather than operate as standalone media assets.
Access to Inaccessible, Fragile, or Capacity-Constrained Destinations
Virtual access expands public engagement with heritage locations that are difficult to visit in person. UNESCO launched Dive into Heritage in 2025, offering 3D models, immersive storytelling, and virtual experiences for World Heritage sites in the Arab States. It also launched the Virtual Museum of Stolen Cultural Objects during MONDIACULT 2025. These initiatives demonstrate how digital formats improve access when objects are dispersed, sensitive, or subject to physical restrictions. They also support sites facing visitor-capacity constraints or preservation concerns. This model is relevant to India’s heritage locations, where visitor management and interpretation must operate together.
Restraints Impact Analysis of Virtual Tourism Market*
| Restraint | (~) % Impact on CAGR Forecast | Geographic Relevance | Impact Timeline |
|---|---|---|---|
| Limited Consumer Ownership of Immersive Hardware | -1.8% | Global, with greater pressure in emerging markets | Medium term (2-4 years) |
| High Content Production and Experience-Maintenance Costs | -1.4% | Global, with greater pressure on small and medium-sized enterprises | Medium term (2-4 years) |
| Low Perceived Substitution for Tangible Travel Experiences | -1.2% | Global | Long term (≥ 4 years) |
| Fragmented Interoperability, Rights, and Destination Data Standards | -0.8% | Global | Long term (≥ 4 years) |
| Source: Mordor Intelligence | |||
Limited Consumer Ownership of Immersive Hardware
Limited ownership of immersive hardware restricts virtual tourism adoption, particularly in price-sensitive and emerging markets. VR headsets add costs beyond smartphones or computers, limiting access to fully immersive tours. While 360-degree videos and browser-based experiences are more accessible, they offer less immersion and interactivity than dedicated VR systems. According to the International Telecommunication Union (ITU), 96% of the global population that remains offline lives in low- and middle-income countries, highlighting digital access disparities. Reliance on headset-based delivery may narrow the global virtual tourism market's addressable audience and slow adoption. Providers must develop smartphone-compatible platforms and lightweight virtual experiences to reduce hardware barriers and expand accessibility across consumer segments.
High Content Production and Experience-Maintenance Costs
High production and maintenance costs may constrain the global virtual tourism market, particularly for smaller tourism operators and destination organizations. Developing immersive experiences costs approximately USD 50,000 to USD 500,000, depending on complexity, while annual maintenance can account for 10-15% of initial development costs[3]. Additional expenses include 360-degree capture, 3D modeling, cloud hosting, software updates, and content localization. Although Gaussian splatting improves 3D reconstruction efficiency, quality control and periodic updates remain necessary. These recurring investments may limit destination coverage and discourage smaller operators from adopting immersive formats. Scalable production workflows and shared content platforms can improve cost efficiency and broaden market participation.
*Our forecasts treat driver/restraint impacts as directional, not additive. The impact forecasts reflect baseline growth, mix effects, and variable interactions.
Consumer Behavior Analysis
Consumer engagement with virtual tourism is influenced by convenience, enjoyment, accessibility, and destination evaluation before travel. A 2025 study of 602 online museum users found that usefulness, ease of use, and enjoyment positively influenced travel intention. Research on wheelchair users at constrained heritage sites, including Cancho Roano in Spain, also showed its role in inclusive cultural exploration. Accessible interfaces, accurate information, and realistic previews can support adoption.
Platform preferences depend on internet access, device availability, and content performance. The International Telecommunication Union reported that 6 billion people, or 74% of the global population, used the internet in 2025, while 2.2 billion remained offline. Its Global Connectivity Report 2025 reported 14 GB of median monthly mobile-broadband traffic per subscription in 2024. Mobile-friendly, compressed, browser-based tours and integrated booking and payment systems can reduce data barriers and connect discovery with purchase decisions.
Virtual Tourism Performance Intelligence
Virtual tours can help travelers evaluate accommodations, venues, and destinations. Matterport reported that Kapow listings with 3D tours generated 4.5 times more time on site and twice as many page views as comparable static-media listings. Lindner Hotels reported a 25% increase in website clicks after integrating virtual tours with Google Business Profile. These deployment-specific results indicate that immersive content can support discovery and consideration.
Matterport reported that Vacasa deployed 3D tours across nearly 90% of its more than 38,000 vacation homes and recorded a 12% increase in booking conversion. Monthly impressions increased from 39 million to more than 41 million. In India, mobile-friendly booking, transparent pricing, availability checks, and digital payments could help convert interest into reservations.
Virtual Tourism Market Segment Analysis
By Tour Type:
360 Formats Anchor the Market, VR Content Sets the Premium Ceiling360 virtual tours hold 43.45% of the global virtual tourism market share in 2026. Their lead reflects broad device compatibility and access through a standard browser. Users do not need downloads, registrations, or dedicated hardware to view basic 360-degree content. A review of 360 tours described growing use across education, culture, and tourism. This makes the format a practical entry point for destinations that want wide reach.
3D virtual tours provide spatial depth, interactive floor plans, and dimensional context for property-led decisions. VR tours are smaller today, but their global virtual tourism market size is projected to expand at a 16.34% CAGR through 2032. The higher-growth format can support a stronger presence when users have compatible devices. Research on virtual and augmented reality in tourism has linked presence with behavioral intention. The formats serve different needs instead of acting as direct substitutes. 360-degree tours support awareness, 3D walkthroughs support consideration, and VR can serve users seeking deeper immersion.



By Delivery Platform:
Web Delivery Sustains Volume, VR Applications Drive Premium GrowthWeb and browser-based solutions accounted for 47.41% of the global virtual tourism market share in 2026. They offer easy access through smartphones, tablets, and computers, supporting property listings, destination discovery pages, and hotel booking funnels. Mobile applications provide itinerary updates, richer interactivity, and offline access for destinations requiring repeated engagement during a trip. The global virtual tourism market reaches a broad audience where users can access content without downloading a separate application.
Dedicated VR applications are forecast to grow at a CAGR of 16.45% from 2027 to 2032. 3DVista’s 2026.0 update added native VR environment functions for complex headset-based tours. Although VR provides a more immersive experience, its addressable audience depends on device availability. Platforms can use web-based delivery for discovery and direct high-intent users to richer formats when appropriate.
By Access Device:
Smartphones Serve Volume, HMDs Define the Immersive FrontierSmartphones and tablets accounted for 49.72% of the global virtual tourism market share in 2026, reflecting the large installed base of mobile devices and the ease of browser-based access. Mobile screens support lightweight 360-degree content, destination pages, and location-based discovery. Personal computers remain important for reviewing floor plans, managing property content, and comparing detailed accommodation or venue options.
Head-mounted displays are projected to grow at a CAGR of 16.93% through 2032. They offer stronger immersion but have a smaller user base than smartphones and tablets. High-fidelity experiences support cultural exhibitions, hospitality presentations, and specialized education. Growth in this device category depends on improved hardware accessibility and usability. Until then, operators need device-flexible content that works on standard screens.

By Application:
Destination Tourism Leads, Real Estate AcceleratesTourism and destination experiences accounted for 52.53% of the global virtual tourism market share in 2026. UN Tourism recorded 690 million international tourist arrivals in the first half of 2025, up 5% from the same period in 2024[4]. Physical travel supports demand for destination content. Smart destination programs use virtual experiences to improve discovery and guide visitor flows while communicating appeal, accessibility, and practical information.
Real estate and hospitality properties are the fastest-growing applications, with a 17.24% CAGR projected through 2032. Matterport reported that Lindner Hotels increased website clicks by 25% through Google My Business integration. Museums and galleries are expanding digital access through UNESCO cultural heritage initiatives. These applications require credible spatial representation, although hospitality operators prioritize conversion and cultural institutions focus on access, interpretation, and preservation.
Geography Analysis
North America holds 35.64% of the global virtual tourism market share in 2026. The region includes platform operators such as Matterport, CloudPano, Real Tour Vision, and Kuula. On February 28, 2025, CoStar completed its USD 1.6 billion acquisition of Matterport, combining Matterport's spatial library with CoStar's property marketplace infrastructure. The United States shows adoption across property, hospitality, and heritage applications, influencing technical and business models in other regions.
Asia-Pacific is projected to grow at a CAGR of 17.13% through 2032. During the first half of 2025, international arrivals in the region increased by 11%, while North-East Asia recorded 20% growth, according to UN Tourism. China has a smartphone-based travel ecosystem, Japan supports digital-twin tourism initiatives, and India has expanding mobile commerce and digital payment adoption. South Korea and Singapore were identified as smart destination frontrunners at the UN Tourism and PATA Forum.
Europe combines heritage content with data governance requirements. The Heritage Links project uses digital innovation to address overtourism at World Heritage sites in Greece and Italy. GDPR affects analytics, profiling, and cross-border data flows. The Middle East and Africa receive institutional investment, including Saudi Arabia's support for Dive into Heritage. South America is developing through adventure and heritage destination marketing. Regional content, digital readiness, and tourism priorities shape the global virtual tourism market.
Virtual Tourism Supply & Development Intelligence
Virtual tourism content supply is expanding, although geographic representation remains uneven. UNESCO’s Dive into Heritage initiative has a USD 2.5 million budget, allocating 40% to Africa and 60% to Arab States to support digital access to cultural and natural heritage. This funding supports heritage digitization and locally representative virtual experiences, but coverage gaps and maintenance needs may limit reliable tours in emerging destinations.
Platforms increasingly prioritize immersive interactivity, rendering, and production efficiency. In 2026, 3DVista introduced Total VR Mode with interface support and e-learning functions. Kuula’s December 2025 update added workflow improvements and support for images up to 32K resolution for Pro users. These capabilities improve virtual tours and destination previews but increase processing and storage needs. Scalable production and browser-compatible delivery remain essential for balancing quality, affordability, and accessibility.
Competitive Landscape
Market Concentration
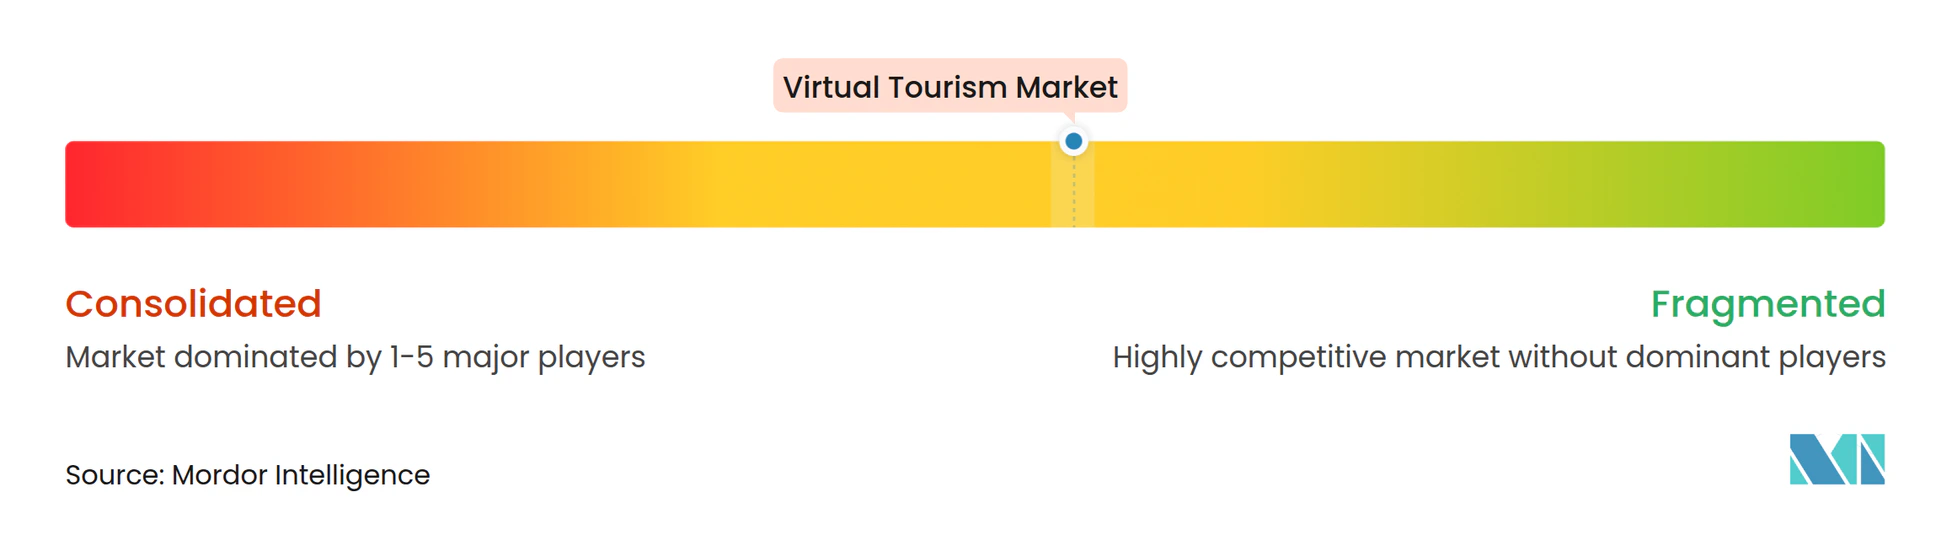
The global virtual tourism market is moderately concentrated. Leading platforms hold meaningful influence, while specialized studios and destination-focused providers remain active. Matterport, part of CoStar Group, provides spatial data and property-focused digital twins. 3DVista offers advanced authoring and offline production capabilities. Kuula, CloudPano, and Real Tour Vision provide platform-based tools with accessible publishing models. Competition centers on production depth, publishing ease, data capabilities, and integration with business workflows.
Cvent launched its 3D Walkthrough feature in June 2025, integrating Matterport scans into event venue sourcing. In 2026, 3DVista introduced Total VR Mode, expanding its native VR capabilities. Kuula updated its interface and backend in December 2025 to improve reliability and support further development. These initiatives reflect continued investment in distribution, production tools, and interactive capabilities.
Cultural and entertainment projects compete through production quality and institutional partnerships. UNESCO’s projects demonstrate a public-sector pathway for immersive heritage content. AirPano expanded to Apple Vision Pro in June 2026, targeting spatial computing users. Spatial data portability across capture hardware, authoring tools, and viewing devices remains a key competitive gap. Providers that reduce this friction can simplify adoption for destination owners. In India, suppliers combining mobile accessibility, local content production, and booking integration align with the needs of travel and hospitality users.
Virtual Tourism Industry Leaders
-
Matterport, Inc. (CoStar Group)
-
3DVista
-
Kuula LLC
-
Real Tour Vision (RTV)
-
CloudPano
- *Disclaimer: Major Players sorted in no particular order
Virtual Tourism Market Companies Covered in this Report
- Matterport, Inc. (CoStar Group)
- Kuula LLC
- Real Tour Vision (RTV)
- 360Cities
- TourVista
- Panedia
- CloudPano
- 3DVista
- Open2view
- Xplorit Limited
- First Airlines Co., Ltd.
- Ascape VR, Inc.
- VR Gorilla
- AirPano
- Blue Raven Studios
- Eye Revolution Ltd.
- Treeview
- Magnopus
- Iconem
- Prime VR Tour
Recent Industry Developments in Virtual Tourism Market
- June 2026: AirPano launched a native Apple Vision Pro application, extending its library of aerial 360-degree panoramas covering global landmarks, mountain ranges, and natural wonders to Apple's spatial computing platform.
- March 2026: Garden Gnome Software released Pano2VR 8, introducing 3D model and Gaussian splat support, smoother panorama transitions, and improved mobile delivery for interactive virtual tour development.
- June 2025: Cvent launched a 3D Walkthrough feature on its Supplier Network, integrating Matterport scans with photorealistic 3D technology for hotels and event venues.
- May 2025: 3DVista released version 2025.1 with Gaussian splatting, SPZ format support, spherical harmonics compression, and cloud synchronization with offline mode.
Global Virtual Tourism Market Report Scope
The Global Virtual Tourism Market report analyzes virtual travel experiences delivered through immersive and digital platforms worldwide. The market is segmented by tour type (360 Virtual Tours, 3D Virtual Tours, and VR Tours), delivery platform, access device, application, and geography. The study examines key drivers, including demand for immersive destination previews, advances in virtual tour technology, digital destination marketing, and access to inaccessible or capacity-constrained destinations, alongside restraints such as limited headset ownership, high content production costs, and low perceived substitution for physical travel. It evaluates content availability, platform adoption, user engagement, consumer preferences, spending behavior, and virtual-to-physical travel conversion. The report provides market size and growth forecasts, competitive landscape analysis, market share assessment, strategic developments, and profiles of leading providers. It also explores opportunities in AI-personalized itineraries, multilingual virtual experiences, and heritage preservation. Market estimates and forecasts are presented in value (USD) across all covered segments.
Segmentation Overview
Key Questions Answered in the Report
What is the projected value of the Global Virtual Tourism Market by 2032?
The Global Virtual Tourism Market is projected to reach USD 31.67 billion by 2032, growing at a 15.42% CAGR from 2027.
Which virtual tour format has the largest revenue share?
360 virtual tours lead with a 43.45% revenue share in 2026 because they work through standard browsers and common devices.
Which delivery format is expanding fastest?
Dedicated VR applications are projected to grow at a 16.45% CAGR through 2032, although web delivery remains the largest format.
Why are virtual tours relevant to Indian travel operators?
India's growth in mobile commerce and digital payments supports mobile-first discovery and booking journeys, making browser-compatible tours especially relevant.
Which use case is growing fastest?
Real estate and hospitality properties are projected to grow at a 17.24% CAGR through 2032, supported by tour-based conversion and engagement use cases.