
Sports Tourism Market Size and Share
Market Overview
| Study Period | 2021 - 2031 |
|---|---|
| Market Size (2026) | USD 712.61 Billion |
| Market Size (2031) | USD 957.91 Billion |
| Growth Rate (2026 - 2031) | 6.09 % |
| Fastest Growing Market | Asia-Pacific |
| Largest Market | Europe |
| Market Concentration | Low |
Major Players *Disclaimer: Major Players sorted in no particular order Image © Mordor Intelligence. Reuse requires attribution under CC BY 4.0. | |
Sports Tourism Market Analysis by Mordor Intelligence
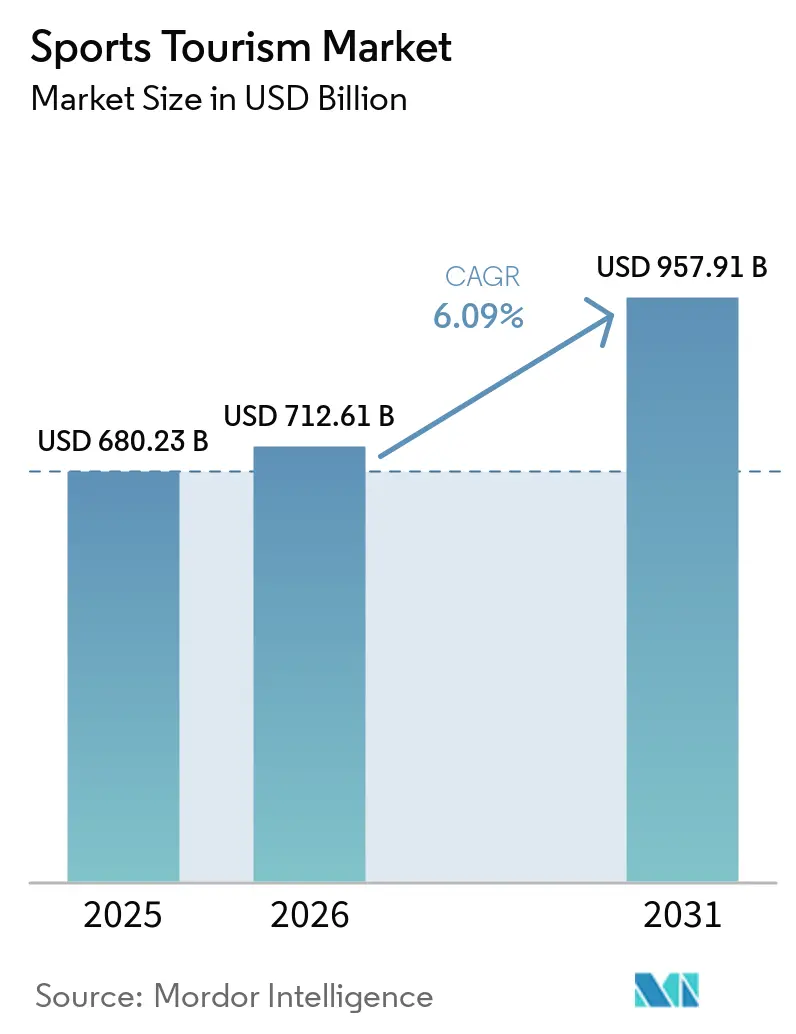
The Global Sports Tourism Market was valued at USD 680.23 billion in 2025 and is estimated to grow from USD 721.60 billion in 2026 to reach USD 957.91 billion by 2031, at a CAGR of 6.09% during the forecast period (2026–2031). Growth is driven by travelers increasingly planning trips around live matches, races, and tournaments rather than treating sports as a secondary activity. Expanding event calendars, enhanced trip-planning tools, and diverse travel formats are driving market growth[1]. Regional growth is becoming more balanced, with Europe maintaining scale due to its dense event infrastructure, while Asia-Pacific is growing rapidly through public investments, cricket demand, and policy-driven sports travel programs. Although domestic travel dominates, international travelers with higher spending capacity are gaining importance as global event access improves and destinations develop year-round sports offerings. Competition remains fragmented, but actions by major rights holders like TKO Group Holdings and Liberty Media are reshaping the market. These companies aim to retain more hospitality and fan travel revenue within their commercial systems, influencing the organization of the Global Sports Tourism Market.
Key Report Takeaways
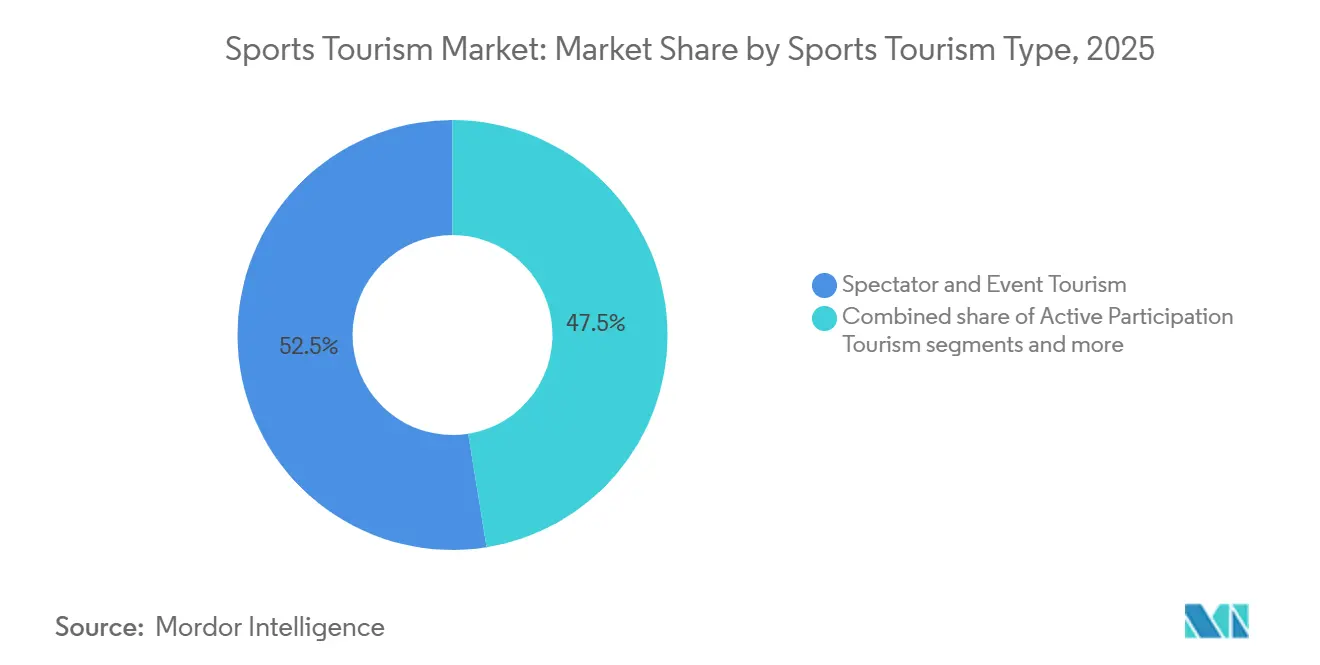
- By sports tourism type, Spectator and Event Tourism commanded a 52.52% share of the Global Sports Tourism Market in 2025, while Active Participation Tourism is projected to grow at the highest CAGR of 7.12% through 2031.
- By sports category, Football Tourism commanded a 19.73% share of the Global Sports Tourism Market in 2025, while Marathon and Endurance Sports Tourism are projected to grow at the highest CAGR of 7.94% through 2031.
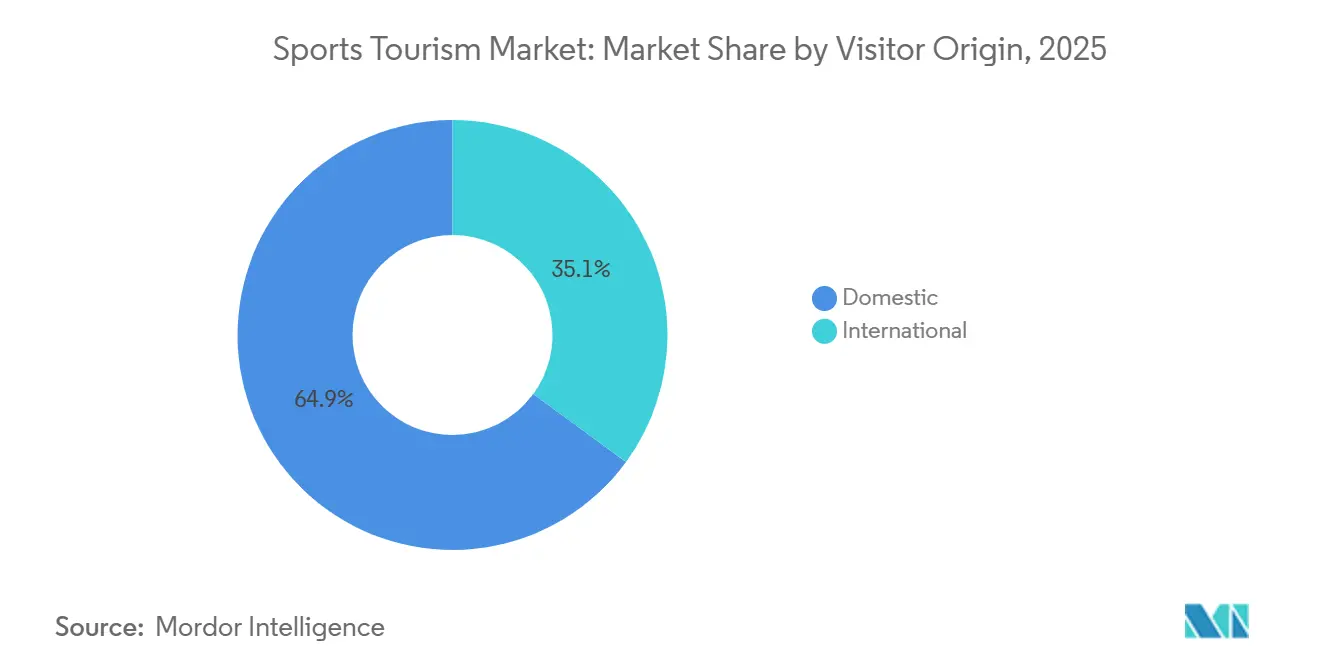
- By visitor origin, Domestic Visitors commanded a 64.94% share of the Global Sports Tourism Market in 2025, while International Visitors are projected to grow at the highest CAGR of 6.98% through 2031.
- By booking channel, Direct Booking Channels commanded a 35.61% share of the Global Sports Tourism Market in 2025, while Official Event and Rights-holder Packages are projected to grow at the highest CAGR of 7.74% through 2031.
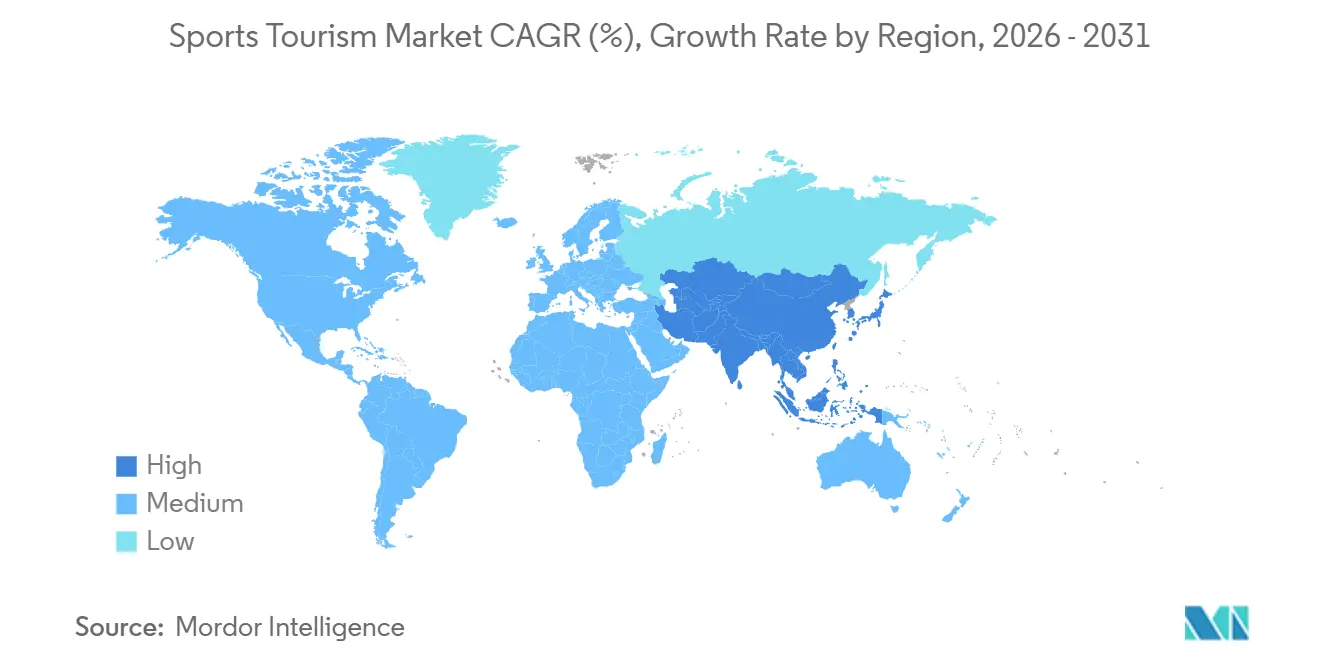
- By geography, Europe commanded a 33.75% share of the Global Sports Tourism Market in 2025, while Asia-Pacific is projected to grow at the highest CAGR of 8.15% through 2031.
Note: Market size and forecast figures in this report are generated using Mordor Intelligence’s proprietary estimation framework, updated with the latest available data and insights as of January 2026.
Market Trends and Insights
Drivers Impact Analysis of Sports Tourism Market*
| Driver | (~) % Impact on CAGR Forecast | Geographic Relevance | Impact Timeline |
|---|---|---|---|
| Rising Number of International Sporting Events and Mega Tournaments | +2.0% | Global, concentrated in North America, Europe, and the Middle East | Short term (≤ 2 years) |
| Expansion of Premium Fan Travel, Hospitality, and VIP Experience Packages | +1.3% | Global, led by North America and Europe, is rapidly accelerating in the Middle East | Medium term (2-4 years) |
| Growth in AI-Enabled Trip Planning, Ticketing, and Personalized Itineraries | +0.6% | Asia-Pacific, North America, Europe | Medium term (2-4 years) |
| Rising Demand for Nostalgia and Heritage-Based Sports Travel | +0.4% | Europe, North America | Long term (≥ 4 years) |
| Public-Private Investment in Multi-Use Sports Infrastructure | +0.7% | Middle East, Asia-Pacific, North America, South America | Long term (≥ 4 years) |
| Growth of Women’s Sports and Youth Tournament Travel Circuits | +0.5% | North America, Europe, Asia-Pacific | Medium term (2-4 years) |
| Source: Mordor Intelligence | |||
Rising Number of International Sporting Events and Mega Tournaments
The Global Sports Tourism Market is growing due to a steady pipeline of international events that maintain travel demand over several years rather than focusing solely on peak tournaments. Sports ETA reported that the United States is preparing for events such as the FIFA World Cup 2026, the LA28 Olympic and Paralympic Games, and future rugby and winter sports events, following significant sports travel activity in 2025. Japan is also leveraging the 2026 Asian Games in Aichi-Nagoya and the 2027 World Masters Games Kansai to enhance inbound sports travel and regional tourism strategies[2]. The UN World Tourism Organization highlights sports tourism as a rapidly expanding activity, linking major event hosting with increased destination visibility, economic benefits, and sustained visitor engagement. This concentration of events supports sustained bookings across host cities and nearby regions, as well as repeat visits by fans, often involving multiple matches or venues.
Expansion of Premium Fan Travel, Hospitality, and VIP Experience Packages
Access to official travel and hospitality inventory is becoming a significant focus in the Global Sports Tourism Market. TKO Group Holdings acquired IMG, On Location, and Professional Bull Riders, with On Location delivering hospitality and live experiences for over 1,200 sporting events and collaborating with more than 150 rights holders, including FIFA, the IOC, the NFL, UFC, WWE, and PGA of America. Liberty Media acquired Quint, a business offering official ticket and hospitality packages for over 90 events and maintaining more than 15 official property partnerships. Quint was later appointed as the Official Hospitality Sales Partner for the Formula 1 Heineken Silver Las Vegas Grand Prix, reflecting a closer alignment between official package channels, event owners, and fan experiences[3]. This approach supports growth in the Global Sports Tourism Market by integrating access, travel, and experience design into a unified offering.
Growth in AI-Enabled Trip Planning, Ticketing, and Personalized Itineraries
Digital planning tools are simplifying the Global Sports Tourism Market by helping travelers coordinate tickets, accommodations, transportation, and event schedules. Researchers at MIT developed a travel planning framework that combines large language models with constraint-satisfaction methods to create personalized itineraries across destinations while addressing practical travel constraints. The UN Tourism organization has highlighted the role of AI, digital platforms, and connected technologies in enhancing fan engagement, personalizing content, and streamlining travel operations. These tools are particularly important in sports tourism, where offerings are more complex than standard leisure travel, involving event schedules, venue access, and local experiences. Increased adoption of these technologies enables the market to convert more high-intent fans into customers and supports smaller events that previously lacked efficient digital solutions.
Rising Demand for Nostalgia and Heritage-Based Sports Travel
Heritage and nostalgia are driving a steady, non-match-day revenue stream in the Global Sports Tourism Market. Sports heritage tourism, including stadium tours and sports museums, is recognized as a key part of passive sports tourism that attracts visitors independently. Liverpool FC’s Walk on the Pitch Tour, Champions Edition, offered curated experiences such as pitch access, a professional photo with the Premier League trophy, museum entry, and other club-related activities. These offerings maintain visitor interest between fixtures and encourage spending beyond ticketed events. This approach allows iconic venues to monetize fan loyalty year-round, appealing to visitors seeking emotional connections alongside competitive events.
Restraints Impact Analysis of Sports Tourism Market*
| Restraint | (~) % Impact on CAGR Forecast | Geographic Relevance | Impact Timeline |
|---|---|---|---|
| Event Cancellation Risk from Geopolitical Tensions and Security Concerns | -0.6% | Global, most acute in the Middle East, South Asia, and urban Europe | Short term (≤ 2 years) |
| High Cost of Long-Haul Travel, Hospitality, and Event Access Bundles | -0.5% | Global, disproportionate in emerging and mid-income markets | Medium term (2-4 years) |
| Venue Capacity Constraints and Limited Peak-Season Inventory | -0.3% | Europe, North America | Medium term (2-4 years) |
| Dependency on Seasonal Event Calendars and Weather-Sensitive Destinations | -0.3% | Europe, Asia-Pacific, Oceania | Long term (≥ 4 years) |
| Source: Mordor Intelligence | |||
Event Cancellation Risk from Geopolitical Tensions and Security Concerns
Geopolitical disruptions are a significant risk for the Global Sports Tourism Market due to its reliance on fixed dates, large gatherings, and prepaid travel arrangements. The World Economic Forum highlighted that geopolitical events, pandemics, and regulatory changes could lead to substantial losses in global tourism revenue by 2030. When high-profile events are rescheduled, postponed, or canceled, the financial impact extends beyond ticket sales, affecting flights, accommodations, local transportation, and food expenditures. The market is particularly vulnerable, as many trips are short and focused on a single event, leaving limited opportunities to recover value in the event of disruptions. This risk also undermines forward booking confidence and may shift demand toward destinations perceived as more politically stable.
High Cost of Long-Haul Travel, Hospitality, and Event Access Bundles
Pricing is becoming a challenge in the Global Sports Tourism Market, particularly when travel, accommodation, and official access products are bundled with event experiences. The ownership of On Location by TKO and of Quint by Liberty Media reflects a shift toward controlled distribution of hospitality products. Liverpool FC’s heritage tour demonstrates how even non-match-day offerings are being monetized as curated fan experiences rather than low-cost add-ons. While increased spending per traveler supports revenue growth, it also limits accessibility for mid-income and emerging source markets. As a result, the market may grow in value but faces constraints in participation for price-sensitive fans[4].
*Our forecasts treat driver/restraint impacts as directional, not additive. The impact forecasts reflect baseline growth, mix effects, and variable interactions.
Sports Tourism Market Segment Analysis
By Sports Tourism Type:
Event Spectating Leads as Active Formats Drive Long-Term GrowthSpectator and Event Tourism accounted for 52.52% of the Global Sports Tourism Market in 2025, underscoring live attendance as the primary revenue driver. This segment benefits from major global sports properties centered on fixed venues, schedules, and large audiences. The European Parliament defines passive sports tourism as travel focused on spectating major events, attending away games, visiting stadiums, and exploring sports heritage attractions. Sports ETA reported USD 51.1 billion in United States direct spending from spectator sports tourism in 2025, emphasizing the domestic economic impact of event-driven travel. Spectating remains the most prominent and scalable component of the Global Sports Tourism Market, particularly in global cities and recurring league ecosystems.
Active Participation Tourism is forecast to grow at a 7.12% CAGR from 2026 to 2031, making it the fastest-growing segment in the Global Sports Tourism Market. Activities such as destination marathons, cycling tours, sailing, ski trips, and training camps demonstrate the segment's broad scope. Sports ETA reported USD 60.1 billion in United States direct spending from participatory sports tourism in 2025, driven by 227.6 million domestic travelers. Recurring amateur and youth travel, along with seasonally planned training camps and school tours, contribute significantly to this segment. While sports heritage and experience travel have smaller volumes, offerings such as Liverpool FC’s guided Champions Edition tour show potential for high visitor value within this niche.

By Sports Category:
Football Anchors the Market as Endurance Events Claim the Fastest GrowthFootball Tourism accounted for 19.73% of the Global Sports Tourism Market share in 2025, remaining the largest category by revenue. Football’s extensive reach connects club competitions, domestic leagues, continental tournaments, and global events within a unified fan culture. Other sports, including cricket, golf, rugby, cycling, adventure sports, and water sports, contribute to regional circuits and diversify the market. However, football consistently converts broad fan interest into paid travel across domestic and international routes, reinforcing its dominant position in the market.
Marathon and Endurance Sports Tourism is expected to grow at a 7.94% CAGR from 2026 to 2031, making it the fastest-growing category in the Global Sports Tourism Market. World Athletics plans to launch a standalone World Marathon Championships in 2030, with Athens as the preferred host for the inaugural event. This initiative includes investments in modernizing the Authentic Marathon Route, combining event participation, heritage value, and destination branding. These developments enhance the structure of endurance travel, attracting repeat participants and encouraging longer stays. The industry is shifting endurance events from isolated race weekends to a formal international circuit.
By Visitor Origin:
Domestic Volume Underpins Revenue as International Spending AcceleratesDomestic visitors accounted for 64.94% of revenue in 2025, reflecting the market's reliance on local and regional trips rather than cross-border travel. League fixtures, youth tournaments, training events, and short-distance spectator trips drive this trend. In the United States, Sports ETA reported that participatory sports tourism contributed USD 149.1 billion to the total economic impact in 2025, underscoring the importance of recurring domestic travel. Domestic demand ensures steadier cash flow for operators and host cities, as it is less affected by visas, long-haul ticket costs, and travel disruptions. This stability allows the market to remain active even during periods of reduced international traffic.
International visitors accounted for 35.06% of revenues in 2025, with this segment projected to grow at a CAGR of 6.98% through 2031. Sports ETA noted that 3.6 million international travelers visited the United States for sports in 2025, generating USD 6.3 billion in direct spending. International spectator sports travelers increased by 3.4% from 2024. Japan is leveraging sports events to boost inbound tourism, while China is seeing growing interest in major football events, indicating a rising base of international sports travelers from Asia. Although fewer in number, international trips generate higher spending per trip, contributing significantly to the market.
By Booking Channel:
Direct Channels Lead, but Rights-Holder Packages Capture the Fastest GrowthDirect booking channels accounted for 35.61% of global revenue in 2025, reflecting travelers' preference in the Global Sports Tourism Market for purchasing from clubs, venues, or specialist operators rather than general travel intermediaries. This channel is favored for authentic inventory, clearer ticket conditions, and event-linked benefits unavailable elsewhere. Fans often begin with the fixture, club, or race organizer rather than a general destination search, making direct channels essential for pricing control and customer data ownership. This approach is expected to remain strong, particularly where rights holders integrate ticketing, hospitality, and venue experiences into a single sales process.
Official Event and Rights-holder Packages are forecasted to grow at a 7.74% CAGR through 2031, making them the fastest-growing channel in the Global Sports Tourism Market. On Location partners with over 150 rights holders, offering services across more than 1,200 sporting events, including the FIFA World Cup 2026 and upcoming Olympic Games. Quint’s appointment for the Las Vegas Grand Prix, announced in November 2024, and its F1 Experiences platform, reflect a shift toward first-party hospitality distribution and travel packaging. While online travel agencies and general travel sellers remain relevant for hotels, flights, and local transport, official package channels are increasingly shaping event-driven demand. This trend is driving the market toward a hybrid structure, where event owners manage core products while other channels support broader travel needs.
Geography Analysis
Europe Sports Tourism Market
Europe accounted for 33.75% of the Global Sports Tourism Market in 2025, supported by a dense event infrastructure, cross-border mobility, and a rich sports heritage. The European Parliament’s 2026 brief noted that Europe held 38% of the market in 2022 and highlighted that sports generated 6.05 million jobs across the European Union, with spillovers into accommodation, food services, and transport. The region’s diverse sports calendar ensures year-round market activity.
The Americas Sports Tourism Market
North America is a critical event corridor in 2026 as the United States enters the FIFA World Cup cycle. In 2025, the United States sports tourism economy reached USD 274.5 billion, with 339 million sports travelers, underscoring its importance in the market. South America’s sports tourism remains football-driven, with demand tied to club competitions, regional national team events, and niche adventure sports development.
MEA and APAC Sports Tourism Market
The Middle East and Africa are shifting toward sports-led destination models. Saudi Arabia’s Vision 2030 integrates sports and tourism, emphasizing sustainability and public-private partnerships. Africa’s growth focuses on cities linking sports with broader travel appeal, though growth remains uneven. Asia-Pacific, with a projected CAGR of 8.15% from 2026 to 2031, is the fastest-growing region. Japan promotes sports tourism through golf, skiing, and major events. China’s sports economy development and India’s cricket-driven travel strengthen the market. Seoul’s Jamsil Sports and MICE Park adds long-term growth potential.
Competitive Landscape
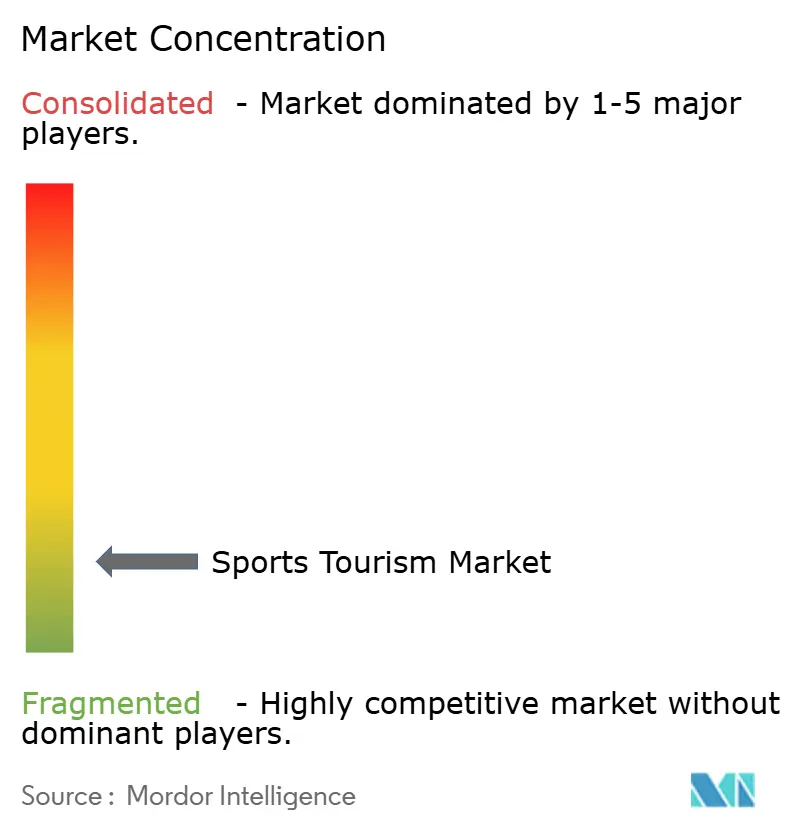
The Global Sports Tourism Market is fragmented, with the top operators holding a small share. Most revenue is distributed among regional specialists, event-specific operators, and niche activity providers. TKO Group Holdings acquired IMG, On Location, and Professional Bull Riders, strengthening its position in sports rights and event operations. Liberty Media acquired Quint, adding official property partnerships and serviced events. These acquisitions highlight the focus on controlling fan access and hospitality inventory. Match Hospitality AG’s loss of FIFA hospitality rights for 2026 shows that incumbency does not guarantee continued control when commercial models change.
Official experience channels developed by event owners or rights holders are expanding. Quint’s role in the Formula 1 Las Vegas Grand Prix and its F1 Experiences platform integrates ticketing, club access, and travel products. On Location’s involvement in the FIFA World Cup 2026 and Olympic cycles provides access to major events. Opportunities remain in women’s sports travel, youth tournaments, and heritage circuits. UEFA’s women’s competitions and Liverpool FC’s stadium experiences demonstrate demand, though few operators offer standardized travel products in these areas.
Regional operators excel in markets tied to local sports calendars, secondary cities, and language-specific needs. In Asia, cricket, football, and mixed-format sports are often organized through local channels. Differences in compliance, payments, ticketing, and customer service hinder rapid consolidation. Larger players rely on property relationships and local partners, keeping the market structured at the top but fragmented locally.
Sports Tourism Industry Leaders
-
QuintEvents LLC
-
On Location (Endeavor Group Holdings)
-
Match Hospitality AG
-
Sports Tours International Ltd.
-
International Sports Management Inc.
- *Disclaimer: Major Players sorted in no particular order
Sports Tourism Market Companies Covered in this Report
- QuintEvents LLC
- On Location (Endeavor Group Holdings)
- International Sports Management Inc.
- Match Hospitality AG
- Sports Tours International Ltd.
- Sportsbreaks.com (Travel Connection Group)
- ATPI Ltd.
- Teamlink Travel
- BAC Sports Ltd.
- CTS Eventim AG & Co. KGaA
- Gala Management Services Ltd.
- Live Nation Entertainment Inc.
- TUI Group
- Expedia Group Inc.
- Booking Holdings Inc.
- Sports Travel and Hospitality Group Ltd.
- KNT-CT Holdings Co., Ltd.
- AEG Worldwide (Anschutz Entertainment Group)
- Victory Sports Tours
- IMG (Endeavor Group Holdings)
Recent Industry Developments in Sports Tourism Market
- March 2026: The Seoul Metropolitan Government announced a public-private partnership for the Jamsil Sports & MICE Park Project, set for 2032 completion. Fully financed through private investment under a revenue-sharing model, it is expected to generate KRW 595 trillion (USD 0.41 trillion) in economic effects and create 2.42 million jobs.
- February 2025: TKO Group Holdings acquired On Location, IMG, and Professional Bull Riders from Endeavor Group Holdings in a USD 3.25 billion all-equity deal. On Location now handles official hospitality for over 1,200 events annually, including the FIFA World Cup 2026 and the next two Olympic Games.
- May 2025: Liverpool FC’s “Walk on the Pitch Tour, Champions Edition” was priced at GBP 60 (USD 80.95) per adult. It included access to the Anfield pitch, a photo with the Premier League trophy, entry to The Liverpool FC Story Museum, and other stadium features.
- March 2024: Quint was named the Official Hospitality Sales Partner for the Formula 1 Heineken Silver Las Vegas Grand Prix, offering luxury hospitality and club tickets for the November 2024 event. This followed Liberty Media’s January 2024 acquisition of Quint, marking the first full-season integration of Formula 1 hospitality distribution under combined ownership.
Global Sports Tourism Market Report Scope
Segmentation Overview
| Active Participation Tourism |
| Spectator and Event Tourism |
| Training Camps and School Tours |
| Sports Heritage and Experience Tourism |
| Adventure Sports |
| Water Sports |
| Rugby Tourism |
| Golf Tourism |
| Cycling & Mountain Biking Tourism |
| Marathon & Endurance Sports Tourism |
| Cricket |
| Football |
| Others |
| Domestic |
| International |
| Direct |
| Official Event and Rights-holder Packages |
| Sports Tour Operators and Travel Agencies |
| Online Travel Agencies and Marketplaces |
| North America | United States |
| Canada | |
| Mexico | |
| South America | Brazil |
| Peru | |
| Chile | |
| Argentina | |
| Rest of South America | |
| Europe | United Kingdom |
| Germany | |
| France | |
| Spain | |
| Italy | |
| BENELUX (Belgium, Netherlands, and Luxembourg) | |
| NORDICS (Denmark, Finland, Iceland, Norway, and Sweden) | |
| Rest of Europe | |
| Asia-Pacific | India |
| China | |
| Japan | |
| Australia | |
| South Korea | |
| South East Asia (Singapore, Malaysia, Thailand, Indonesia, Vietnam, and Philippines) | |
| Rest of Asia-Pacific | |
| Middle East and Africa | United Arab Emirates |
| Saudi Arabia | |
| South Africa | |
| Nigeria | |
| Rest of Middle East and Africa |
| By Sports Tourism Type | Active Participation Tourism | |
| Spectator and Event Tourism | ||
| Training Camps and School Tours | ||
| Sports Heritage and Experience Tourism | ||
| By Sports Category | Adventure Sports | |
| Water Sports | ||
| Rugby Tourism | ||
| Golf Tourism | ||
| Cycling & Mountain Biking Tourism | ||
| Marathon & Endurance Sports Tourism | ||
| Cricket | ||
| Football | ||
| Others | ||
| By Visitor Origin | Domestic | |
| International | ||
| By Booking Channel | Direct | |
| Official Event and Rights-holder Packages | ||
| Sports Tour Operators and Travel Agencies | ||
| Online Travel Agencies and Marketplaces | ||
| By Geography | North America | United States |
| Canada | ||
| Mexico | ||
| South America | Brazil | |
| Peru | ||
| Chile | ||
| Argentina | ||
| Rest of South America | ||
| Europe | United Kingdom | |
| Germany | ||
| France | ||
| Spain | ||
| Italy | ||
| BENELUX (Belgium, Netherlands, and Luxembourg) | ||
| NORDICS (Denmark, Finland, Iceland, Norway, and Sweden) | ||
| Rest of Europe | ||
| Asia-Pacific | India | |
| China | ||
| Japan | ||
| Australia | ||
| South Korea | ||
| South East Asia (Singapore, Malaysia, Thailand, Indonesia, Vietnam, and Philippines) | ||
| Rest of Asia-Pacific | ||
| Middle East and Africa | United Arab Emirates | |
| Saudi Arabia | ||
| South Africa | ||
| Nigeria | ||
| Rest of Middle East and Africa | ||
Key Questions Answered in the Report
How large will the Global Sports Tourism Market be by 2031?
The Global Sports Tourism Market is projected to reach USD 957.91 billion by 2031, rising from USD 712.61 billion in 2026 at a 6.09% CAGR.
What is driving growth in sports-related travel through 2031?
Growth is being supported by a larger global event calendar, premium hospitality packaging, better digital trip planning, and public investment in sports districts and venue infrastructure.
Which region leads global revenue today?
Europe leads with 33.75% of global revenue in 2025, helped by dense event infrastructure, strong cross-border mobility, and established sports heritage assets.
Which region is growing the fastest?
Asia-Pacific is projected to grow at 8.15% CAGR through 2031, supported by policy-backed sports travel programs, cricket demand, and new infrastructure projects.
Which sports format is expanding the fastest?
Marathon and endurance sports tourism is growing the fastest, at a 7.94% CAGR, supported by destination race circuits and World Athletics’ plan to launch standalone world marathon championships from 2030.
Why are official hospitality packages becoming more important?
Official packages are growing at 7.74% CAGR because rights holders and their partners, such as On Location and Quint, are taking more control of fan access, premium inventory, and event-linked travel sales.