
Market Overview
| Study Period | 2020 - 2031 |
|---|---|
| Market Size (2026) | USD 5.93 Billion |
| Market Size (2031) | USD 7.81 Billion |
| Growth Rate (2026 - 2031) | 5.66 % |
| Fastest Growing Market | Middle East and Africa |
| Largest Market | Asia Pacific |
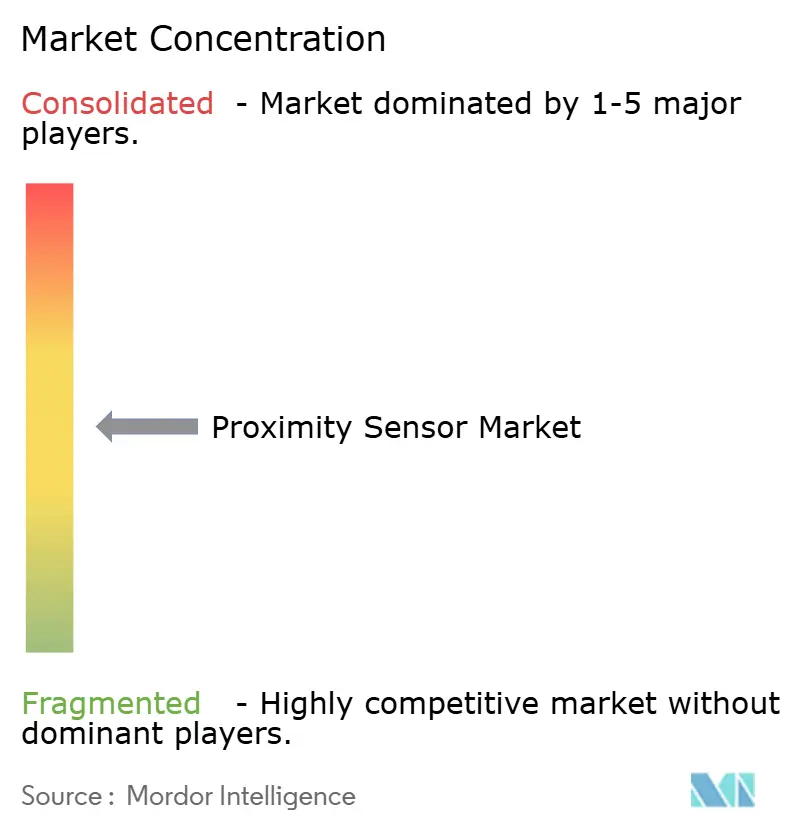
| Market Concentration | Medium |
Major Players *Disclaimer: Major Players sorted in no particular order Image © Mordor Intelligence. Reuse requires attribution under CC BY 4.0. | |
Proximity Sensor Market Analysis by Mordor Intelligence
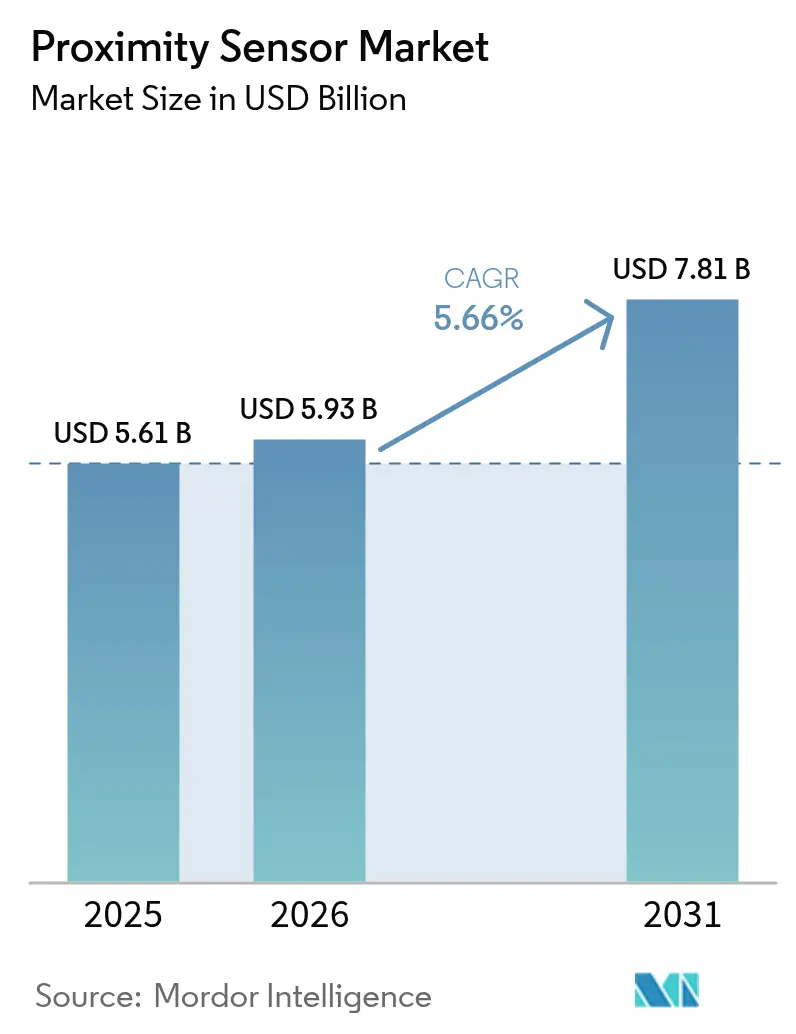
The proximity sensors market size is expected to grow from USD 5.61 billion in 2025 to USD 5.93 billion in 2026 and is forecast to reach USD 7.81 billion by 2031 at 5.66% CAGR over 2026-2031. The 2025 market value of USD 5.61 billion is supported by the intersection of electrified powertrains, aerospace safety directives, and Industry 4.0 retro-fit programs that demand precise, rugged, and cost-efficient detection devices. Growth momentum intensifies as IO-Link-enabled sensors feed real-time diagnostics to edge controllers, trimming factory downtime, while automotive OEM mandates for ISO 26262-certified devices accelerate supplier investments in functional-safety portfolios. Intensifying price pressure on copper coils and the need for electromagnetic compatibility (EMC) in high-power EV inverters temper near-term gains, yet regulatory shifts toward solid-state aviation sensors and the rapid uptake of hybrid Hall-effect, MEMS, and bulk-acoustic-wave devices reinforce a positive long-term outlook for the proximity sensors market.
Key Report Takeaways
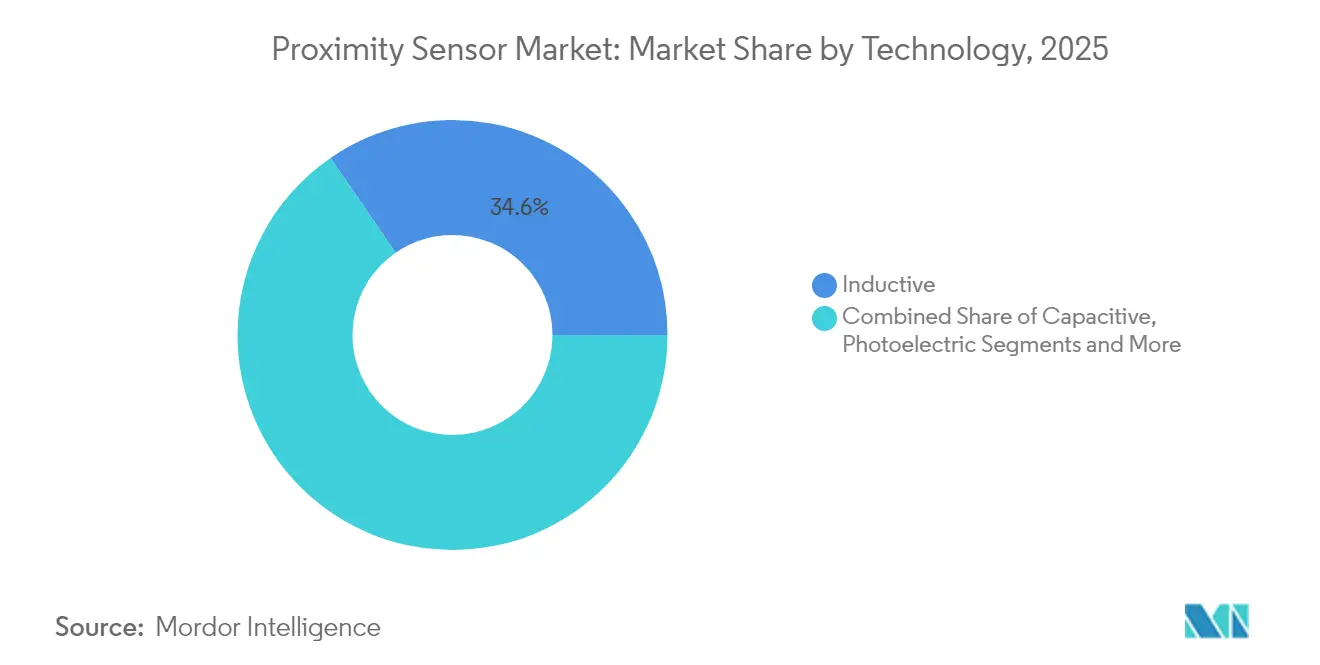
- By technology, inductive devices led with 34.60% of the proximity sensors market share in 2025; capacitive variants record the fastest 9.35% CAGR through 2031.
- By product type, fixed-distance models captured 59.30% of revenue in 2025; adjustable-distance sensors expanded at an 8.12% CAGR.
- By sensing range, the 0-20 mm band commanded 44.40% of proximity sensors market size in 2025; >40 mm devices rose at a 6.95% CAGR.
- By housing, cylindrical packages held a 47.50% share of the proximity sensors market size in 2025; miniature/PCB units register the highest 8.02% CAGR.
- By output type, digital formats dominated with 66.20% of proximity sensors market share in 2025; IO-Link and smart interfaces surge at 9.22% CAGR.
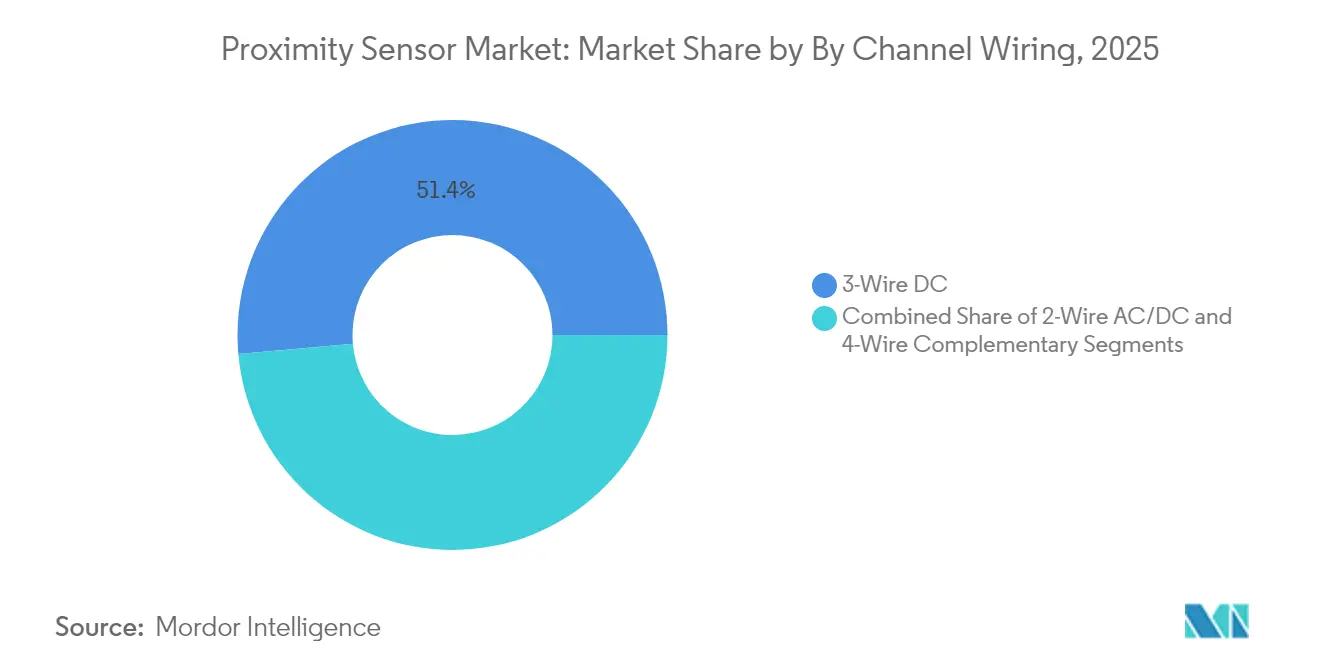
- By wiring, 3-Wire DC remained standard at 51.40% share in 2025; 4-Wire complementary circuits post a 9.24% CAGR.
- By end-user, automotive applications accounted for 26.60% of the proximity sensors market share in 2025; industrial automation and robotics post the strongest 7.62% CAGR.
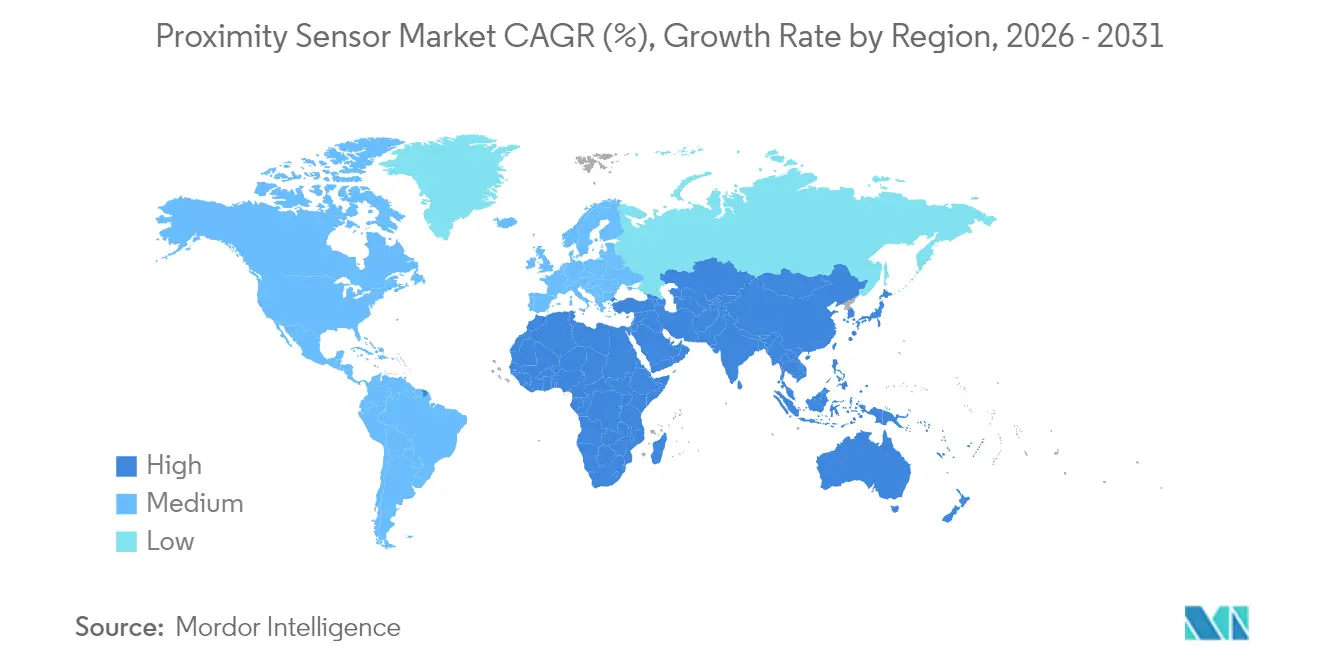
- By region, Asia-Pacific held 35.70% of the proximity sensors market in 2025, while the Middle East delivered the fastest 7.18% CAGR.
Note: Market size and forecast figures in this report are generated using Mordor Intelligence’s proprietary estimation framework, updated with the latest available data and insights as of 2026.
Market Trends and Insights
Drivers Impact Analysis of Proximity Sensor Market*
| DRIVER | (~) % IMPACT ON CAGR FORECAST | GEOGRAPHIC RELEVANCE | IMPACT TIMELINE |
|---|---|---|---|
| Industry 4.0-led Retro-Fit Demand in Brownfield Asian Factories | +1.2% | APAC core, spill-over to MEA | Medium term (2-4 years) |
| Automotive OEM Mandates for ISO 26262-Certified Contactless Positioning | +0.9% | Global, with early gains in Europe & North America | Short term (≤ 2 years) |
| Mini-LED/µLED Back-Light Integration in Smartphones (APAC) | +0.7% | APAC core, particularly China, Japan, South Korea | Short term (≤ 2 years) |
| FAA & EASA Transition to Solid-State Landing-Gear Proximity Sensors | +0.4% | North America & EU, with global aviation impact | Long term (≥ 4 years) |
| IO-Link Adoption in European Discrete Manufacturing Lines | +0.6% | Europe, with spillover to North America & APAC | Medium term (2-4 years) |
| Building Automation and Smart Infrastructure IoT Integration | +0.5% | Global, with concentration in developed markets | Medium term (2-4 years) |
| Source: Mordor Intelligence | |||
Industry 4.0-led Retro-Fit Demand in Brownfield Asian Factories
Manufacturers across China, Vietnam, and Indonesia prefer upgrading existing lines with IO-Link-ready proximity sensors rather than building new plants, unlocking 15-20% efficiency gains and 30% cost cuts through 5G-enabled monitoring [gsma.com]. Suppliers offering drop-in cylindrical devices with PLC-friendly pinouts yet cloud-ready diagnostics dominate retro-fit tenders. Compatibility with legacy controls shields buyers from lengthy downtime, keeping the proximity sensors market buoyant until at least 2028.
Automotive OEM Mandates for ISO 26262-Certified Contactless Positioning
European and U.S. vehicle programs now specify inductive linear and rotary sensors qualified to ASIL C/D, displacing Hall-effect devices sensitive to stray fields. Dual-die architectures introduced by Melexis achieve ±0.85% accuracy over 12 mm strokes and offer built-in redundancy for brake, pedal, and steering modules [melexis.com]. Certification costs create a two-tier supply landscape, pushing smaller firms to license IP or exit, and further consolidating the proximity sensors market.[1]“Melexis Sets a New Reference for Safe and Stray-Field Robust Magnetic Sensors,” melexis.com
Mini-LED/µLED Back-Light Integration in Smartphones (APAC)
Foldable phones and AR headsets adopt high-luminance back-lighting, forcing sensor makers to design ultra-compact parts with sunlight cancellation and idle currents below 5 µA. Vishay’s 2.0 mm × 1.0 mm × 0.5 mm VCNL36828P exemplifies this push toward battery-savvy, package-dense solutions [vishay.com]. The smartphone sector’s volume binds proximity sensors market growth tightly to APAC supply chains.[2]Vishay Intertechnology, “Vishay’s New Proximity Sensor Offers Idle Current Down to 5 µA,” vishay.com
FAA & EASA Transition to Solid-State Landing-Gear Proximity Sensors
January 2025 FAA rules favor solid-state detectors for landing-gear status, spurring retrofits across commercial fleets [faa.gov]. Crane Aerospace’s ELDEC inductive units with continuous health monitoring illustrate the reliability and weight gains sought by airlines [craneae.com]. Certification cycles run four-plus years, underpinning long-run demand for aerospace-grade proximity sensors market offerings.
Restraints Impact Analysis of Proximity Sensor Market*
| RESTRAINTS | (~) % IMPACT ON CAGR FORECAST | GEOGRAPHIC RELEVANCE | IMPACT TIMELINE |
|---|---|---|---|
| Coil-Copper Cost Volatility Impacting Inductive BOM in Europe | -0.8% | Europe, with secondary impact on global supply chains | Short term (≤ 2 years) |
| EMC Compliance Failures in High-Power EV Inverters (US) | -0.5% | North America, with spillover to global EV markets | Medium term (2-4 years) |
| Condensation-Driven False Trips in Food-Grade Photoelectric Sensors | -0.3% | Global, with concentration in food processing regions | Short term (≤ 2 years) |
| ATEX-Zone Certification Lead-Times Delaying Middle-East Projects | -0.4% | Middle East, with impact on oil & gas and petrochemical sectors | Medium term (2-4 years) |
| Source: Mordor Intelligence | |||
Coil-Copper Cost Volatility Impacting Inductive BOM in Europe
Three-year highs in copper spot prices raise coil costs by up to 25%, squeezing margins for German and Italian sensor producers already burdened by elevated electricity tariffs. Larger vendors hedge or vertically integrate copper supply, but smaller firms confront price-list resets quarterly, hampering competitiveness.
EMC Compliance Failures in High-Power EV Inverters (US)
Electric SUVs and pickups running 800 V architectures create broadband interference that disturbs unshielded proximity sensors, leading to costly redesigns. Bench tests show conducted EMI spikes breaching CISPR 25 limits, necessitating filter re-tuning and shielding—a hurdle that elongates validation timelines and caps near-term proximity sensors market revenue potential.
*Our forecasts treat driver/restraint impacts as directional, not additive. The impact forecasts reflect baseline growth, mix effects, and variable interactions.
Proximity Sensor Market Segment Analysis
By Technology:
Inductive Sensors Lead Despite Capacitive Growth SurgeInductive units delivered 34.60% of 2025 revenue, validating their status as the de-facto choice for metal detection on press lines and CNC machines embedded across the proximity sensors market. Rugged ferrite-core coils endure oil, chips, and vibration, ideal for retro-fits in APAC factories. Capacitive devices, advancing at 9.35% CAGR, now sense plastic housings and fluid levels in pharmaceutical clean rooms where inductive devices fail. The hybridization trend—combining Hall-effect for angle and capacitive for presence—pushes suppliers toward multi-physics ASICs that simplify installation and reduce SKU count.
Capacitive adoption accelerates because one sensor can cover glass, resin, or grain level without mechanical contact, aligning with food-safety mandates. Photoelectric SKUs retain niches requiring 10 m targeting over dusty conveyors, while ultrasonic variants serve chemical vats impervious to optical methods. Magnetic xMR sensors gain share within EV traction motors needing millidegree precision for field-oriented control. Collectively, these transitions keep the proximity sensors market varied and resilient.



By Product Type:
Fixed-Distance Dominance Faces Adjustable-Distance ChallengeSkewing to cost efficiency, fixed-distance cylinders amassed 59.30% of 2025 shipments. Automotive stamping plants, running identical door panels year-round, favor fixed thresholds to avoid accidental recalibration. However, short batch runs in electronics assembly spark an 8.12% CAGR for adjustable-distance models equipped with IO-Link parameterization. Production engineers tweak on-board firmware rather than swapping hardware, slashing changeover times. In plants moving toward lights-out operation, smart adjustable devices feed EQ timestamps and cycle counts to MES dashboards, deepening digital twins and elevating the proximity sensors market profile.
Maintenance teams cite reduced spares when one adjustable sensor covers multiple jig distances, offsetting its higher list price. Suppliers compete on LED-guided teach modes and NFC smartphone setup, reinforcing ease of use. Long term, firmware-driven range tuning is expected to become the default in flexible factories.
By Sensing Range:
Short-Range Applications Drive Volume While Long-Range Sees Fastest GrowthSmartphone pick-and-place stages, electric-motor commutation, and snap-fit quality checks keep 0-20 mm sensors at 44.40% of proximity sensors market size in 2025. Their solid-state ruggedness beats mechanical limit switches and reduces false rejects. Yet warehouse automation, AMRs, and pallet-shuttle systems require line-of-sight safety at two-meter plus distances, lifting>40 mm devices at a 6.95% CAGR. Suppliers respond with amplified transceivers and beam-forming optics capable of 4 m detection even in fog, complementing LiDAR and radar for 360° robot perception.
In intralogistics, longer-range proximity avoids blind-spot collisions without the cost of high-resolution vision. Hybrid ultrasonic-photoelectric stacks enter this space, integrating distance and presence into one SKU, reducing points of failure and wiring labor in high-bay racking.
By Housing/Form Factor:
Cylindrical Standards Meet Miniaturization DemandsLegacy M12/M18/M30 threaded barrels own 47.50% share of the proximity sensors market size thanks to global fixture compatibility and IP67 sealing. Tool-less lock nuts and quick-disconnect M12 plugs simplify swap-outs in automotive paint lines. Consumer electronics OEMs, however, insist on sub-3 mm PCB-mount footprints to fit foldable screens, encouraging an 8.02% CAGR for miniaturized devices. Board-level sensors eliminate cable harnesses and cut assembly seconds in high-volume SMT lines.
Rectangular blocks sit flush on conveyor sidewalls where barrels protrude dangerously, while ring sensors verify cap presence in bottling plants. Across all shapes, suppliers adopt over-molded plastics rated to 105 °C to survive reflow soldering and under-hood temperatures, expanding design freedom for the proximity sensors market.
By Output Type:
Digital Dominance Challenged by Smart Interface GrowthDigital NPN/PNP outputs still occupy 66.20% of proximity sensors market share in 2025, powering rely-on simplicity for stop/go gun-drill operations. Nonetheless, IO-Link nodes, logging switching cycles and core temperature, accelerate at 9.22% CAGR. One cable caries power, data, and remote programming, cutting analog I/O modules and torqueing predictive maintenance paybacks. Analog 4-20 mA lines persist in valve-position feedback but cede ground as new PLCs favor digital fieldbuses.
Motion integrators rely on histogram diagnostics to pre-empt coil aging, turning sensors from cost centers into IIoT assets. Suppliers bundle edge intelligence that flags drift, reducing unscheduled downtime—an argument boosting average selling prices across the proximity sensors market.
By Channel Wiring:
3-Wire DC Standard Faces 4-Wire Complementary GrowthThe venerable 3-Wire topology preserves 51.40% market share on account of its balance between simplicity and high-switch speed. In contrast, 4-Wire complementary outputs log a 9.24% CAGR as automotive ASIL programs demand dual channels for diagnostic coverage. Safety controllers cross-check the two outputs to detect shorts or stuck-on faults, crucial in steer-by-wire and battery-cell production lines. Suppliers integrate self-test pulses, facilitating routine proof tests without halting machinery, further embedding such devices in the proximity sensors market.
2-Wire AC/DC forms cling to low-spec conveyor and HVAC duct duty where maintenance staff prefer universal power compatibility. Even here, advanced energy metering tasks push adoption of three-wire powered IO-Link nodes, eroding legacy shares.
By End-User Industry:
Automotive Leadership Challenged by Industrial Automation GrowthEV traction motors, battery thermal loops, and advanced driver assistance systems secure 26.60% proximity sensors market share for automotive in 2025. Each electric vehicle embeds 30-plus sensors replacing cam-shaft triggers of ICE powertrains. Yet lights-out factories and collaborative robots drive a 7.62% CAGR in the industrial automation bucket. Predictive-maintenance strategies lean on IO-Link proximity event logs to schedule bearing lubrication and servo replacement.
Aerospace programs now replace mechanical limit switches on flaps and gear with inductive proximity units rated to 200 °C continuous, extending flight hours between checks. Consumer electronics OEMs squeeze sensors into VR headset lenses, expanding unit volumes. Food and beverage sectors insist on EHEDG-compliant stainless bodies and IP69K wash-down proofing to satisfy hygiene audits, broadening scope within the proximity sensors market.
Geography Analysis
APAC Proximity Sensor Market
Asia-Pacific retained 35.70% proximity sensors market share in 2025, buoyed by China’s factory digitalization grants, Japan’s robotics export leadership, and South Korea’s semiconductor investments. Retro-fitting brownfield lines with IO-Link sensors boosts output without new buildings, aligning with local CapEx restrictions. Component makers co-locate sensor assembly near smartphone clusters, shrinking lead times amid tight product cycles. Governments subsidize 5G private networks, anchoring sensor data backbones that support real-time quality loops.
Europe Proximity Sensor Market
Europe remains a premium buyer base. German Tier-1s demand ASIL-D inductive encoders for steer-by-wire, while French aerospace integrators specify ELDEC sensors for harsh turbine bays. Continual copper price waves and high electricity tariffs raise European BOMs, nudging some coil-winding to Central Europe yet retaining R&D centers near OEMs. The continent’s push for net-zero factories incentivizes IO-Link diagnostics that trim scrap and energy waste, reinforcing advanced use-case uptake across the proximity sensors market.
North America Proximity Sensor Market
North America records steady but mature consumption, concentrated in aerospace, energy, and a burgeoning EV supply chain. U.S. energy grid modernization programs open niches for proximity sensors monitoring breaker position and valve status. Schneider Electric’s USD 700 million cap-ex illustrates domestic appetite for digitized switchgear and panelboards that embed factory-calibrated sensors. Canada’s mining automation and Mexico’s auto assembly exports deepen regional demand.
MEA and South America Proximity Sensor Market
The Middle East delivers the quickest 7.18% CAGR, with Saudi Arabia’s petrochemical and utility plants installing predictive-maintenance suites featuring hundreds of IO-Link proximity nodes per site. Africa and South America, while early in automation adoption, lay groundwork through logistics and food-processing plants, offering long-tail upside to the global proximity sensors market.

Regulatory Landscape
Proximity sensors used in industrial machinery and automation are commonly qualified against IEC 60947-5-2:2019 for proximity switches covering inductive, capacitive, ultrasonic, photoelectric, and magnetic types. This anchors core electrical, environmental, and functional requirements that OEMs and test labs use. For personnel-protection use cases, IEC TS 62998-1:2019 sets safety requirements for sensor systems used to protect persons, tightening documentation and validation practices for safety-related deployments.
In Europe, proximity sensors integrated into machinery and building systems typically align with CE-marking obligations under the EMC Directive (2014/30/EU) and Low Voltage Directive (2014/35/EU), while end-of-life design choices are influenced by WEEE. The EU Machinery Regulation (EU) 2023/1230 takes effect in January 2027, raising the importance of traceable conformity assessment and technical documentation for safety-related sensors used in machine control architectures. Standardization also continues, including EN IEC 60730-2-23:2025 (June 2025), which specifies safety, reliability, and performance requirements for electrical sensors and sensing elements used in automatic electrical controls.
Value Chain Analysis
The proximity sensor value chain begins with semiconductor and materials inputs (mature-node ICs, magnetic materials, copper coils, optics, and engineered plastics and steel housings). It then moves through sensor module design (ASIC and firmware, EMC hardening, functional-safety documentation) and manufacturing (coil winding, SMT, overmolding, calibration, and test), before reaching channels spanning automation distributors, OEM direct sales, and system integrators. Supply resilience and lead-time control remain closely tied to access to mature-node wafer capacity used for sensor ICs and companion controllers, which supports dual-sourcing and regionalized production strategies among large vendors.
Downstream, platform and technology partnerships increasingly connect discrete proximity sensing to broader perception and diagnostics stacks used in factories and smart infrastructure. For instance, SICK integrated Aeva FMCW sensing technology into its industrial sensing product line (June 2026). Excelitas signed a strategic agreement with Acconeer to sell radar sensors globally and co-develop sensor-fusion solutions that combine PIR motion detection and radar for presence sensing (May 2026). On the manufacturing footprint side, TDK announced the start of advanced sensor manufacturing for Apple products within the United States (March 2026), highlighting how localization efforts can affect component availability, qualification cycles, and logistics risk for high-volume sensing programs.
Competitive Landscape
Keyence, Omron, Pepperl+Fuchs, and SICK anchor a moderately fragmented field through broad catalogs, in-house ASICs, and global service teams. They defend share by embedding artificial intelligence into sensor micro-controllers that self-tune switching points and flag coil fatigue. Melexis and Allegro MicroSystems concentrate on automotive xMR and inductive chips meeting functional-safety metrics, commanding higher ASPs. Crane Aerospace & Electronics dominates low-volume, high-spec aviation units, protected by DO-160G test pedigrees.
Strategic partnerships intensify: SICK ceded process analyzer sales to Endress+Hauser, freeing resources for logistics and factory automation. Datalogic’s acquisition of M.D. Micro Detectors added cylindrical inductives and IO-Link expertise to its scanner roots, broadening competitiveness. R&D pivots toward hybrid sensors combining magnetic, capacitive, and ultrasonic stacks in one housing, shrinking parts count and easing installation—traits prized by OEMs seeking lighter cable looms. Edge-native analytics position sensors as smart nodes in cybersecurity-hardened industrial Ethernet networks, elevating the proximity sensors market beyond simple on/off detection.
White-space frontiers include smart building automation, where occupancy-driven HVAC controls use millimeter-wave and infrared proximity to curb energy bills in LEED-certified offices. Suppliers fine-tune low-power designs compatible with battery-less, energy-harvesting nodes, targeting building automation control systems forecast to expand 7.9% per year through 2031. The result is a dynamic yet consolidating proximity sensors market where scale, IP, and domain-specific certifications dictate winners.
Proximity Sensor Industry Leaders
Keyence Corporation
Omron Corporation
Pepperl+Fuchs GmbH
Sick AG
Honeywell International Inc.
- *Disclaimer: Major Players sorted in no particular order
Proximity Sensor Market Companies Covered in this Report
- Keyence Corporation
- Omron Corporation
- Pepperl+Fuchs GmbH
- Sick AG
- Panasonic Holdings Corp.
- Honeywell International Inc.
- STMicroelectronics N.V.
- Schneider Electric SE
- Rockwell Automation Inc.
- IFM Electronic GmbH
- Turck Holding GmbH
- Datalogic SpA
- Delta Electronics Inc.
- Autonics Corporation
- Balluff GmbH
- Banner Engineering Corp.
- Texas Instruments Inc.
- Broadcom Inc.
- Littelfuse Inc.
- Baumer Group
- Vishay Intertechnology
- BorgWarner Inc.
- Allegro MicroSystems
- Leuze electronic GmbH

Market Opportunities and Future Outlook
An opportunity exists in the shift from passive, discrete outputs to networked, diagnostic-capable proximity sensing that feeds into factory and facility software, particularly when downtime is costly. Rockwell Automation integrating advanced proximity sensor diagnostics into the FactoryTalk platform (February 2025), along with report segmentation showing IO-Link and other smart interfaces growing faster than basic digital outputs, points to a practical route for suppliers: bundle parameterization, event logging, and health indicators that reduce commissioning time and support predictive maintenance workflows.
White space also appears where applications require higher robustness, miniaturization, and tighter compliance envelopes. Pepperl+Fuchs launching a high-temperature inductive sensor with an integrated IO-Link interface (November 2024) indicates demand for sensors that keep diagnostics in harsh thermal zones, while consumer-electronics miniaturization and low-power requirements support pull for compact proximity solutions (including ultra-small packages and low idle current designs used in wearables and AR/VR devices). On the demand side, rising automation density increases the number of sensing points per cell, and IFR reporting global industrial robot installations of 44,303 units in 2023 (12% increase) expands the installed base for proximity sensing in end-effectors, safety interlocks, and intralogistics. These signals support continued investment in IO-Link-enabled portfolios, ruggedized designs, and software-integrated diagnostics rather than competing only on catalog specifications.
Recent Industry Developments in Proximity Sensor Market
- July 2026: Keyence Corporation of America introduced the ER series inductive proximity sensor featuring pulse oscillation and dual-coil detection to support flush metal mounting, with models rated to IP68G and IP69K. The launch targets environments where washdown, contamination, and ingress protection drive unplanned stoppages, strengthening Keyence's position in higher-spec industrial sensing. It also reinforces the premiumization trend around ruggedized, maintenance-friendly proximity sensing in factory automation.
- June 2026: SICK AG announced the integration of Aeva FMCW sensing technology into its industrial sensing product line, expanding radar-based presence detection. The integration strengthens its multi-technology portfolio and enables higher resolution detection in challenging factory environments, supporting smarter diagnostics and predictive maintenance programs.
- October 2024: BinMaster acquired Senix Corporation, adding ToughSonic ultrasonic sensing products for level and distance measurement in industrial automation applications. The acquisition broadens product depth across ultrasonic proximity-style use cases where optical or inductive approaches are less effective (for example, liquids, dust, and challenging surfaces). It also highlights portfolio consolidation as vendors build multi-technology offerings to address diverse industrial environments with fewer suppliers.


Proximity Sensor Market Report Scope and Research Methodology
Market Definition and Coverage
For this study, the proximity sensors market covers revenues earned from sensors that detect the presence or position of an object without physical contact, using technologies such as electromagnetic fields or radiation. We size the market in value terms at the global level across major industrial and commercial end uses.
Scope exclusions: We exclude consumer-only uses where the sensor is not sold into industrial or commercial value chains as a separable component.
Segments Covered in This Report
- By Technology
- Inductive
- Capacitive
- Photoelectric
- Magnetic (Hall-Effect and Reed)
- Ultrasonic
- Infra-Red and Others
- By Product Type
- Fixed-Distance Sensors
- Adjustable-Distance Sensors
- By Sensing Range
- 0 - 20 mm
- 20 - 40 mm
- Greater than 40 mm
- By Housing / Form Factor
- Cylindrical
- Rectangular
- Slot / Channel
- Miniature / PCB-Mount
- Ring and Through-Beam
- By Output Type
- Digital (NPN / PNP)
- Analog (0-10 V / 4-20 mA)
- IO-Link and Other Smart Interfaces
- By Channel Wiring
- 2-Wire AC/DC
- 3-Wire DC
- 4-Wire Complementary
- By End-user Industry
- Aerospace and Defense
- Automotive
- Industrial Automation and Robotics
- Consumer Electronics and Wearables
- Food and Beverage Processing
- Healthcare and Medical Devices
- Building Automation and Smart Infrastructure
- Other Industries (Mining, Agriculture, Marine)
- By Geography
- North America
- United States
- Canada
- Mexico
- Europe
- United Kingdom
- Germany
- France
- Italy
- Rest of Europe
- Asia-Pacific
- China
- Japan
- India
- South Korea
- Rest of Asia-Pacific
- Middle East
- Israel
- Saudi Arabia
- United Arab Emirates
- Turkey
- Rest of Middle East
- Africa
- South Africa
- Egypt
- Rest of Africa
- South America
- Brazil
- Argentina
- Rest of South America
- North America
Data Sources, Market Sizing, and Validation
Desk Research
Desk research was used to build the initial demand and supply picture, then to set realistic ranges for volumes, pricing, and adoption by industry. We relied on public and official references such as UN Comtrade trade statistics, OECD and World Bank macro indicators, and ISO publications for standards context, along with IEC materials where relevant.
To tie inputs back to real deployment, we also used government manufacturing output data, customs and tariff classification notes, and peer reviewed journals covering sensing technologies and industrial automation trends. Beyond this, we reviewed company filings, annual reports, investor presentations, association websites, and reputed press to understand product positioning and end market exposure. Select paid subscriptions were used only for company financials and patent landscaping to cross-check product activity and investment signals. The sources listed here are illustrative, and other public references were also used during data collection, validation, and clarification.
Primary Interviews and Surveys
Primary work focused on validating which proximity sensing technologies are being adopted by each end-use industry, and what typical pricing and replacement patterns look like across regions. We spoke with a mix of sensor ecosystem participants (manufacturing, distribution, system integration, and industrial end users), so assumptions from desk research could be corrected and carried consistently into the final model.
Distribution of primary research fieldwork respondents
| Company type | Respondent position | Region |
|---|---|---|
| Top tier: 29% | CXOs: 15% | APAC: 44% |
| Mid tier: 51% | Functional/Unit leaders: 25% | EMEA: 33% |
| Smaller Players: 20% | Managers: 60% | Americas: 23% |
Market-Sizing & Forecasting
The market was first constructed using a top-down approach where production, trade, and manufacturing activity indicators were translated into a realistic proximity sensor demand pool by industry and region. We then corroborated totals with selective bottom-up approximations, such as sampled average selling price (ASP) by technology multiplied by estimated shipment volumes for key end uses, followed by channel checks to sanity-test the totals.
Inputs used in the model include industrial automation spending signals, automotive production and electrification mix, factory robotics and machine safety rollout intensity, typical sensing range and housing preferences by environment, and ASP movement by sensing technology (illustrative, not exhaustive). Where direct volume splits were not consistently available, we filled gaps using proxy indicators like end-user output growth and import-export movements for relevant sensor categories, and then rechecked implied penetration rates with interview feedback. For forecasting, we used scenario analysis supported by manufacturing output, automation investment cycles, and automotive build rates, and selected the final path only after trend direction was confirmed by primary respondents.
Data Validation & Update Cycle
Model outputs are checked against independent market signals, and outliers are investigated before figures are finalized. We run variance checks across regions, technology mixes, and pricing assumptions so unusual jumps are explained by a clear driver rather than a modeling error. When gaps remain, we re-contact respondents to confirm whether the issue is a local market shift, a classification mismatch, or a timing effect.
A multi-step analyst review is followed so calculations, assumptions, and linkages are consistent across the dataset. Reports are refreshed annually, with interim updates when material events change demand, supply, or pricing direction. Before delivery, an analyst performs a fresh pass on key inputs so clients receive the most current view available at that time.
Mordor Intelligence's Global Proximity Sensors Market Market Size Compared Against Other Published Estimates
Published market values for proximity sensors can vary even when the topic sounds identical, because each publisher uses different scope rules, price points, and timing for what counts as revenue. Differences also show up when some studies lean more on shipment indicators while others lean more on end-user spending signals.
For this market, the main gap drivers are whether only industrial and commercial proximity sensor revenues are counted, how technology categories are grouped, and how ASP changes are carried forward across regions. Some estimates blend in adjacent sensor categories or include consumer-heavy applications, while others assume faster automation and vehicle electronics adoption without a clear cross-check to manufacturing output and trade flows. That is why the spread is visible for Mordor Intelligence.
Benchmark comparison
| Source | Market Size | Gaps in Research Methodology |
|---|---|---|
| Mordor Intelligence | USD 5.93 B (2026) | |
| Global Consultancy A | USD 4.74 B (2026) | This figure appears more conservative on current-year revenue capture, and the public summary does not clearly state how technology scope, end-use coverage, and pricing normalization were handled across regions. |
| Industry Publisher B | USD 5.32 B (2025) | This estimate is anchored to a different year and is presented with limited detail on what was excluded, especially around application boundaries and how ASPs were updated by technology over time. |
Looking across the table, the spread is mostly explained by scope clarity, year selection, and how pricing and adoption are carried through in the model. When scope is stated tightly and checked against external signals like trade movements and end-market output, the resulting total becomes easier to trace, repeat, and update without large swings.


Key Questions Answered in the Report
What is the current value of the proximity sensors market?
The proximity sensors market is valued at USD 5.93 billion in 2026, with a forecast to reach USD 7.81 billion by 2031.
Which region leads the proximity sensors market?
Asia-Pacific holds 35.70% of global revenue, driven by China’s factory digitalization, Japan’s robotics leadership, and South Korean electronics manufacturing.
Which technology commands the largest proximity sensors market share?
Inductive sensors lead with 34.60% share in 2025 thanks to their robustness in metal-rich industrial settings.
How quickly are IO-Link-enabled sensors growing?
Smart IO-Link and similar interfaces are expanding at a 9.22% CAGR as manufacturers demand real-time diagnostics and predictive maintenance.
Why are ISO 26262-certified sensors gaining importance?
Automotive OEMs require safety-rated contactless position sensors to meet functional-safety standards, driving premium demand and reshaping supplier strategies.
What is the main restraint affecting proximity sensor suppliers today?
Volatile copper prices inflate inductive sensor coil costs, particularly for European manufacturers dependent on energy-intensive copper processing.
Page last updated on:





