Market Overview
| Study Period | 2019 - 2030 |
|---|---|
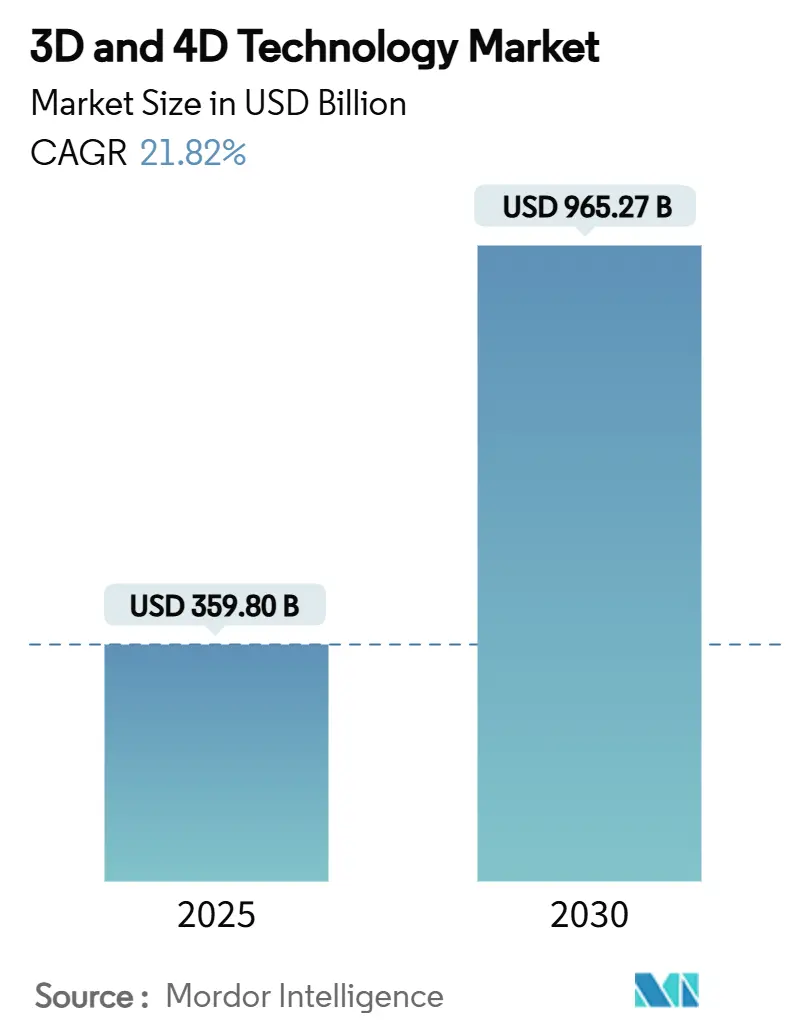
| Market Size (2025) | USD 359.80 Billion |
| Market Size (2030) | USD 965.27 Billion |
| Growth Rate (2025 - 2030) | 21.82% CAGR |
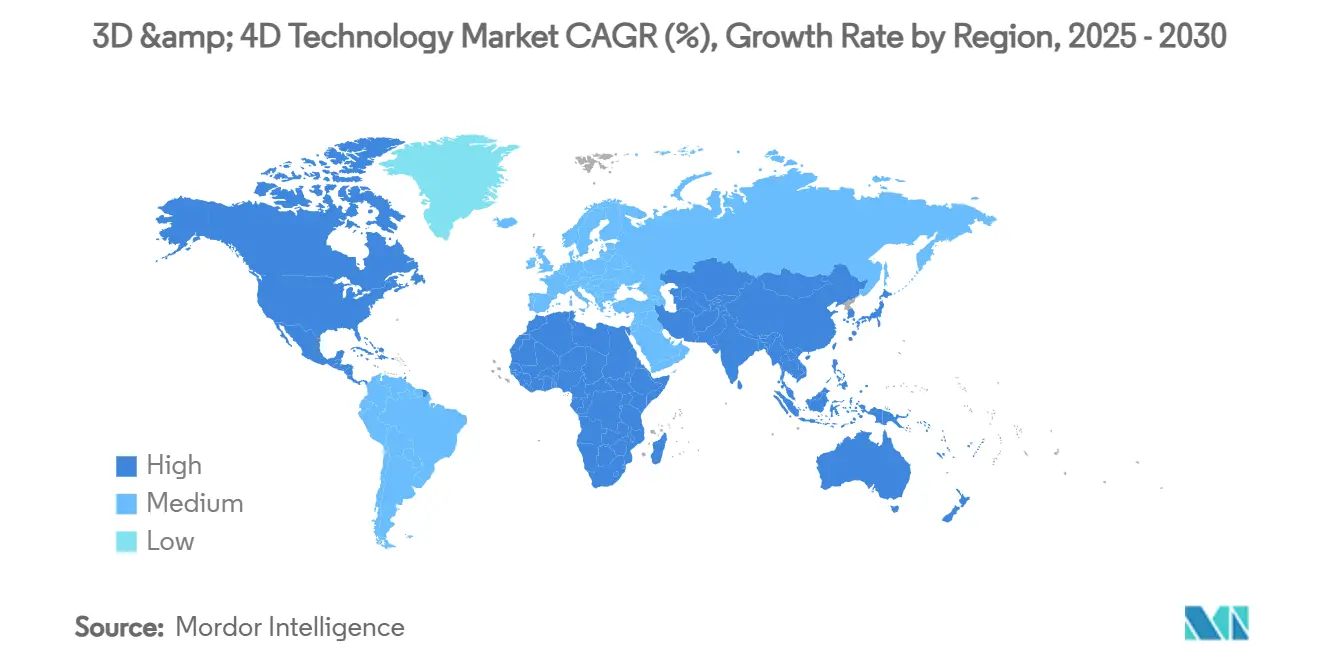
| Fastest Growing Market | Asia Pacific |
| Largest Market | North America |
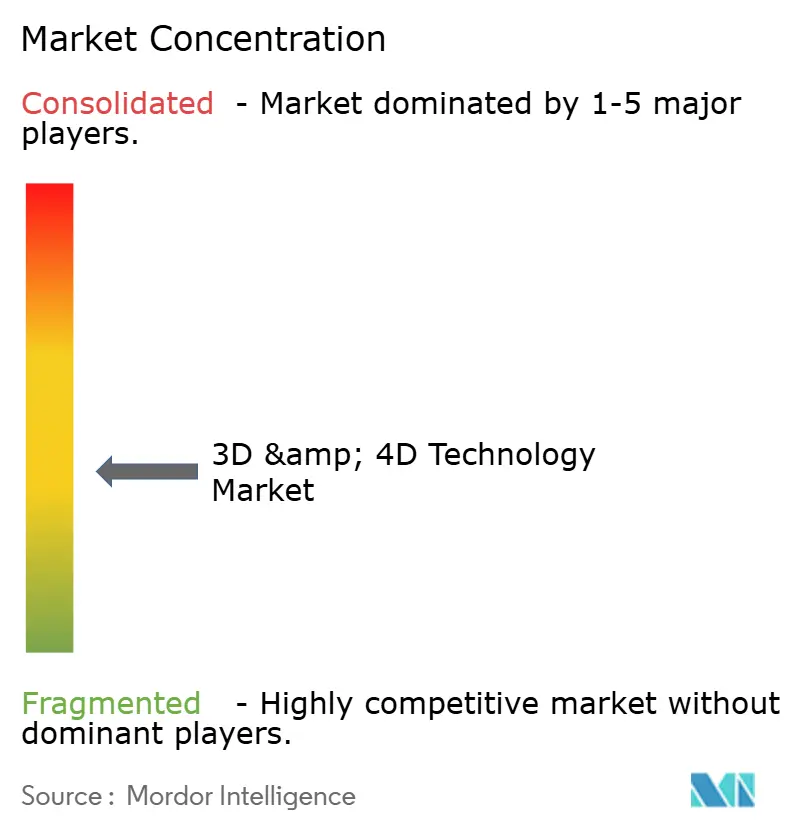
| Market Concentration | Medium |
Major Players *Disclaimer: Major Players sorted in no particular order Image © Mordor Intelligence. Reuse requires attribution under CC BY 4.0. | |
3D & 4D Technology Market Analysis by Mordor Intelligence
The 3D and 4D Technology market size is estimated at USD 359.8 billion in 2025 and is forecast to reach USD 965.27 billion by 2030, reflecting a 21.82% CAGR over the period 2025 to 2030. Hardware price declines, LiDAR-equipped consumer devices, and government funding for smart-city digital twins expand the demand pool. Edge-to-cloud graphics processors now stream 4D scenes in real time, shifting the technology from prototyping toward full-scale production ecosystems. Enterprises also lean on outcome-based service models that wrap design, printing, and maintenance into predictable fees, while temporal data processing lifts 4D applications into premium segments of the 3D and 4D Technology market.[1]Aeva, “Atlas Ultra 4D LiDAR Sensor,” aeva.com
Key Report Takeaways
- By component, hardware commanded 61% of 3D and 4D Technology market share in 2024, while services post the fastest 29.40% CAGR through 2030.
- By technology, 3D solutions held 78% revenue in 2024; 4D platforms expand at 28.55% CAGR to 2030.
- By application, 3D displays contributed 29% of 2024 revenue; 3D gaming and simulation accelerates at a 30.10% CAGR.
- By end-user industry, healthcare captured 21% revenue in 2024, but industrial and manufacturing is advancing at 27.60% CAGR.
- By geography, North America led with 33% revenue in 2024, whereas Asia-Pacific records the highest 25.40% CAGR through 2030.
Global 3D & 4D Technology Market Trends and Insights
Drivers Impact Analysis*
| Driver | (~) % Impact on CAGR Forecast | Geographic Relevance | Impact Timeline |
|---|---|---|---|
| Proliferation of LiDAR-enabled consumer devices | 3.20% | Global, with early gains in North America & APAC | Medium term (2-4 years) |
| Rapid cost decline of industrial-grade additive manufacturing systems | 4.10% | Global, concentrated in Industrial Manufacturing hubs | Short term (≤ 2 years) |
| Content-streaming platforms demanding volumetric video | 2.80% | North America & EU leading, APAC following | Medium term (2-4 years) |
| Government meta-infrastructure spending for Digital Twins | 3.50% | APAC core, spill-over to MEA and Latin America | Long term (≥ 4 years) |
| Edge-to-cloud GPU evolution enabling real-time 4D rendering | 4.70% | Global, with concentration in tech-advanced regions | Short term (≤ 2 years) |
| Standardization of USD for 3D data exchange | 2.90% | Global, industry-wide adoption | Medium term (2-4 years) |
| Source: Mordor Intelligence | |||
LiDAR-enabled consumer devices
Smartphones, tablets, and next-generation driver-assistance systems now embed compact LiDAR arrays, making 3D scanning as routine as taking a photo. Aeva’s Atlas Ultra exemplifies this shift by delivering long-range 4D sensing in a slim form factor. Mass availability of spatial data boosts demand for authoring tools and cloud renderers, enlarging the 3D and 4D Technology market in both consumer and enterprise contexts. Automotive OEMs employ Doppler-rich 4D LiDAR streams to improve perception in autonomous systems, further reinforcing sensor adoption cycles.
Rapid cost decline of industrial-grade additive manufacturing systems
Powder recycling systems from Stratasys lower material waste by 89%, while HP’s reusable polymers reach 85% recyclability. Combined with economies of scale, these advances compress per-part costs and open the door to volume production of functional parts, pushing the 3D and 4D Technology market deeper into factory floors. OEMs such as BMW already exceed 100,000 printed parts annually across global plants, proving the commercial viability of high-throughput additive workflows.[3]Stratasys, “Powder Recycling Cuts 3D Printing Carbon Footprint,” stratasys.com
Demand for volumetric video from streaming platforms
Content providers use 4D capture to create interactive experiences that traditional 2D video cannot deliver. Unity’s “The Heretic” shows how time-resolved scans can be manipulated in real time. Complementary spatial-audio features, such as Samsung’s Eclipsa Audio 3D developed with Google, enrich immersion and increase bandwidth for volumetric assets. This trend taps fresh revenue channels and fortifies service demand inside the 3D and 4D Technology industry.[2]NVIDIA, “Q4 FY25 Financial Results,” nvidia.com
Government meta-infrastructure spending for digital twins
National and municipal administrations fund virtual replicas of bridges, ports, and power networks to optimise maintenance and disaster response. The World Economic Forum underscores digital twins’ systemic value for industrial ecosystems. Asia-Pacific programmes dominate early deployments, yet similar investments appear in Europe and the Americas, stimulating long-cycle demand for sensors, simulation software, and edge hardware across the 3D and 4D Technology market.
Restraints Impact Analysis*
| Restraint | (~) % Impact on CAGR Forecast | Geographic Relevance | Impact Timeline |
|---|---|---|---|
| Acute skills gap in spatial-computing content creation | -2.10% | Global, most severe in emerging markets | Long term (≥ 4 years) |
| High TCO of industrial 4D cameras and scanners | -1.80% | Global, concentrated in SME segments | Medium term (2-4 years) |
| Patent thicket around haptics & stereoscopy | -1.30% | Global, affecting innovation pace | Long term (≥ 4 years) |
| Fragmented software interoperability across 3D pipelines | -1.70% | Global, industry-wide challenge | Medium term (2-4 years) |
| Source: Mordor Intelligence | |||
Skills gap in spatial-computing content creation
Demand for 3D artists outstrips supply as design schools race to update curricula. EON Reality launched a freemium XR training portal to scale talent pipelines. The shortage inflates salaries and delays project launches, tempering near-term growth for the 3D and 4D Technology market. [4]EON Reality, “Global XR Education Platform,” eonreality.com
High TCO of industrial 4D cameras and scanners
Enterprise-grade multi-spectral rigs require high upfront spend plus extended maintenance contracts. Metal powders for laser sintering still cost USD 300–1,000/kg, and trade tariffs inflate hardware import prices. This cost barrier sidelines small and mid-size manufacturers that would otherwise expand the 3D and 4D Technology market size.
*Our forecasts treat driver/restraint impacts as directional, not additive. The impact forecasts reflect baseline growth, mix effects, and variable interactions.
Segment Analysis
By Component: Services Gain Momentum as Hardware Commoditizes
Hardware retained 61% revenue in 2024, but the services segment is climbing at a 29.40% CAGR. This pivot shows organisations preferring bundled design-to-manufacture offerings that smooth cash flows and plug skills gaps. Managed print farms, on-demand scanning, and cloud simulation eliminate cap-ex and shift risk to providers, broadening the 3D and 4D Technology market footprint.
The acceleration also rides on specialist know-how. Materialise expanded point-of-care printing services that wrap AI planning and XR visualisation into turnkey surgical kits, signalling a premium for domain expertise over commodity machinery. As hardware ASPs slide, service revenue captures a larger slice of the 3D and 4D Technology market share, reinforcing annuity-style income streams for vendors.


Component
| X | Y |
|---|---|
| Hardware | 61% |
| Combined share of software and services | 39% |
| Source: Mordor Intelligence | |
By Technology: 4D Printing Challenges 3D’s Maturity Curve
3D solutions held 78% revenue in 2024, yet 4D systems are clocking 28.55% CAGR as adaptive materials reach pilot scale. Self-morphing composites and shape-memory polymers unlock aerospace repair patches and medical stents that reconfigure in situ. Research prototypes already demonstrate self-healing drone skins and deployable space structures, hinting at high-margin niches within the 3D and 4D Technology market.
Commercialisation hurdles remain but rising funding and standards bode well for volume uptake beyond 2028. Once scalability matures, 4D capabilities will stretch the 3D and 4D Technology market size by enabling products that continuously respond to temperature, moisture, or electrical stimuli without external actuators.
By Application: Gaming and Simulation Accelerate Past Static Displays
3D displays generated 29% revenue in 2024 on the back of digital signage, VR headsets, and engineering visualisation. Yet 3D gaming and simulation now grows at 30.10% CAGR, powered by volumetric capture pipelines and low-latency GPUs. Unity’s 4D-LRM reconstructs 24-frame sequences in under 1.5 seconds on a single A100, slashing production times for interactive titles.
Military training, medical rehearsal, and e-sports demand photorealistic physics and user-driven storylines, pushing compute budgets toward interactive environments that outshine static panels. As a result, immersive engines enlarge the spending pie and heighten software royalties throughout the 3D and 4D Technology market.


By End-user Industry: Manufacturing Takes the Growth Baton from Healthcare
Healthcare kept 21% revenue in 2024 through patient-specific implants and surgical navigation models. However, industrial and manufacturing users’ clock 27.60% CAGR. Digital twins of factory cells synchronise sensor feedback with simulated line performance, letting engineers swap materials or tool paths virtually before hitting machines. BMW’s digital-twin tie-up with Dassault streamlines cradle-to-gate lifecycles and underpins mass customisation.
The shift redistributes value from bespoke medical procedures toward large-batch industrial deployments, magnifying throughput gains and sustainability targets. Consequently, factory automation becomes a pivotal growth engine for the 3D and 4D Technology market.
Geography Analysis
North America generated 33% of 2024 revenue, anchored by robust VC funding, advanced cloud infrastructure, and early enterprise adoption across aerospace, life sciences, and media. Federal R and D grants, and defence programmes sustain long-term capital flows, ensuring the 3D and 4D Technology market remains embedded in mission-critical projects.
Asia-Pacific is the fastest-growing region at 25.40% CAGR. Beijing’s dark-factory incentives and Tokyo’s infrastructure modernisation fuel equipment demand, while Formnext Asia Shenzhen showcases 68% exhibitor growth in advanced materials. Local champions from Shenzhen to Seoul iterate hardware rapidly, cutting lead times and expanding regional 3D and 4D Technology market size. Government subsidies for Industry 4.0 further integrate additive lines into supply chains.
Europe maintains steady expansion through automotive, aerospace, and green-building projects. The Tor Alva tower in Switzerland, the world’s tallest 3D-printed structure, underscores architectural innovation. Rigorous CE certification pathways and a strong circular-economy agenda drive adoption of recyclable feedstocks, keeping European vendors competitive in the global 3D and 4D Technology market.

Competitive Landscape
The vendor arena is moderately fragmented. Heritage firms defend share via patent portfolios spanning stereoscopy and haptics, while start-ups seize niches like AI toolpaths or bio-inks. Nano Dimension’s acquisitions of Desktop Metal and Markforged expand hybrid capabilities, whereas EOS pairs with 1000 Kelvin to integrate AMAIZE, an AI co-pilot that trims support-structure design by up to 80%.
Interoperability alliances, notably OpenUSD, ease multi-tool workflows and reduce customer lock-in. Parallel moves toward sustainable materials and edge-rendering services diversify revenue. As hardware gross margins erode, vendors double down on software subscriptions, AI diagnostics, and certified materials libraries, widening moats in the 3D and 4D Technology market.
Looking ahead, white space exists in biocompatible polymers, micro-factory leasing models, and regional cloud render farms. Vendors that optimise for reliability, regulatory compliance, and skills enablement stand to consolidate leadership positions as the 3D and 4D Technology industry scales.
3D & 4D Technology Industry Leaders
Samsung Electronics Co., Ltd.
Sony Group Corporation
HP Inc.
Stratasys Ltd.
Dassault Systèmes SE
- *Disclaimer: Major Players sorted in no particular order

Recent Industry Developments
- July 2025: Aeva unveiled Atlas Ultra 4D LiDAR at CES 2025 for automotive and industrial use.
- June 2025: HP and Google Beam launched AI-powered 3D conferencing for hybrid work.
- May 2025: Unity’s “Time Ghost” demo illustrated real-time cloth deformation in 4D assets.
- April 2025: Samsung introduced Eclipsa Audio 3D for its 2025 TV and soundbar range.


Global 3D & 4D Technology Market Report Scope
Technologies harness 3D visuals to craft experiences, whether mirroring reality or venturing into virtual realms. These experiences span from technological overlaps to gadgets that offer full immersion.
4D technology navigates all four traditional dimensions. In physics, while the term predominantly pertains to three-dimensional space (3D), it intriguingly incorporates time as an additional dimension alongside the conventional trio: length, width, and depth.
This study delves deep into the trends and dynamics shaping the 3D and 4D technology market. Market estimates are anchored on revenues generated by leading players from their 3D and 4D solution sales. Additionally, the analysis sheds light on pivotal growth drivers and the overarching influence of macroeconomic factors on the market.
The 3D 4D technology market is segmented by application (electrical & electronic components, 3D display, 3D printer, 3D gaming, other applications), by end -user vertical (healthcare, entertainment & media, education, government, industrial, consumer electronics, construction, other end user industries), and geography (North America, Europe, Asia-Pacific, Latin America, and Middle East and Africa). The market sizes and forecasts are provided in terms of value in USD for all the above segments.
By Component (Value)
| Hardware |
| Software |
| Services |
By Technology (Value)
| 3D Technology |
| 4D Technology |
By Application (Value)
| 3D Display |
| 3D Printers |
| 3D Gaming and Simulation |
| Electrical and Electronic Components |
| Others |
By End-user Industry (Value)
| Healthcare |
| Entertainment and Media |
| Industrial and Manufacturing |
| Education |
| Consumer Electronics |
| Construction and Architecture |
| Others |
By Geography (Value)
| North America | United States |
| Canada | |
| Mexico | |
| Europe | United Kingdom |
| Germany | |
| France | |
| Italy | |
| Rest of Europe | |
| Asia-Pacific | China |
| Japan | |
| India | |
| South Korea | |
| Rest of Asia | |
| Middle East | Israel |
| Saudi Arabia | |
| United Arab Emirates | |
| Turkey | |
| Rest of Middle East | |
| Africa | South Africa |
| Egypt | |
| Rest of Africa | |
| South America | Brazil |
| Argentina | |
| Rest of South America |
| By Component (Value) | Hardware | |
| Software | ||
| Services | ||
| By Technology (Value) | 3D Technology | |
| 4D Technology | ||
| By Application (Value) | 3D Display | |
| 3D Printers | ||
| 3D Gaming and Simulation | ||
| Electrical and Electronic Components | ||
| Others | ||
| By End-user Industry (Value) | Healthcare | |
| Entertainment and Media | ||
| Industrial and Manufacturing | ||
| Education | ||
| Consumer Electronics | ||
| Construction and Architecture | ||
| Others | ||
| By Geography (Value) | North America | United States |
| Canada | ||
| Mexico | ||
| Europe | United Kingdom | |
| Germany | ||
| France | ||
| Italy | ||
| Rest of Europe | ||
| Asia-Pacific | China | |
| Japan | ||
| India | ||
| South Korea | ||
| Rest of Asia | ||
| Middle East | Israel | |
| Saudi Arabia | ||
| United Arab Emirates | ||
| Turkey | ||
| Rest of Middle East | ||
| Africa | South Africa | |
| Egypt | ||
| Rest of Africa | ||
| South America | Brazil | |
| Argentina | ||
| Rest of South America | ||


Key Questions Answered in the Report
What is the current value of the 3D and 4D Technology market?
The market stands at USD 359.8 billion in 2025 and is forecast to reach USD 965.27 billion by 2030.
Which component is expanding fastest within the 3D and 4D Technology market?
Services are growing at a 29.40% CAGR as enterprises prefer outcome-based engagements over hardware purchases.
Why is Asia-Pacific the fastest-growing region?
Aggressive automation in China and infrastructure modernization in Japan is driving a 25.40% regional CAGR.
How does 4D printing differ from conventional 3D printing?
4D printing adds time-responsive materials that alter shape or properties post-production, enabling adaptive aerospace, medical, and consumer applications.
What are the main restraints on market growth?
A global shortage of spatial-computing talent, high equipment TCO for industrial scanners, and patent complexity in haptics slightly dampen the growth trajectory.
Which application area is projected to outpace others by 2030?
3D gaming and simulation is expected to expand at 30.10% CAGR, buoyed by volumetric capture and real-time rendering advances.
Page last updated on:


