
Food Authenticity Market Size and Share
Market Overview
| Study Period | 2021 - 2031 |
|---|---|
| Market Size (2026) | USD 8.82 Billion |
| Market Size (2031) | USD 12.73 Billion |
| Growth Rate (2026 - 2031) | 7.61 % |
| Fastest Growing Market | Asia-Pacific |
| Largest Market | Europe |
| Market Concentration | Medium |
Major Players
*Disclaimer: Major Players sorted in no particular order Image © Mordor Intelligence. Reuse requires attribution under CC BY 4.0. |
|
Food Authenticity Market Analysis by Mordor Intelligence
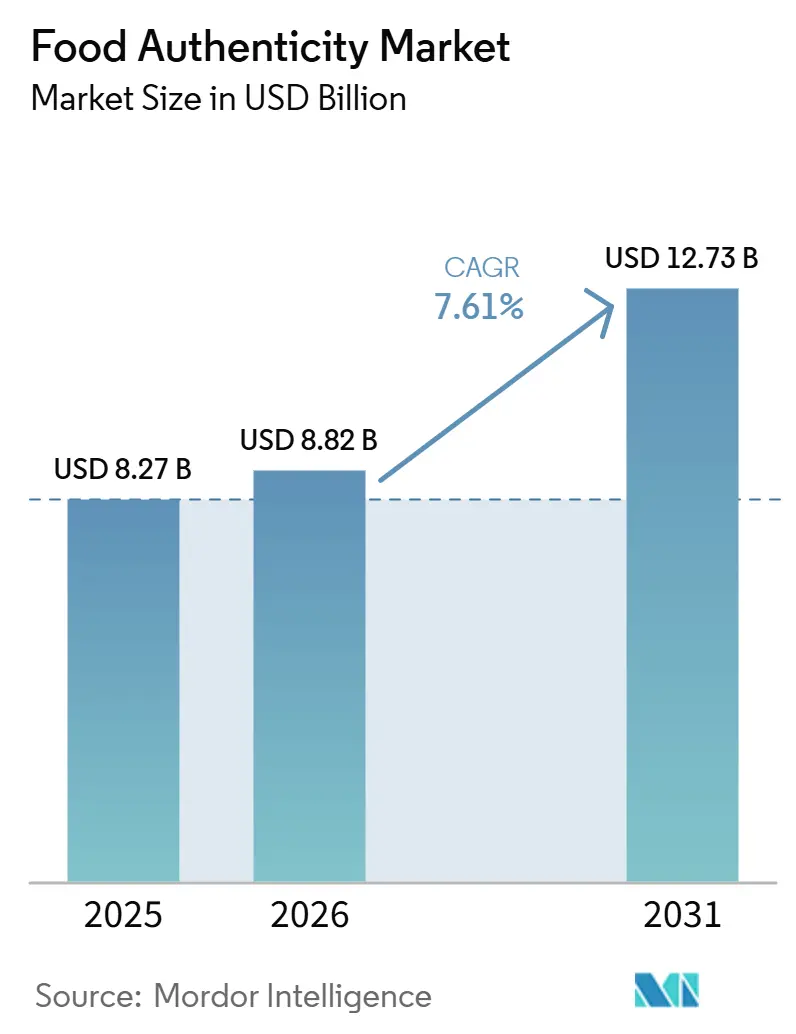
The food authenticity market was valued at USD 8.27 billion in 2025 and is estimated to reach USD 8.82 billion in 2026, projected to grow to USD 12.73 billion by 2031, registering a CAGR of 7.61% during 2026–2031. Market growth is driven by the rising incidence of food fraud and adulteration, increasingly stringent food safety and traceability regulations, and growing consumer demand for transparent ingredient sourcing and verified product origin. The adoption of advanced analytical technologies is further strengthening food authenticity verification across global supply chains. Additionally, the expansion of premium and certified food products, coupled with continuous investments in laboratory infrastructure, molecular diagnostics, and digital provenance solutions, is accelerating the adoption of food authenticity testing worldwide.
Key Report Takeaways
- By target testing, adulteration testing held 39.82% of the food authenticity testing market share in 2025, while country of origin and aging verification is forecast to grow at an 8.55% CAGR through 2031.
- By technology, Polymerase Chain Reaction (PCR) accounted for 34.56% of the food authenticity testing market share in 2025, while Liquid Chromatography-Mass Spectrometry is expected to advance at an 8.87% CAGR through 2031.
- By food category, meat and meat products captured 31.73% of the food authenticity testing market share in 2025, while beverages are projected to register a 9.09% CAGR through 2031.
- By geography, Europe represented 35.64% of the food authenticity testing market share in 2025, while Asia-Pacific is forecast to expand at an 8.13% CAGR through 2031.
Note: Market size and forecast figures in this report are generated using Mordor Intelligence’s proprietary estimation framework, updated with the latest available data and insights as of January 2026.
Global Food Authenticity Market Trends and Insights
Drivers Impact Analysis*
| Driver | (~) % Impact on CAGR Forecast | Geographic Relevance | Impact Timeline |
|---|---|---|---|
| Rising food fraud and adulteration | +1.8% | Global, concentrated incidence in Europe, North America and Asia-Pacific | Short term (≤ 2 years) |
| Stringent food safety and traceability regulations | +1.5% | Europe (EU 2017/625, PDO/PGI), North America (FSMA), Asia-Pacific (China national standards) | Medium term (2–4 years) |
| Growing demand for ingredient transparency | +1.0% | North America and Europe core; spill-over to Asia-Pacific premium segments | Medium term (2–4 years) |
| AI-driven food authentication and digital traceability | +0.9% | Global; early traction in Europe and Asia-Pacific | Medium term (2–4 years) |
| Expansion of premium and certified food products | +0.8% | Europe (PDO/PGI), North America, Asia-Pacific export corridors | Long term (≥ 4 years) |
| Increasing complexity of global food supply chains | +0.7% | Global; pronounced in South America–Europe and Asia-Pacific–North America corridors | Short term (≤ 2 years) |
| Source: Mordor Intelligence | |||
Rising food fraud and adulteration
The increasing incidence of food fraud and adulteration is a key driver of the food authenticity market. Fraudulent practices such as ingredient substitution, dilution, counterfeit labeling, misrepresentation of geographical origin, and the addition of unauthorized substances continue to threaten food safety, product integrity, and consumer trust. As these practices grow in scale and complexity, the demand for reliable authenticity verification across the food supply chain has intensified. In response, food manufacturers, regulatory authorities, certification bodies, and testing laboratories are expanding their adoption of advanced analytical technologies to detect authenticity violations, strengthen supplier verification, ensure compliance with regulatory standards, mitigate reputational and financial risks, and maintain consumer confidence in branded food products.
Stringent food safety and traceability regulations
Stringent food safety and traceability regulations are driving growth in the food authenticity market by requiring food businesses to implement robust verification, documentation, and risk-based monitoring systems throughout the supply chain. Regulatory agencies are strengthening requirements for authenticity testing, supplier verification, and end-to-end traceability to prevent food fraud, improve product integrity, and enhance consumer protection. These evolving compliance requirements are encouraging food manufacturers and testing laboratories to invest in advanced authentication technologies and traceability solutions. For instance, in the United States, the Food Safety Modernization Act (FSMA) requires food facilities to conduct vulnerability assessments for economically motivated adulteration under the Intentional Adulteration Rule and implement mitigation strategies for identified vulnerabilities, reinforcing the need for routine food authenticity testing and comprehensive traceability systems [1]Source: Food and Drug Administration, "FSMA Final Rule for Mitigation Strategies to Protect Food Against Intentional Adulteration", fda.gov.
Growing demand for ingredient transparency
Growing demand for ingredient transparency is a significant driver of the food authenticity market, as consumers increasingly seek clear, verifiable information about the origin, composition, and sourcing of food products. This shift is encouraging food manufacturers to strengthen supply chain visibility, improve product traceability, and adopt scientifically validated authenticity testing to support label claims. Regulatory pressure and high-profile food fraud incidents have further accelerated this trend, pushing companies to demonstrate greater accountability across their supply chains. In response, companies are investing in digital traceability platforms, ingredient verification systems, and advanced analytical technologies such as DNA-based testing, isotope analysis, and spectroscopy to improve transparency, build consumer trust, and differentiate their products in a quality-conscious market.
AI-driven food authentication and digital traceability
The integration of artificial intelligence (AI) and digital traceability technologies is emerging as a key driver of the food authenticity market. These technologies enable real-time monitoring, rapid fraud detection, and end-to-end visibility across complex food supply chains. AI-powered analytics, combined with digital provenance records and traceability platforms, allow food businesses and regulatory authorities to identify anomalies, verify product authenticity, strengthen supplier oversight, and improve the speed and accuracy of authenticity investigations. For instance, in March 2026, the European Commission launched TraceMap, an AI-powered traceability platform designed to help authorities detect food fraud, contaminated food, and potential foodborne illness outbreaks more rapidly across Europe. The platform uses AI-driven data analysis and digital traceability to strengthen food authenticity verification and accelerate regulatory response, further driving the adoption of advanced food authentication solutions.
Restraints Impact Analysis*
| Restraint | (~) % Impact on CAGR Forecast | Geographic Relevance | Impact Timeline |
|---|---|---|---|
| High costs of advanced authenticity testing | -0.7% | Asia-Pacific core, South America; affects SME manufacturers globally | Short term (≤ 2 years) |
| Lack of standardized global authentication protocols | -0.5% | Global; most acute in cross-border Europe–Asia-Pacific–North America trade | Long term (≥ 4 years) |
| Complexity of multi-tier supply chain verification | -0.6% | Global; pronounced in South America–Europe and Asia-Pacific–North America corridors | Medium term (2–4 years) |
| Lengthy testing and product release timelines | -0.4% | North America and Europe (high-throughput manufacturing) | Short term (≤ 2 years) |
| Source: Mordor Intelligence | |||
High costs of advanced authenticity testing
The high cost of advanced food authenticity testing remains a significant restraint on market growth. Sophisticated analytical technologies require substantial investments in specialized laboratory infrastructure, high-precision instruments, reference materials, and ongoing maintenance. Beyond capital expenditure, operational costs associated with method validation, equipment calibration, skilled personnel, and quality assurance further increase the overall cost of authenticity testing. These financial barriers can limit the adoption of advanced testing solutions, particularly among small and medium-sized food manufacturers and regional testing laboratories with constrained budgets. As a result, many smaller market participants may resort to less comprehensive testing methods, potentially undermining the reliability of food authenticity verification across the supply chain.
Lack of standardized global authentication protocols
The absence of standardized global authentication protocols is a key restraint for the food authenticity market. Differences in testing methodologies, reference materials, regulatory requirements, and acceptance criteria across countries create inconsistencies in authenticity verification. Without globally harmonized protocols, comparing analytical results between laboratories is difficult, cross-border compliance becomes more complex, and food manufacturers often need to perform multiple tests to meet varying regulatory and customer requirements. This lack of uniformity increases operational costs, extends certification timelines, and limits the scalability of food authenticity programs across international supply chains. Until regulatory bodies and industry stakeholders align on common standards, these inefficiencies will continue to hinder market growth and undermine confidence in cross-border food authenticity assurance.
*Our forecasts treat driver/restraint impacts as directional, not additive. The impact forecasts reflect baseline growth, mix effects, and variable interactions.
Segment Analysis
By Target Testing: Adulteration Testing Anchors Volume, Origin Verification Gains Momentum
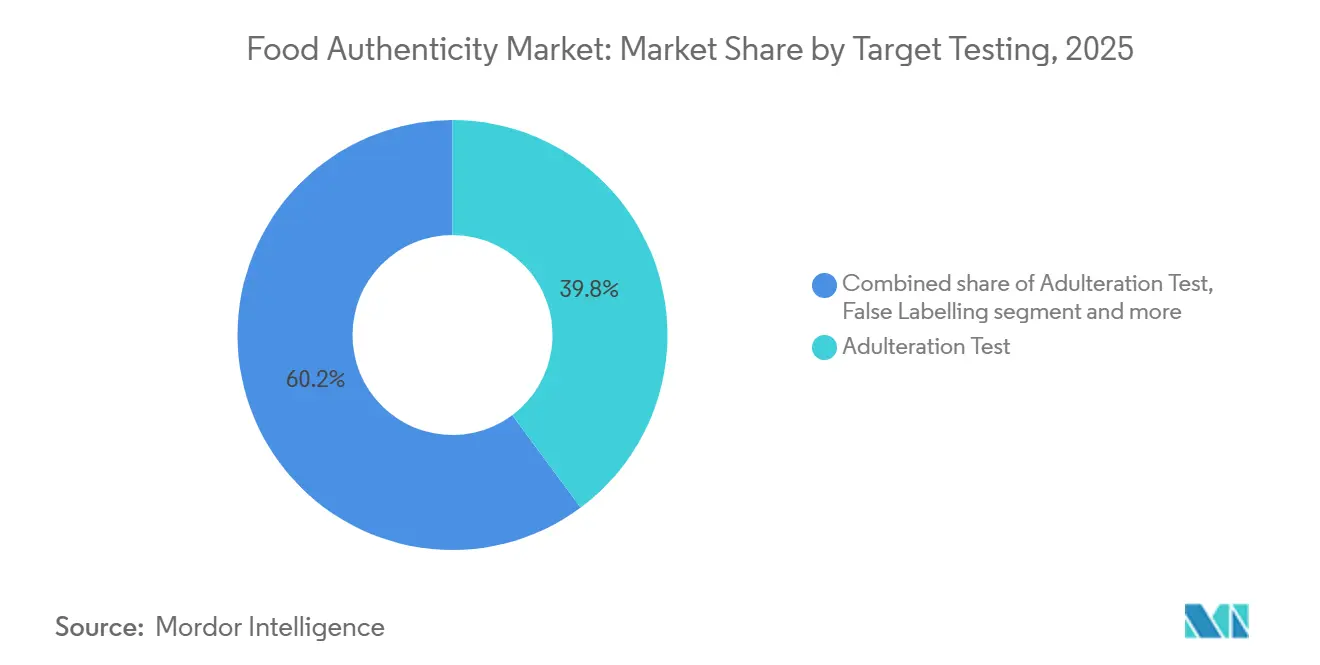
Adulteration tests held a 39.82% share of the target testing segment in 2025, owing to their essential role in preserving food integrity and supporting risk-based quality assurance across the supply chain. Manufacturers are increasingly conducting routine authenticity verification to identify unauthorized substitutions, contaminants, and quality deviations before products reach the market. The segment is further supported by active regulatory enforcement against food fraud, which continues to drive demand for laboratory-based authenticity testing. For instance, in 2025, the United Kingdom's National Food Crime Unit issued two food crime alerts targeting document fraud in laboratory certificates and dye-adulterated saffron, highlighting the continued regulatory focus on adulteration detection and reinforcing the need for ongoing authenticity testing [2]Source: Government of the United Kingdom, "National Food Crime Unit (NFCU)", gov.uk.
Country of origin and aging verification is projected to register the fastest CAGR of 8.55% through 2031, driven by the growing importance of provenance verification and production history in the global food supply chain. Food businesses are strengthening origin documentation and age verification processes to improve supply chain transparency, support product differentiation, and ensure consistency between declared and actual product attributes. The growing adoption of digital traceability platforms, blockchain-enabled provenance records, and scientific origin verification techniques is further accelerating demand for country of origin and aging verification as part of comprehensive food authenticity programs.



By Technology: PCR Delivers Scale, LC-MS Unlocks Complexity
Polymerase Chain Reaction (PCR) technology accounted for 34.56% of the technology segment in 2025, owing to its high accuracy, reproducibility, and ability to deliver reliable authenticity results across diverse food matrices. The technology has become a preferred analytical method due to its standardized testing protocols, rapid turnaround times, and compatibility with regulatory quality assurance requirements. Continuous improvements in molecular testing workflows, laboratory automation, and high-throughput analysis have further strengthened PCR adoption, enabling food testing laboratories to efficiently process large sample volumes while maintaining consistent analytical performance.
Liquid Chromatography-Mass Spectrometry (LC-MS) is projected to register the fastest CAGR of 8.87% through 2031, owing to its exceptional analytical sensitivity and ability to simultaneously identify and quantify a wide range of chemical compounds with high precision. The technology is increasingly adopted as food authenticity assessments require more comprehensive profiling of complex food matrices and detection of trace-level compositional differences. Continuous advancements in high-resolution instrumentation, automated workflows, and data processing capabilities are further enhancing testing efficiency, enabling laboratories to deliver faster, more accurate, and reproducible authenticity analyses.
By Food Category: Meat Testing Sustains Leadership, Beverages Accelerate
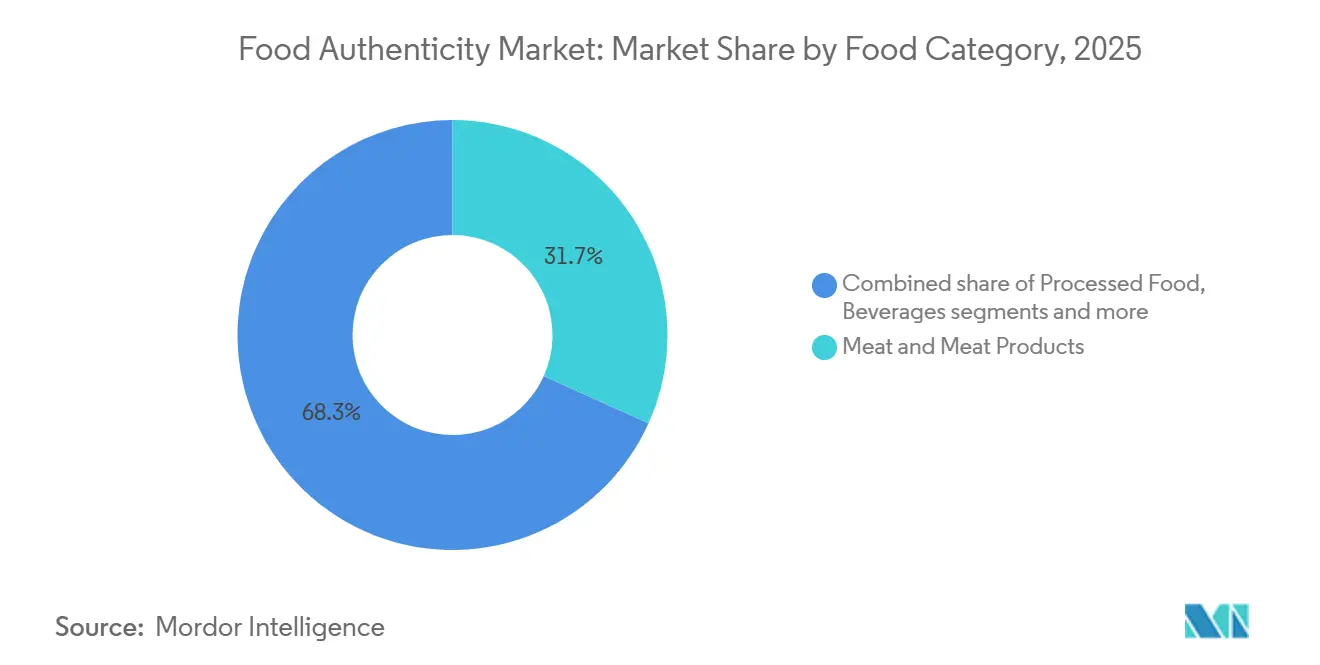
Meat and meat products accounted for 31.73% of the food category segment in 2025, owing to stringent authenticity requirements associated with complex animal protein supply chains and multi-stage processing operations. The category requires continuous verification to ensure declared product composition, ingredient integrity, and compliance with quality standards from raw material procurement through final production. The widespread implementation of risk-based quality management systems, supplier verification programs, and routine laboratory surveillance has made authenticity testing an integral part of meat quality assurance. Additionally, the availability of well-established molecular and analytical testing methods enables reliable and reproducible verification, reinforcing the category's dominant position within the food authenticity market.
Beverages are projected to register the fastest CAGR of 9.09% through 2031, driven by the increasing adoption of advanced analytical technologies capable of detecting subtle compositional differences, ingredient substitutions, and formulation inconsistencies in complex liquid matrices. The segment is benefiting from continuous improvements in high-resolution analytical instrumentation, enabling faster and more precise authenticity assessments while supporting evolving quality assurance and traceability requirements. Cross-category advancements in food authentication are also accelerating innovation within beverage testing. For instance, the European Union coordinated honey adulteration investigations using Liquid Chromatography–High Resolution Mass Spectrometry (LC-HRMS) to detect sugar syrup additions, and the analytical methodologies developed through these initiatives are increasingly being adapted to authenticate high-value beverage products.
Geography Analysis
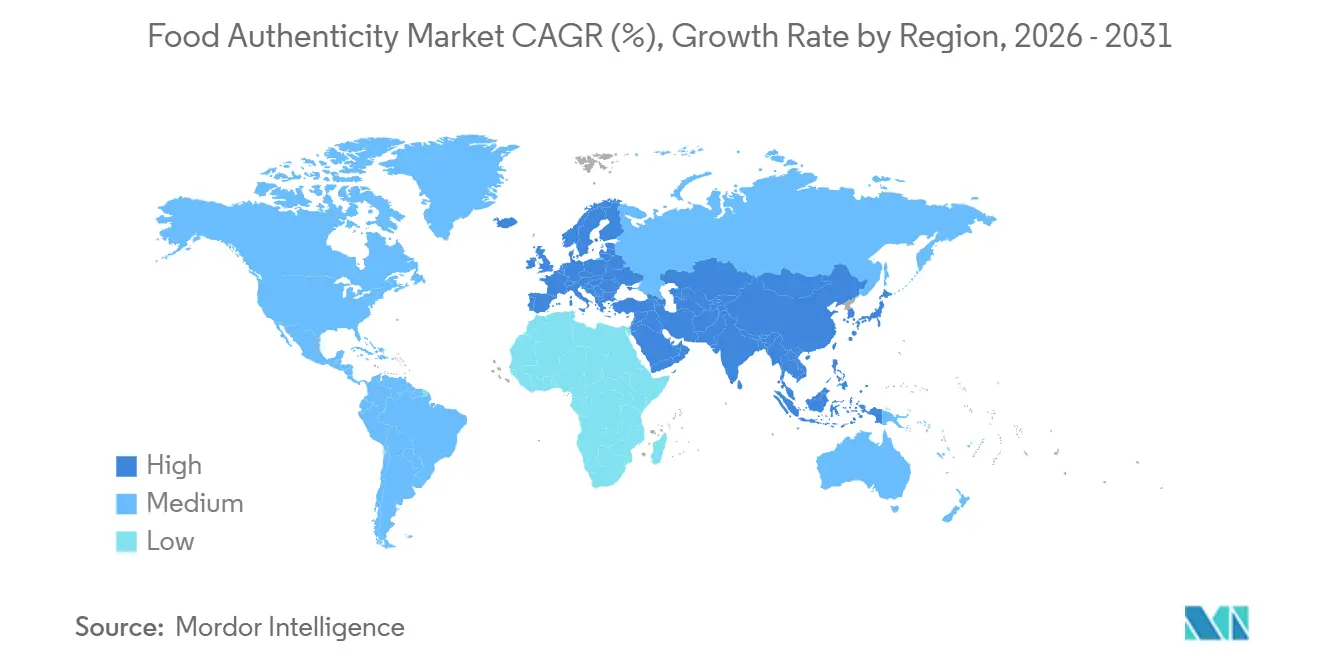
Europe held a 35.64% share of the global food authenticity market in 2025, supported by one of the world's most comprehensive food safety and authenticity regulatory frameworks, mature laboratory infrastructure, and strong collaboration between regulatory authorities, research institutions, and accredited testing laboratories. The region has established rigorous surveillance programs, standardized analytical methodologies, and continuous monitoring mechanisms that drive routine authenticity verification across the food supply chain. Ongoing investments in advanced analytical technologies, digital traceability systems, and harmonized testing protocols continue to strengthen Europe's position in food authenticity testing and fraud prevention.
Asia-Pacific is projected to register the fastest CAGR of 8.13% through 2031, driven by the rapid modernization of food safety systems, expansion of accredited testing infrastructure, and strengthening of national food quality standards across the region. Governments are continuously introducing updated regulatory requirements and expanding laboratory capabilities to improve food authenticity verification and supply chain transparency. The increasing adoption of advanced molecular and analytical testing technologies, coupled with greater regulatory oversight, is accelerating market growth. For instance, on March 27, 2025, China's National Health Commission (NHC) officially issued 50 new national food safety standards, further strengthening the country's regulatory framework and increasing demand for food authenticity testing and compliance services [3]Source: National Health Commission (NHC), "NHC/SAMR announces 50 new food standards", nhc.gov.cn.
North America remains a mature market characterized by widespread adoption of advanced analytical technologies, well-established accreditation systems, and continuous investment in next-generation food authentication solutions. South America and the Middle East & Africa currently represent smaller shares of the global market but are expected to witness above-average long-term growth. The expansion of food safety regulations, increasing establishment of accredited testing laboratories, modernization of quality control infrastructure, and growing alignment with international food authenticity standards are driving market development across these regions.

Competitive Landscape
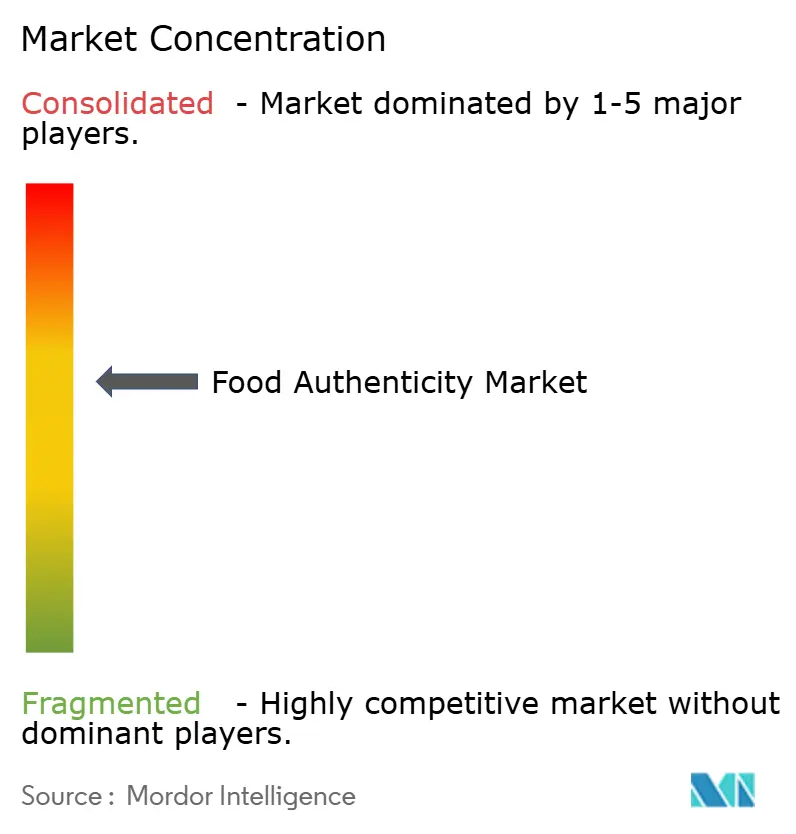
The global food authenticity market is moderately consolidated, with a mix of global testing, inspection, and certification (TIC) companies and analytical technology firms competing on laboratory networks, technical expertise, regulatory compliance capabilities, and service portfolios. Key players such as Eurofins Scientific SE, SGS SA, Intertek Group plc, Thermo Fisher Scientific Inc., and ALS Limited have established strong market positions through extensive accredited laboratory networks, advanced analytical technologies, and broad geographic presence. Competition is increasingly focused on expanding testing capabilities, strengthening digital traceability solutions, enhancing laboratory automation, and meeting evolving global food authenticity regulations.
A key area of competitive differentiation is the intersection of blockchain-enabled traceability and accredited laboratory testing. No market participant has yet established a fully integrated, internationally standardized solution that combines end-to-end digital provenance with laboratory-verified authenticity data. As food manufacturers seek greater supply chain transparency and real-time verification, this gap presents a significant opportunity for companies to differentiate through integrated authenticity platforms that combine digital traceability, analytical testing, and regulatory compliance.
Beyond broad testing portfolios, companies are also pursuing specialized market positions to strengthen their competitive advantage. Several players differentiate themselves through expertise in GMO testing, rapid mycotoxin detection, certified reference material development, advanced molecular diagnostics, and food industry research and development (R&D) testing services. Investments in high-resolution analytical technologies, automation, AI-enabled data interpretation, and customized authenticity solutions are enabling companies to address evolving customer requirements while expanding their presence across high-value food authentication applications.
Food Authenticity Industry Leaders
-
Eurofins Scientific SE
-
SGS SA
-
Intertek Group plc
-
Thermo Fisher Scientific Inc.
-
ALS Limited
- *Disclaimer: Major Players sorted in no particular order

Recent Industry Developments
- March 2026: SGS launched SGS Nexus, a new global food intelligence platform created by integrating its regulatory intelligence solution, SGS Digicomply, with Agroknow, a provider of food safety analytics and AI-driven risk intelligence.
- November 2025: Intertek Group plc acquired Suplilab, a provider of food safety and medical device testing services based in San José, Costa Rica. Suplilab is an ATIC provider with an established market position and a track record of growth in high-margin segments.
- October 2025: Thermo Fisher Scientific introduced the Thermo Scientific Orbitrap Exploris EFOX Mass Detector, a high-resolution accurate mass (HRAM) Orbitrap system designed specifically for environmental and food safety laboratories.


Global Food Authenticity Market Report Scope
The food authenticity market refers to the global industry of testing and tracking food products to ensure they are genuine, accurately labeled, and free from adulteration. The food authenticity market is segmented by target testing, technology, food category, and geography. Based on target testing, the market is segmented into meat speciation, country of origin and aging, adulteration test, and false labelling. Based on technology, the market is segmented into polymerase chain reaction (PCR), liquid chromatography-mass spectrometry, isotope ratio mass spectrometry, immunoassay-based/ELISA (enzyme-linked immunosorbent assay), and others. Based on food category, the market is segmented into meat and meat products, dairy and dairy products, cereals, grains, and pulses, processed food, beverages, seafood, and others. Based on geography, the market is segmented into North America, Europe, Asia-Pacific, South America, and Middle East and Africa. For each segment, the market sizing and forecast have been done based on the value (in USD million).
| Meat Speciation |
| Country of Origin and Aging |
| Adulteration Test |
| False Labelling |
| Polymerase Chain Reaction (PCR) |
| Liquid Chromatography-Mass Spectrometry |
| Isotope Ratio Mass Spectrometry |
| Immunoassay-Based/Elisa (Enzyme-Linked Immunosorbent Assay) |
| Others |
| Meat and Meat Products |
| Dairy and Dairy Products |
| Cereals, Grains, and Pulses |
| Processed Food |
| Beverages |
| Seafood |
| Others |
| North America | United States |
| Canada | |
| Mexico | |
| Rest of North America | |
| Europe | United Kingdom |
| Germany | |
| France | |
| Italy | |
| Spain | |
| Netherlands | |
| Poland | |
| Belgium | |
| Sweden | |
| Rest of Europe | |
| Asia-Pacific | China |
| Japan | |
| India | |
| Australia | |
| Indonesia | |
| South Korea | |
| Thailand | |
| Singapore | |
| Rest of Asia-Pacific | |
| South America | Brazil |
| Argentina | |
| Colombia | |
| Chile | |
| Peru | |
| Rest of South America | |
| Middle East and Africa | South Africa |
| Saudi Arabia | |
| United Arab Emirates | |
| Nigeria | |
| Egypt | |
| Morocco | |
| Turkey | |
| Rest of Middle East and Africa |
| By Target Testing | Meat Speciation | |
| Country of Origin and Aging | ||
| Adulteration Test | ||
| False Labelling | ||
| By Technology | Polymerase Chain Reaction (PCR) | |
| Liquid Chromatography-Mass Spectrometry | ||
| Isotope Ratio Mass Spectrometry | ||
| Immunoassay-Based/Elisa (Enzyme-Linked Immunosorbent Assay) | ||
| Others | ||
| By Food Category | Meat and Meat Products | |
| Dairy and Dairy Products | ||
| Cereals, Grains, and Pulses | ||
| Processed Food | ||
| Beverages | ||
| Seafood | ||
| Others | ||
| By Geography | North America | United States |
| Canada | ||
| Mexico | ||
| Rest of North America | ||
| Europe | United Kingdom | |
| Germany | ||
| France | ||
| Italy | ||
| Spain | ||
| Netherlands | ||
| Poland | ||
| Belgium | ||
| Sweden | ||
| Rest of Europe | ||
| Asia-Pacific | China | |
| Japan | ||
| India | ||
| Australia | ||
| Indonesia | ||
| South Korea | ||
| Thailand | ||
| Singapore | ||
| Rest of Asia-Pacific | ||
| South America | Brazil | |
| Argentina | ||
| Colombia | ||
| Chile | ||
| Peru | ||
| Rest of South America | ||
| Middle East and Africa | South Africa | |
| Saudi Arabia | ||
| United Arab Emirates | ||
| Nigeria | ||
| Egypt | ||
| Morocco | ||
| Turkey | ||
| Rest of Middle East and Africa | ||


Key Questions Answered in the Report
What is the projected size of the food authenticity testing market by 2031?
The food authenticity testing market is projected to reach USD 12.73 billion by 2031, rising from USD 8.82 billion in 2026 at a 7.61% CAGR.
Which testing type holds the largest share of food authenticity testing demand?
Adulteration testing held the largest share, accounting for 39.82% of the target testing segment in 2025.
Which food authenticity testing technology is growing fastest?
LC-MS is the fastest-growing technology, with an expected CAGR of 8.87% through 2031, supported by its use in processed and cooked food analysis.
Which food category requires the most authenticity testing?
Meat and meat products led the food category segment with a 31.73% share in 2025 due to species substitution risks and regulatory scrutiny.
Page last updated on:





