Europe Feed Mycotoxin Detoxifiers Market Size and Share
Market Overview
| Study Period | 2021 - 2031 |
|---|---|
| Forecast Data Period | 2026 - 2031 |
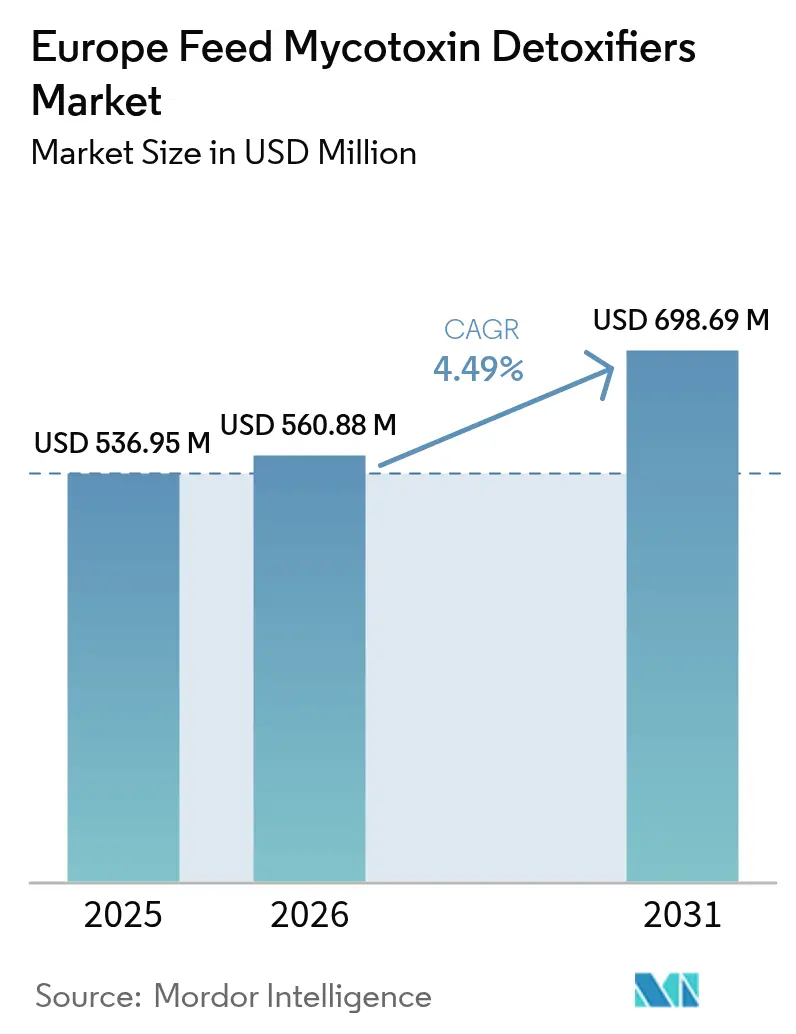
| Base Year Market Size (2025) | USD 536.95 Million |
| Market Size (2026) | USD 560.88 Million |
| Market Size (2031) | USD 698.69 Million |
| Growth Rate (2026 - 2031) | 4.49% CAGR |
| Market Concentration | Medium |
Major Players
*Disclaimer: Major Players sorted in no particular order Image © Mordor Intelligence. Reuse requires attribution under CC BY 4.0. |
|
Europe Feed Mycotoxin Detoxifiers Market Analysis by Mordor Intelligence
The Europe feed mycotoxin detoxifiers market size is projected to be USD 536.95 million in 2025, USD 560.88 million in 2026, and reach USD 698.69 million by 2031, growing at a CAGR of 4.49% from 2026 to 2031. Rising climate-linked volatility in grain quality, stricter European Union feed-safety regulations, and the livestock industry’s pivot toward antibiotic-free production have combined to expand demand for binder- and enzyme-based detoxification products. Poultry integrators remain highly sensitive to aflatoxin and deoxynivalenol risks, while swine producers are addressing zearalenone-driven reproductive losses. Technology partnerships that embed real-time mycotoxin scoring into formulation software are reshaping procurement decisions, and vertical integration into clay mineral mining is lowering raw-material risk for leading suppliers. Suppliers that pair validated efficacy data with digital advisory services are projected to gain share as compound feed mills adopt risk-stratified dosing models.
Key Report Takeaways
- By sub-additive, binders led with 66.4% of the Europe feed mycotoxin detoxifiers market share in 2025, while biotransformers are forecast to record the fastest 4.5% CAGR through 2031 within the market.
- By animal, poultry accounted for 34.9% of the Europe feed mycotoxin detoxifiers market size in 2025, and swine usage is projected to expand at the highest 4.8% CAGR between 2026 and 2031.
- By geography, Spain captured 15.4% of the market revenue in 2025, while the United Kingdom is set to grow at a leading 5.4% CAGR to 2031.
- DSM-Firmenich AG, Cargill, Incorporated, BASF SE, Brenntag SE, and Adisseo SAS (China National Bluestar (Group) Co, Ltd.) accounted for significant revenue in the Europe feed mycotoxin detoxifiers market in 2025.
Note: Market size and forecast figures in this report are generated using Mordor Intelligence’s proprietary estimation framework, updated with the latest available data and insights as of 2026.
Europe Feed Mycotoxin Detoxifiers Market Trends and Insights
Drivers Impact Analysis*
| Driver | (~) % Impact on CAGR Forecast | Geographic Relevance | Impact Timeline |
|---|---|---|---|
| Rising incidence of mycotoxin contamination in European grain supply | +1.0% | France, Germany, Poland, and Spain | Medium term (2-4 years) |
| Strict regulations on feed safety and allowable mycotoxin levels | +0.7% | European Union-27, United Kingdom, and Norway | Long term (≥ 4 years) |
| Increasing adoption of precision livestock farming enabling targeted use of detoxifiers | +0.5% | Netherlands, Denmark, Germany, and Belgium | Medium term (2-4 years) |
| Demand for antibiotic-free meat pushing integrators toward non-antibiotic feed safety solutions | +0.6% | European Union-27, United Kingdom, and Switzerland | Long term (≥ 4 years) |
| Climate-induced grain quality volatility elevating seasonal toxin risk | +0.8% | Central and Eastern Europe, and Iberian Peninsula | Short term (≤ 2 years) |
| Post-harvest grain storage digitization enabling earlier toxin detection | +0.3% | France, Germany, Netherlands, and Poland | Medium term (2-4 years) |
| Source: Mordor Intelligence | |||


Rising Incidence of Mycotoxin Contamination in European Grain Supply
Fusarium toxin contamination in European grains remains a significant concern, with nearly half of wheat crops intended for human consumption containing detectable levels of mycotoxins. These toxins are produced by the Fusarium genus, primarily during Fusarium Head Blight (FHB) infections, which are encouraged by warm and humid conditions during the flowering stage. Extended humidity during flowering in northern France, western Germany, and Poland fueled the surge, and climate models point to more frequent recurrences. Compound feed mills increased detoxifier inclusion, boosting demand for premium aluminosilicates that do not impair amino acid bioavailability. Although the 2025 harvest showed modest improvement, 14% of Spanish and Italian maize samples exceeded European Union aflatoxin guidance, compelling poultry integrators to specify binders with over 90% aflatoxin-binding efficacy[1]Source: European Commission, “Commission Regulation 2023/915,” ec.europa.eu. Ongoing European Food Safety Authority assessments of emerging toxins such as enniatins are projected to expand the addressable customer base for broad-spectrum detoxifiers.
Strict Regulations on Feed Safety and Allowable Mycotoxin Levels
Commission Regulation 2023/915 set the maximum aflatoxin B1 level in complete dairy feed at 5 micrograms per kilogram and introduced tighter deoxynivalenol guidance, making detoxifier use routine when grain exceeds 900 micrograms per kilogram. Enforcement varies, including Dutch and Danish inspectors conducting unannounced feed-mill audits, while oversight in southern and eastern member states is looser. This asymmetry produces a two-tier market, with northern producers paying premiums for fully certified detoxifiers. The United Kingdom maintained European limits after Brexit but shortened approval timelines for novel enzymes, attracting new product launches[2]Source: United Kingdom Food Standards Agency, “Mycotoxins in Animal Feed,” food.gov.uk. Certification schemes such as Good Manufacturing Practice Plus increasingly oblige mills to document mycotoxin controls, reinforcing structural demand for detoxifiers.
Increasing Adoption of Precision Livestock Farming Enabling Targeted Use of Detoxifiers
By 2025, sensor-based intake monitoring on Dutch and Danish pig and poultry farms will enable correlating toxin load with animal performance and adjusting detoxifier doses. This technology will allow farmers to optimize feed quality and animal health by providing precise data on toxin levels and their impact on productivity. In Germany, blockchain pilots in poultry supply chains are linking grain laboratory data to feed-mill dosing, providing traceable and retailer-ready records. These pilots enhance transparency and accountability across the supply chain, ensuring compliance with quality standards. Algorithms integrated into least-cost formulation software balance the premium for cleaner grain with the cost of higher detoxifier inclusion, leading to the commoditization of basic clays and an increased preference for differentiated enzymes with documented benefits. This approach supports cost-effective feed formulation while maintaining high performance and safety standards.
Demand for Antibiotic-Free Meat Pushing Integrators Toward Non-Antibiotic Feed-Safety Solutions
Antibiotic usage in European meat production has significantly declined over the past decade, driven by strict regulatory frameworks. In 2022, veterinary antimicrobial consumption in food-producing animals decreased by 28% compared to 2018. Member States must continue efforts to further reduce antimicrobial use in farmed animals and aquaculture by an additional 22%. Total sales of veterinary antimicrobials have shown a similar downward trend during this period[3]Source: European Environment Agency, "Antimicrobial consumption by food-producing animals in the EU (Indicator)," eea.europa.eu. Mycotoxin exposure compromises intestinal barriers and immune function, increasing disease risks in low-antibiotic systems. In 2025, Spanish pork producers supplying the Italian cured-meat market adopted zearalenone-specific enzymes after corn contamination negatively impacted farrowing rates. The European Commission's Farm to Fork strategy, which aims to reduce antimicrobial use by 50% by 2030, supports long-term growth for detoxifiers as non-pharmaceutical alternatives.
Restraints Impact Analysis*
| Restraint | (~) % Impact on CAGR Forecast | Geographic Relevance | Impact Timeline |
|---|---|---|---|
| Volatility in raw-material prices inflating cost of premium toxin binders | -0.6% | European Union-27, United Kingdom, and Turkey | Short term (≤ 2 years) |
| Competition from alternative feed-safety technologies | -0.4% | Netherlands, Germany, Denmark, and Belgium | Medium term (2-4 years) |
| Perceived nutrient-binding side-effects at high inclusion levels reducing adoption | -0.3% | Spain, Italy, Poland, and Romania | Long term (≥ 4 years) |
| Limited efficacy data under commercial farm conditions leading to buyer skepticism | -0.5% | Eastern Europe, and Iberian Peninsula | Medium term (2-4 years) |
| Source: Mordor Intelligence | |||
Volatility in Raw-Material Prices Inflating Cost of Premium Toxin Binders
Bentonite and sepiolite prices increased due to gas-intensive activation processes and disruptions in Mediterranean freight, which strained supply. These price increases were further exacerbated by rising energy costs and logistical challenges in key production regions. Prices for yeast cell-wall extracts rose as cutbacks in the brewery sector reduced availability, driven by declining beer production and shifts in consumer preferences. Smaller detoxifier producers without vertical integration in clay mining passed on higher costs, leading mills in Central and Eastern Europe to reduce inclusion rates or shift to commodity binders, potentially compromising protection. This shift has raised concerns about the long-term efficacy of detoxifiers in maintaining feed safety standards.
Competition from Alternative Feed-Safety Technologies
Organic acids, essential oils, and immune modulators, which fall under the broader feed-safety additive category, often overlap with detoxifier value propositions. Dutch integrators are increasingly combining low-dose binders with acid blends, thereby reducing detoxifier volumes. Enzymes that enhance nutrient digestibility mitigate performance losses caused by mild toxin exposure, while beta-glucans support immunity. This compels detoxifier suppliers to demonstrate incremental returns through farm-level trials, emphasizing the need for robust data to validate their effectiveness. The integration of these additives highlights a shift towards more comprehensive feed safety strategies that address both toxin management and overall animal health.
*Our forecasts treat driver/restraint impacts as directional, not additive. The impact forecasts reflect baseline growth, mix effects, and variable interactions.
Segment Analysis
By Sub-Additive: Binders Dominate while Biotransformers Accelerate
Binders are the largest sub-additive type and controlled 66.4% of the Europe feed mycotoxin detoxifiers market share in 2025, largely due to the affordability and broad adsorption spectrum of bentonite and zeolite. Typical prices ranged from USD 1.20 to USD 2.80 per kilogram, allowing inclusion rates near 1 kilogram per metric ton without material feed-cost escalation. However, limited efficacy against zearalenone and fumonisin is prompting integrators to turn to yeast cell-wall extracts that complement clay performance. Activated-carbon binders remain a high-value niche in broiler and aquaculture diets that are vulnerable to aflatoxin contamination.
Biotransformers are set to post a 4.5% CAGR, the fastest in the Europe feed mycotoxin detoxifiers market, as enzyme-based products such as fumonisin carboxylesterases degrade toxins irreversibly at doses below 200 grams per metric ton. Commercial launches by DSM-Firmenich AG and BASF SE in 2024 and 2025 command premium prices while avoiding nutrient binding, which aligns with feed-formulation models that optimize trace-mineral use. Microbial detoxifiers combining Lactobacillus strains with probiotic benefits are emerging, though European Union approvals remain time-consuming.


By Animal: Poultry Remains the Largest User while Swine Leads Growth
Poultry was the largest animal type, accounting for 34.9% of the Europe feed mycotoxin detoxifiers market size in 2025, because layers and broilers are highly susceptible to aflatoxin-induced liver impairment and deoxynivalenol-driven feed refusal. Broiler integrators in Spain, France, and Poland raised binder inclusion after contaminated imported corn reached port in 2025. Egg producers additionally manage aflatoxin M1 carryover risks, further anchoring steady demand.
Swine demand is projected to expand at a 4.8% CAGR through 2031 for the Europe feed mycotoxin detoxifiers market. Zearalenone’s estrogenic effects on sow fertility and fumonisin’s organ toxicity in finisher pigs compel multi-toxin mitigation. Spanish pork herds targeting antibiotic-free labels adopted zearalenone-specific enzymes in 2025, reporting farrowing recovery within one production cycle. Aquaculture still represents a small segment, but it is gaining attention as salmon feed formulations incorporate more plant proteins, thereby heightening exposure to aflatoxins and deoxynivalenol.

Geography Analysis
Spain is the largest geography accounting for 15.4% of the European feed mycotoxin detoxifiers market share in 2025. Spain accounted for the largest share of Europe's sheep meat production in 2024, at 26.6% (98,500 metric tons). This highlights Spain's significant role in the EU sheep meat market, reflecting its strong production capabilities and its contribution to the region's overall supply, which required sizable compound feed volumes. Heavy reliance on imported corn increases the risks of aflatoxins and fumonisins, prompting Spanish mills to install rapid-test kits at ports and to integrate toxin-risk scores into feed-formulation software. Precision nutrition programs that dynamically adjust binder or enzyme doses are becoming standard practice among integrated producers.
The United Kingdom is forecast to be the fastest-growing national market at a 5.4% CAGR to 2031. Post-Brexit regulatory flexibility has shortened approval cycles for novel biotransformers and spurred domestic investment in infrastructure for mycotoxin risk management. Central and Eastern European countries such as Poland and Romania are catching up as European Union accession requirements toughen feed-safety compliance.
Germany and France together represented a significant market demand. German integrators adopted blockchain tools that tether grain test certificates to detoxifier prescriptions, producing transparent supply-chain records that meet retailer due diligence rules. French feed manufacturers increased purchases of detoxifiers after the 2024 wheat crop showed elevated levels of deoxynivalenol, yet intense supplier competition capped price growth. The Netherlands and Denmark, while smaller in absolute volume, maintain some of the highest per-animal detoxifier usage rates due to stringent feed-safety enforcement and widespread precision livestock technologies.
Competitive Landscape
The market is moderately fragmented, with the top five players, DSM-Firmenich AG, Cargill, Incorporated, BASF SE, Brenntag SE, and Adisseo SAS (China National Bluestar (Group) Co, Ltd.), accounting for significant revenue in the Europe feed mycotoxin detoxifiers market in 2025. The companies leverage research scale, mine integration, and broad distribution to price multi-component blends that unite clay, yeast cell wall, and organic acid technologies. These firms also invest in digital advisory platforms, embedding toxin-risk algorithms directly into customers’ formulation software, thereby strengthening client lock-in.
Regional specialists such as Olmix Société Anonyme and Impextraco NV differentiate through marine-derived aluminosilicates and fermentation metabolites tailored to organic and antibiotic-free programs. Strategic moves include long-term agreements with bentonite and zeolite mines in Greece that secure supply amid commodity swings, and collaborations with precision-farming startups that deliver real-time toxin-risk dashboards. New entrants focus on single-toxin enzymes for ochratoxin A or T-2 toxin, but high development costs and European Food Safety Authority regulatory hurdles temper speed to market.
Competition is increasing from alternative feed-safety technologies. Organic acid suppliers emphasize pathogen-control benefits that partially overlap with those of detoxifiers, while probiotic manufacturers promote immune-support benefits that mitigate the effects of toxins. These alternative technologies are gaining traction as they address overlapping concerns in feed safety and animal health. Suppliers offering proven efficacy through large-scale field data and integrated laboratory testing services are better positioned to secure procurement tenders from evidence-focused integrators in Northern Europe.
Europe Feed Mycotoxin Detoxifiers Industry Leaders
-
DSM-Firmenich AG
-
Cargill, Incorporated
-
BASF SE
-
Brenntag SE
-
Adisseo SAS (China National Bluestar (Group) Co, Ltd.)
- *Disclaimer: Major Players sorted in no particular order


Recent Industry Developments
- December 2024: BASF SE has opened its new Catalyst Development and Solids Processing Center in Ludwigshafen, Germany, marking a substantial investment in advanced research and development infrastructure. The facility is dedicated to pilot-scale synthesis of chemical catalysts, facilitating the transition from laboratory to production and advancing solids-processing technologies.
- March 2024: Cargill, Incorporated, presented new research at the World Mycotoxin Forum and introduced the Mycotoxin Impact Calculator. The research showcased global trends in mycotoxin contamination and their impact on poultry gut health, drawing on insights from its 400,000-sample global database.


Europe Feed Mycotoxin Detoxifiers Market Report Scope
Feed mycotoxin detoxifiers are specialized feed additives, including binders and biotransformers, formulated to mitigate the adverse effects of mold-produced toxins on animal health, performance, and reproduction. These additives work by either binding toxins in the digestive tract for excretion or breaking them down into non-toxic components. The Europe Feed Mycotoxin Detoxifiers Market Report is Segmented by Sub-Additive (Binders and Biotransformers), by Animal (Aquaculture, Poultry, Ruminants, Swine, and Other Animals), and by Geography (France, Germany, Italy, Netherlands, Russia, Spain, United Kingdom, and More). The Market Forecasts are Provided in Terms of Value (USD) and Volume (Metric Tons).
| Binders |
| Biotransformers |
| Aquaculture | Fish |
| Shrimp | |
| Other Aquaculture Species | |
| Poultry | Broiler |
| Layer | |
| Other Poultry Birds | |
| Ruminants | Beef Cattle |
| Dairy Cattle | |
| Other Ruminants | |
| Swine | |
| Other Animals |
| France |
| Germany |
| Italy |
| Netherlands |
| Russia |
| Spain |
| United Kingdom |
| Rest of Europe |
| By Sub-Additive | Binders | |
| Biotransformers | ||
| By Animal | Aquaculture | Fish |
| Shrimp | ||
| Other Aquaculture Species | ||
| Poultry | Broiler | |
| Layer | ||
| Other Poultry Birds | ||
| Ruminants | Beef Cattle | |
| Dairy Cattle | ||
| Other Ruminants | ||
| Swine | ||
| Other Animals | ||
| By Geography | France | |
| Germany | ||
| Italy | ||
| Netherlands | ||
| Russia | ||
| Spain | ||
| United Kingdom | ||
| Rest of Europe | ||


Market Definition
- FUNCTIONS - For the study, feed additives are considered to be commercially manufactured products that are used to enhance characteristics such as weight gain, feed conversion ratio, and feed intake when fed in appropriate proportions.
- RESELLERS - Companies engaged in reselling feed additives without value addition have been excluded from the market scope, to avoid double counting.
- END CONSUMERS - Compound feed manufacturers are considered to be end-consumers in the market studied. The scope excludes farmers buying feed additives to be used directly as supplements or premixes.
- INTERNAL COMPANY CONSUMPTION - Companies engaged in the production of compound feed as well as the manufacturing of feed additives are part of the study. However, while estimating the market sizes, the internal consumption of feed additives by such companies has been excluded.
| Keyword | Definition |
|---|---|
| Feed additives | Feed additives are products used in animal nutrition for purposes of improving the quality of feed and the quality of food from animal origin, or to improve the animals’ performance and health. |
| Probiotics | Probiotics are microorganisms introduced into the body for their beneficial qualities. (It maintains or restores beneficial bacteria to the gut). |
| Antibiotics | Antibiotic is a drug that is specifically used to inhibit the growth of bacteria. |
| Prebiotics | A non-digestible food ingredient that promotes the growth of beneficial microorganisms in the intestines. |
| Antioxidants | Antioxidants are compounds that inhibit oxidation, a chemical reaction that produces free radicals. |
| Phytogenics | Phytogenics are a group of natural and non-antibiotic growth promoters derived from herbs, spices, essential oils, and oleoresins. |
| Vitamins | Vitamins are organic compounds, which are required for normal growth and maintenance of the body. |
| Metabolism | A chemical process that occurs within a living organism in order to maintain life. |
| Amino acids | Amino acids are the building blocks of proteins and play an important role in metabolic pathways. |
| Enzymes | Enzyme is a substance that acts as a catalyst to bring about a specific biochemical reaction. |
| Anti-microbial resistance | The ability of a microorganism to resist the effects of an antimicrobial agent. |
| Anti-microbial | Destroying or inhibiting the growth of microorganisms. |
| Osmotic balance | It is a process of maintaining salt and water balance across membranes within the body's fluids. |
| Bacteriocin | Bacteriocins are the toxins produced by bacteria to inhibit the growth of similar or closely related bacterial strains. |
| Biohydrogenation | It is a process that occurs in the rumen of an animal in which bacteria convert unsaturated fatty acids (USFA) to saturated fatty acids (SFA). |
| Oxidative rancidity | It is a reaction of fatty acids with oxygen, which generally causes unpleasant odors in animals. To prevent these, antioxidants were added. |
| Mycotoxicosis | Any condition or disease caused by fungal toxins, mainly due to contamination of animal feed with mycotoxins. |
| Mycotoxins | Mycotoxins are toxin compounds that are naturally produced by certain types of molds (fungi). |
| Feed Probiotics | Microbial feed supplements positively affect gastrointestinal microbial balance. |
| Probiotic yeast | Feed yeast (single-cell fungi) and other fungi used as probiotics. |
| Feed enzymes | They are used to supplement digestive enzymes in an animal’s stomach to break down food. Enzymes also ensure that meat and egg production is improved. |
| Mycotoxin detoxifiers | They are used to prevent fungal growth and to stop any harmful mold from being absorbed in the gut and blood. |
| Feed antibiotics | They are used both for the prevention and treatment of diseases but also for rapid growth and development. |
| Feed antioxidants | They are used to protect the deterioration of other feed nutrients in the feed such as fats, vitamins, pigments, and flavoring agents, thus providing nutrient security to the animals. |
| Feed phytogenics | Phytogenics are natural substances, added to livestock feed to promote growth, aid in digestion, and act as anti-microbial agents. |
| Feed vitamins | They are used to maintain the normal physiological function and normal growth and development of animals. |
| Feed flavors and sweetners | These flavors and sweeteners help to mask tastes and odors during changes in additives or medications and make them ideal for animal diets undergoing transition. |
| Feed acidifiers | Animal feed acidifiers are organic acids incorporated into the feed for nutritional or preservative purposes. Acidifiers enhance congestion and microbiological balance in the alimentary and digestive tracts of livestock. |
| Feed minerals | Feed minerals play an important role in the regular dietary requirements of animal feed. |
| Feed binders | Feed binders are the binding agents used in the manufacture of safe animal feed products. It enhances the taste of food and prolongs the storage period of the feed. |
| Key Terms | Abbreviation |
| LSDV | Lumpy Skin Disease Virus |
| ASF | African Swine Fever |
| GPA | Growth Promoter Antibiotics |
| NSP | Non-Starch Polysaccharides |
| PUFA | Polyunsaturated Fatty Acid |
| Afs | Aflatoxins |
| AGP | Antibiotic Growth Promoters |
| FAO | The Food And Agriculture Organization of the United Nations |
| USDA | The United States Department of Agriculture |


Research Methodology
Mordor Intelligence follows a four-step methodology in all our reports.
- Step-1: IDENTIFY KEY VARIABLES: In order to build a robust forecasting methodology, the variables and factors identified in Step-1 are tested against available historical market numbers. Through an iterative process, the variables required for market forecast are set and the model is built on the basis of these variables.
- Step-2: Build a Market Model: Market-size estimations for the forecast years are in nominal terms. Inflation is not a part of the pricing, and the average selling price (ASP) is kept constant throughout the forecast period.
- Step-3: Validate and Finalize: In this important step, all market numbers, variables and analyst calls are validated through an extensive network of primary research experts from the market studied. The respondents are selected across levels and functions to generate a holistic picture of the market studied.
- Step-4: Research Outputs: Syndicated Reports, Custom Consulting Assignments, Databases & Subscription Platforms


