
Drug Designing Tools Market Size and Share
Market Overview
| Study Period | 2021 - 2032 |
|---|---|
| Market Size (2027) | USD 4.09 Billion |
| Market Size (2032) | USD 6.12 Billion |
| Growth Rate (2027 - 2032) | 8.39 % |
| Fastest Growing Market | Asia-Pacific |
| Largest Market | North America |
| Market Concentration | Medium |
Major Players *Disclaimer: Major Players sorted in no particular order Image © Mordor Intelligence. Reuse requires attribution under CC BY 4.0. | |
Drug Designing Tools Market Analysis by Mordor Intelligence
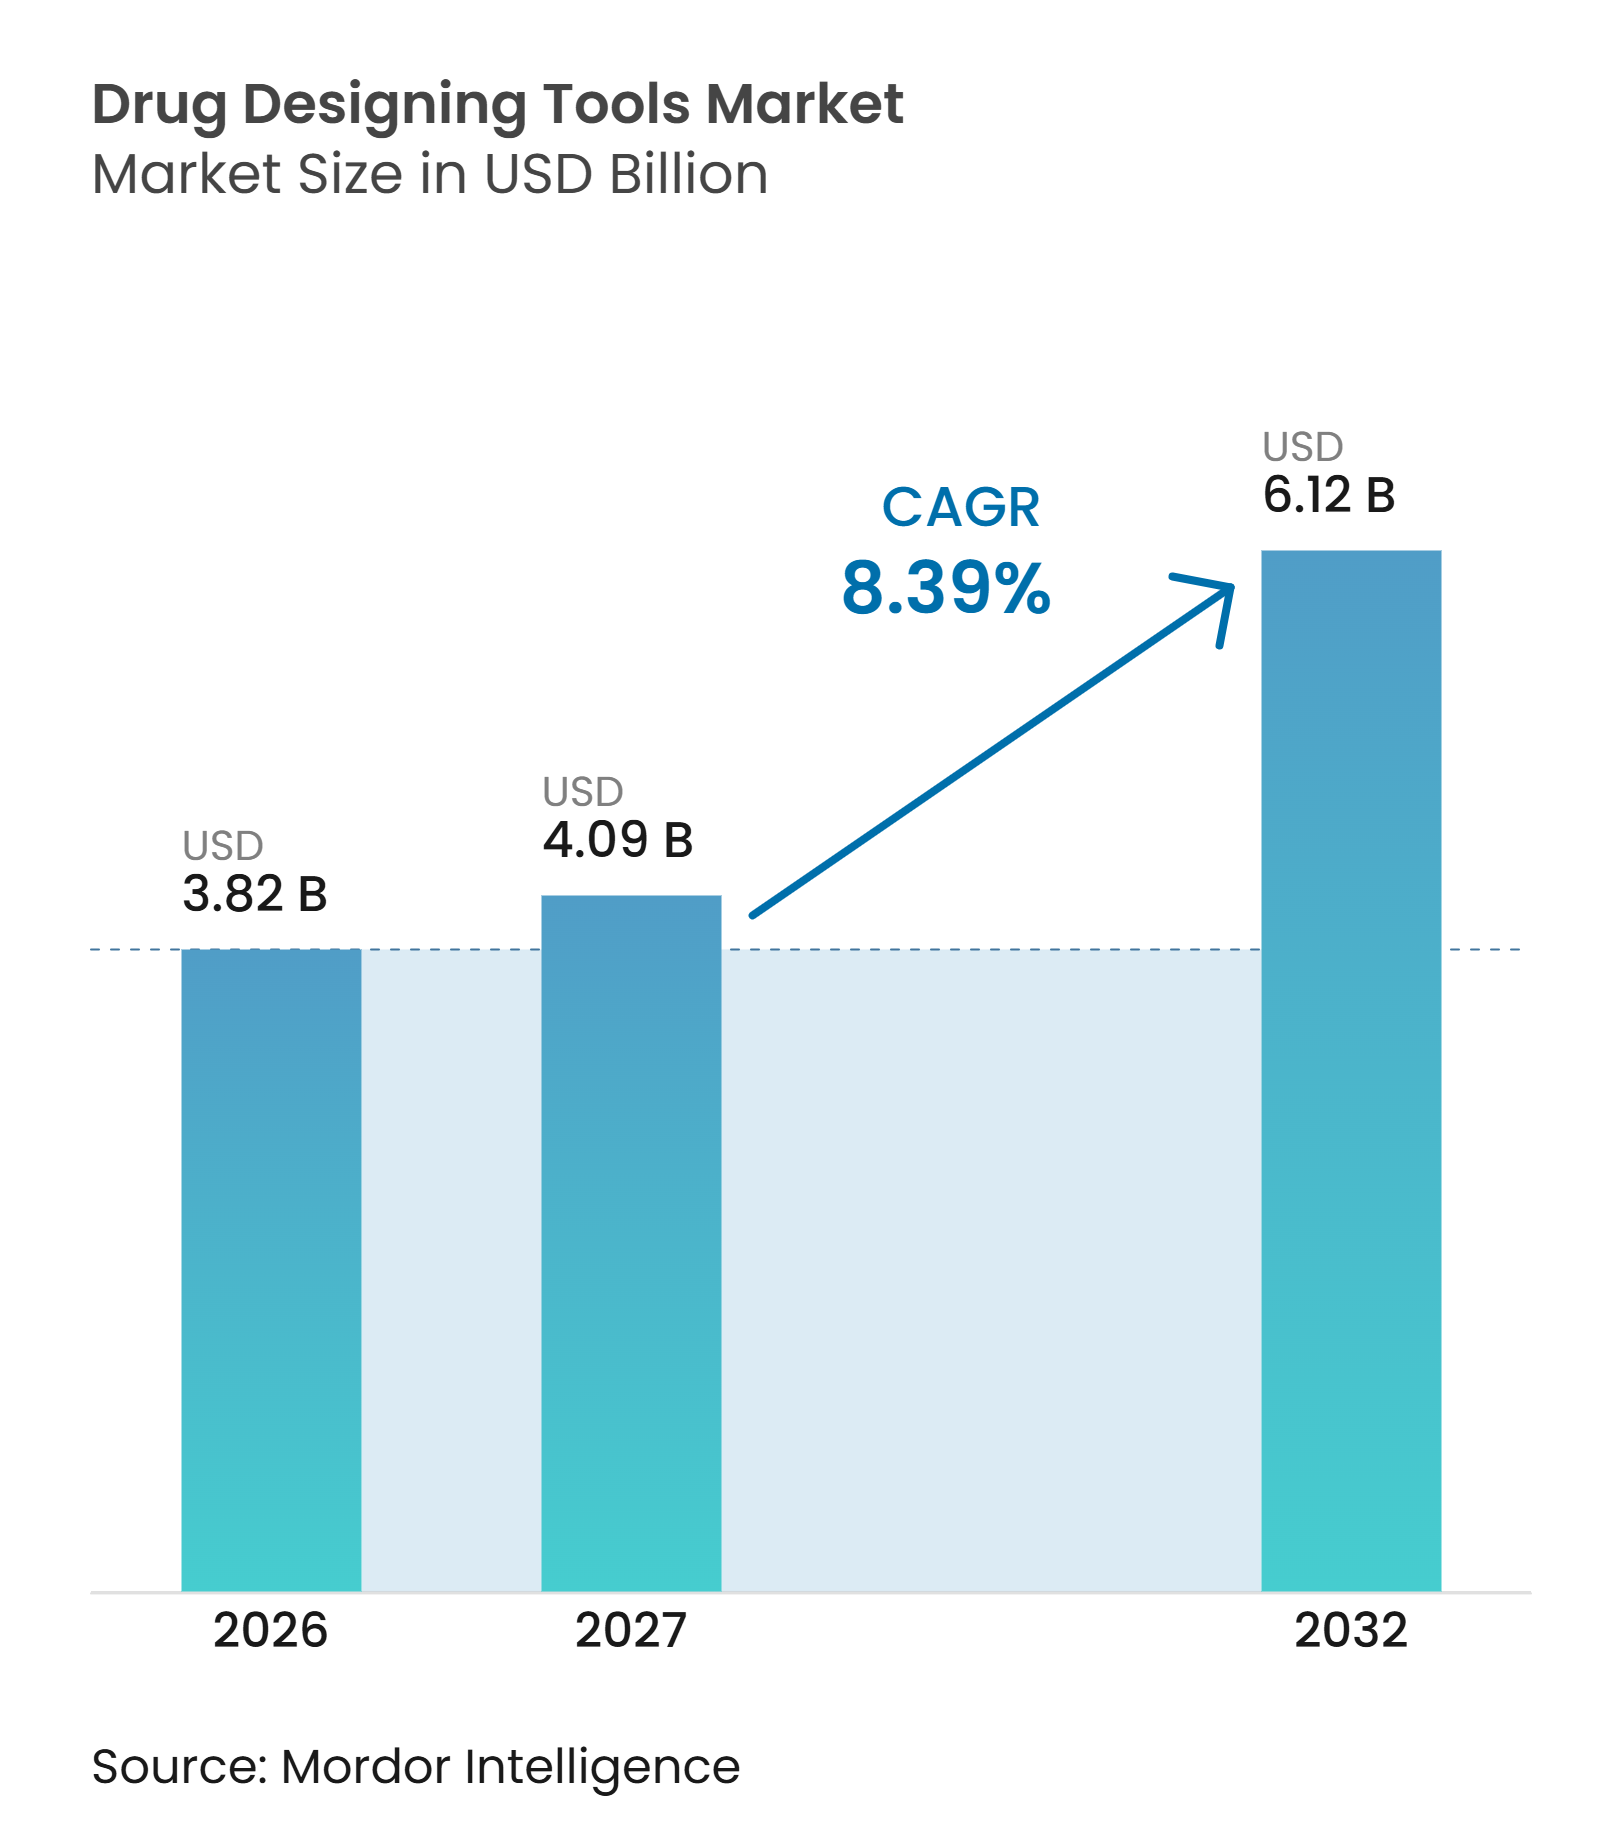
The Drug Designing Tools Market size is expected to grow from USD 3.82 billion in 2026 to USD 4.09 billion in 2027 and is forecast to reach USD 6.12 billion by 2032 at 8.39% CAGR over 2027-2032.
Growth is supported by the wider use of molecular simulation, generative artificial intelligence, and high-performance computing in biopharma research. Discovery teams are moving computational methods into lead generation and optimization rather than treating them as supporting tools. Integrated platforms can connect molecular design, experimental data, simulation, and workflow management, which makes them more useful for enterprise research teams. Scientific validation, data quality, and access to scalable computing shape vendor selection in the drug designing tools market. High licensing costs and uneven regulatory acceptance of artificial intelligence models continue to limit adoption among smaller organizations.
Key Report Takeaways
- By tool type, molecular modeling tools held 35.16% of the drug designing tools market share in 2026, while AI/ML-based drug design tools are forecast to grow at an 11.06% CAGR through 2032.
- By deployment mode, on-premise systems held 47.78% of the drug designing tools market share in 2026, while cloud-based deployment is forecast to grow at a 10.17% CAGR through 2032.
- By application, lead optimization accounted for 29.56% of the drug designing tools market size in 2026, while drug repurposing is forecast to grow at a 9.83% CAGR through 2032.
- By end user, pharmaceutical companies held 48.25% of the drug designing tools market size in 2026, while biotechnology companies are forecast to grow at a 10.28% CAGR through 2032.
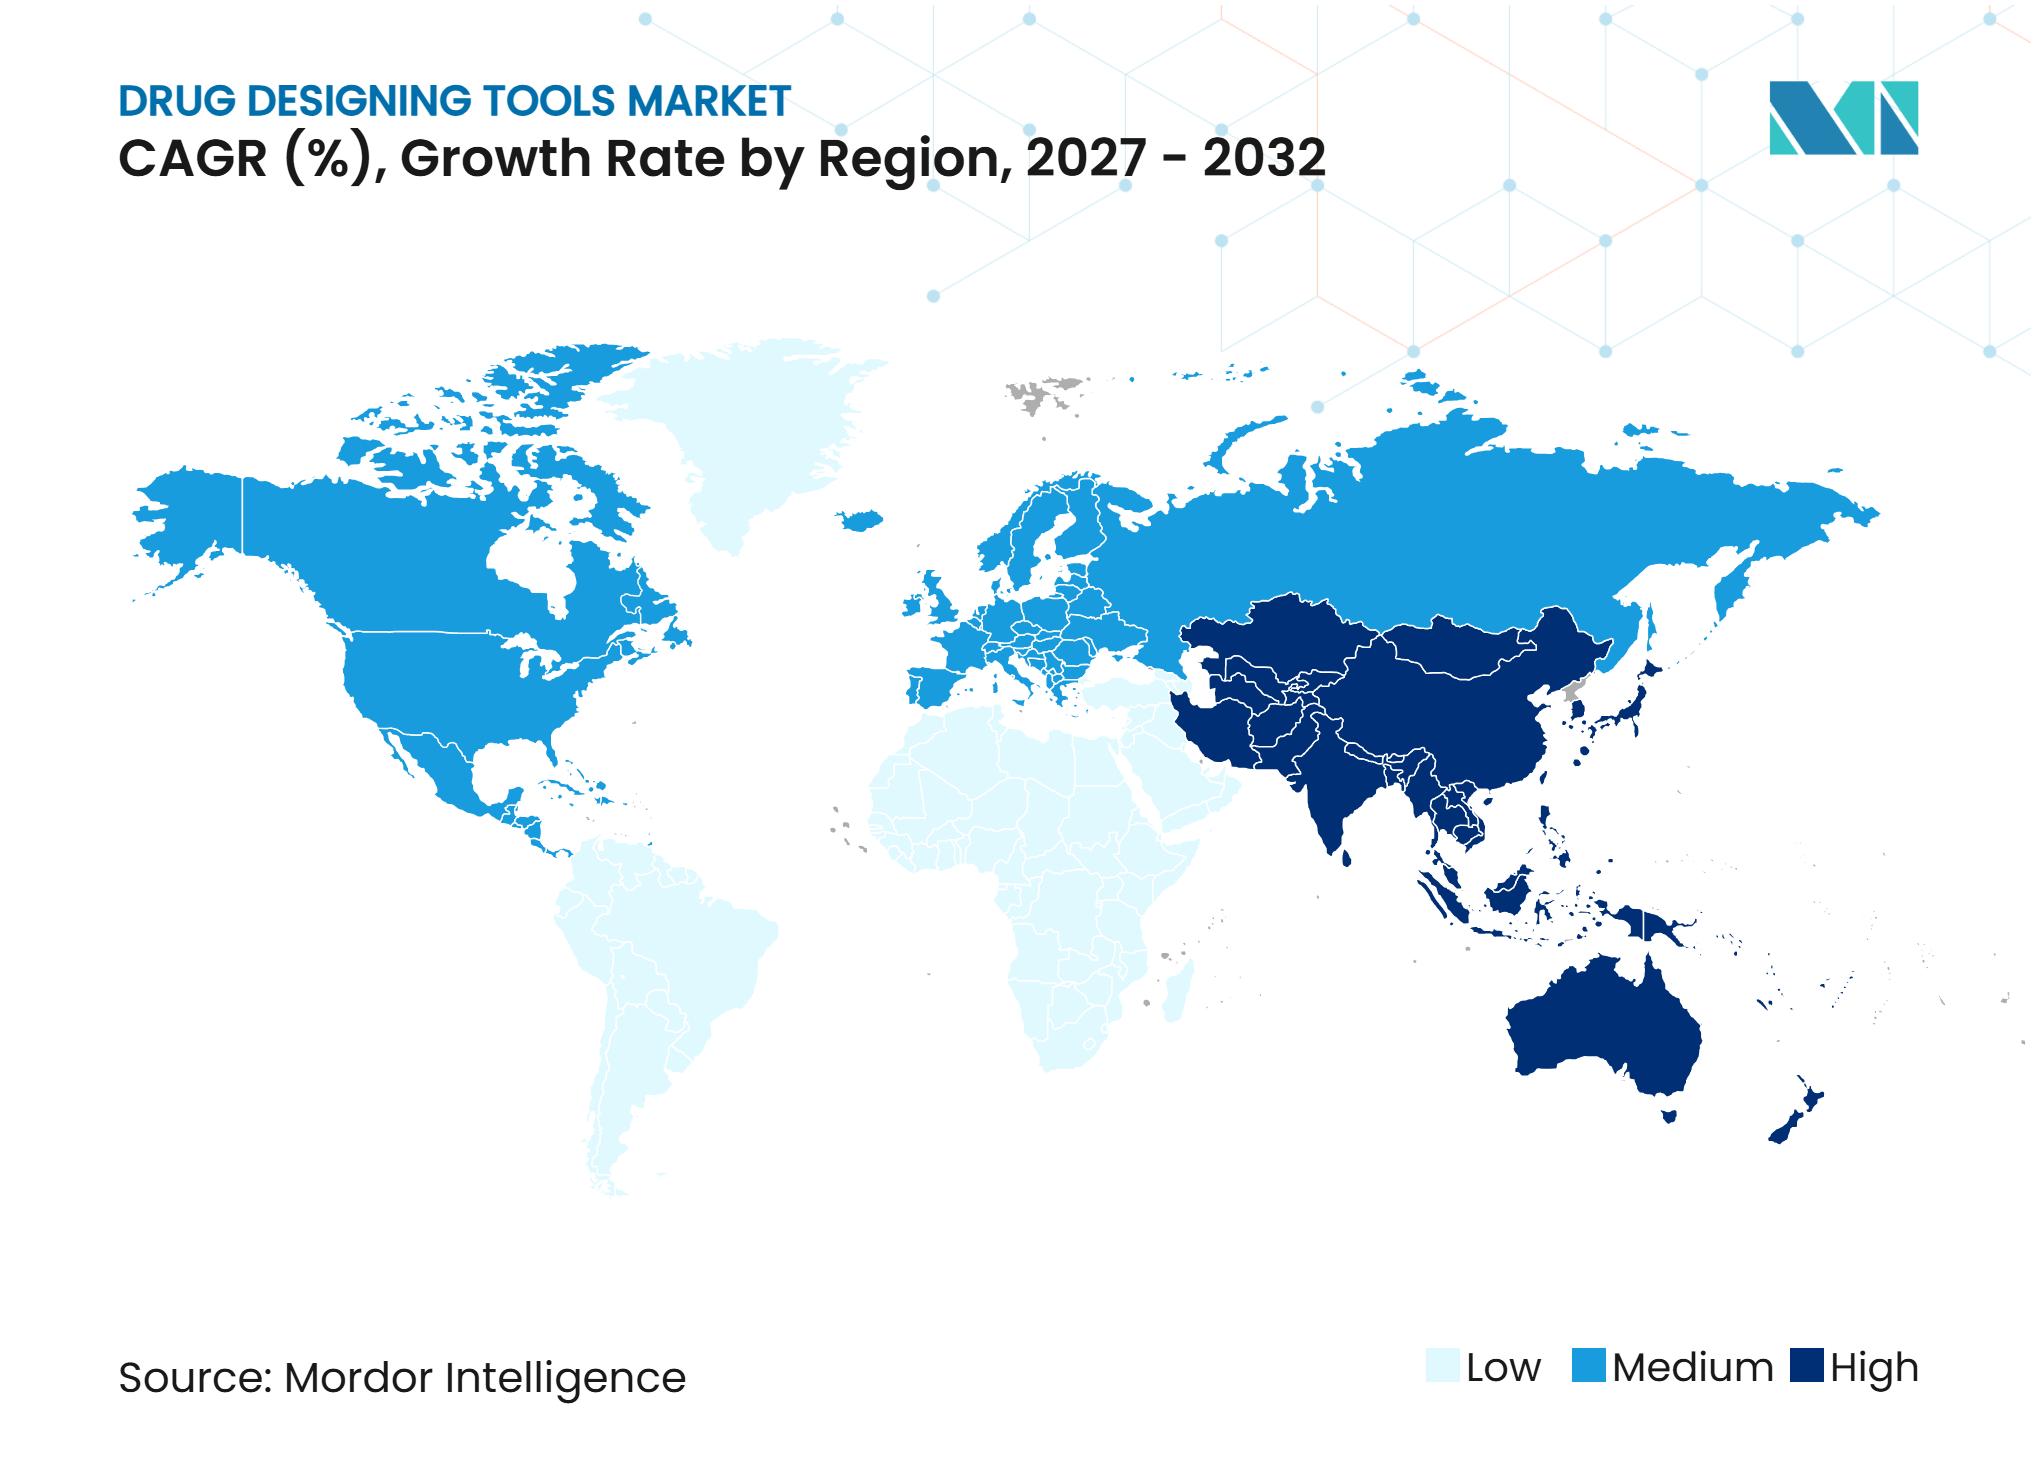
- By geography, North America held 43.11% of the drug designing tools market in 2026, while Asia-Pacific is forecast to grow at a 10.62% CAGR through 2032.
Note: Market numbers in this report are based on Mordor Intelligence's proprietary estimation framework, which combines nine months of actuals with Q4 projections for base year 2026.
Market Trends and Insights
Drivers Impact Analysis of Drug Designing Tools Market*
| Driver | (~) % Impact on CAGR Forecast | Geographic Relevance | Impact Timeline |
|---|---|---|---|
| AI And Machine Learning Integration in Drug Design | +3.0% | Global, concentrated in North America and the Asia-Pacific | Short term (≤ 2 years) |
| Pharmaceutical R&D Spending and Computational Discovery Adoption | +1.5% | North America, Europe, and China | Medium term (2-4 years) |
| Demand For Precision Medicine and Targeted Therapies | +1.2% | Global, with early gains in the United States, Germany, and Japan | Long term (≥ 4 years) |
| Cloud Computing and High-Performance Computing Expansion | +0.8% | North America, EU, and APAC core, with spillover to MEA | Medium term (2-4 years) |
| Regulatory Acceptance of In Silico Models and Simulation Testing | +0.6% | North America and Europe, with early gains in Japan | Medium term (2-4 years) |
| Availability Of Genomics and Multi-Omics Data | +0.7% | Global, strongest in North America, the United Kingdom, and China | Long term (≥ 4 years) |
| Source: Mordor Intelligence | |||
Increasing Integration of AI & Machine Learning in Drug Design
Artificial intelligence and machine learning are becoming central tools in modern discovery programs. Generative chemistry, free energy perturbation, and automated workflows allow teams to assess many possible molecular designs before synthesis begins. Several artificial intelligence-designed programs from Schrödinger, Recursion, and Insilico Medicine had reached Phase II by 2025, showing that these methods had moved into clinical development. [1] The value of these systems increasingly depends on the quality, structure, and history of the experimental data used to train them. Organizations with well-maintained molecular and assay data can improve prediction quality over time, while fragmented data limits the usefulness of similar models. This pattern supports demand for platforms that combine model development with structured scientific data in the drug designing tools market.
Rising Pharmaceutical R&D Spending and Adoption of Computational Drug Discovery
Computational discovery is becoming more important as research teams seek to reduce repeated laboratory cycles. Biopharma companies use virtual screening, simulation, and predictive models to prioritize molecules before committing resources to synthesis and testing. The continuing importance of high-performance computing is reflected in Eli Lilly’s 2025 plan to build LillyPod with 1,016 NVIDIA Blackwell GPUs for discovery workflows. Bristol Myers Squibb also announced in July 2026 that it would build an AI factory for biosimulation foundation models using its proprietary data. [2] Cloud capacity and hybrid systems let teams scale model training and virtual screening while keeping sensitive molecular data under tighter control. These investments show that computing capacity is becoming part of research infrastructure, and they support platform integration and scalable inference in the drug designing tools market.
Growing Demand for Precision Medicine and Targeted Therapies
Targeted therapies require a clear understanding of disease biology and molecular binding behavior. In 2025, cancer medicines accounted for 35% of new U.S. drug approvals, and many of these medicines used targeted treatment approaches selected through companion diagnostics. [3] This work increases the need for molecular docking, structure-based design, pharmacophore modeling, and multi-parameter optimization. Drug developers must assess binding affinity and selectivity across genetically distinct patient groups. Multi-omics data can support this work by connecting target prioritization, biomarkers, and patient variation when it is used with suitable computational methods. These requirements expand the role of specialized modeling tools across targeted therapy programs in the drug designing tools market.
Growing Regulatory Acceptance of In Silico Models and Simulation-Based Testing
Regulators are defining clearer pathways for selected computational evidence in drug development. The U.S. Food and Drug Administration released draft guidance on using artificial intelligence to support regulatory decision-making in January 2025. The agency’s April 2025 roadmap on reducing animal testing also encouraged the use of new approach methodologies, including in silico models and organoids, in investigational new drug applications. Physiologically based pharmacokinetic modeling has established a record in regulatory review, which gives sponsors a practical reference point for validated simulation tools. Acceptance remains selective outside established biosimulation applications, so vendors still need strong documentation and validation. This regulatory direction supports gradual adoption but does not remove the need for evidence that a model is fit for its intended use.
Restraints Impact Analysis of Drug Designing Tools Market*
| Restraint | (~) % Impact on CAGR Forecast | Geographic Relevance | Impact Timeline |
|---|---|---|---|
| Software Licensing, Deployment, and Maintenance Costs | -1.8% | Global, most acute for mid-size and small biotechnology companies and CROs | Short term (≤ 2 years) |
| Data Quality, Interoperability, and Standardization Challenges | -1.2% | Global | Long term (≥ 4 years) |
| Shortage Of Skilled Computational Biology and Drug Discovery Professionals | -0.8% | Global, most acute in emerging biopharma hubs in South America and MEA | Medium term (2-4 years) |
| Accuracy, Validation, and Regulatory Compliance Concerns For AI Models | -0.6% | North America and Europe, where regulatory scrutiny is highest | Medium term (2-4 years) |
| Source: Mordor Intelligence | |||
High Software Licensing, Deployment, and Maintenance Costs
Software cost remains a material barrier for small biotechnology companies, contract research organizations, and academic spinouts. Annual site licenses for 3D molecular modeling platforms range from USD 50,000 to USD 1 million, depending on functionality and user count. Comprehensive artificial intelligence discovery suites can require substantially higher annual subscription spending. Licensing is only one part of the deployment cost because organizations also need computing capacity, IT support, data integration, and model maintenance. Larger pharmaceutical companies can spread these costs across dedicated computational chemistry teams and broader discovery portfolios. This cost structure keeps adoption uneven across the drug designing tools market and encourages interest in shared infrastructure and subscription models.
Data Quality, Interoperability, and Standardization Challenges
Drug design models depend on reliable molecular structures, assay results, and pharmacological data. These records often sit in separate assay management systems, electronic laboratory notebooks, and compound registration platforms. A 2026 study found that integrating molecular modalities can improve prediction performance when effective data fusion is used, but weak integration can materially reduce results. Differences in data standards can also cause a model trained in one environment to lose usefulness after transfer to another system. Benchling supports structured scientific data across more than 1,300 companies and 7,500 academic institutions, illustrating the scale of the data management need. Poor data practices early in development can weaken later lead optimization and toxicity work, which remains a constraint on the drug designing tools market.
*Our forecasts treat driver/restraint impacts as directional, not additive. The impact forecasts reflect baseline growth, mix effects, and variable interactions.
Drug Designing Tools Market Segment Analysis
By Tool Type:
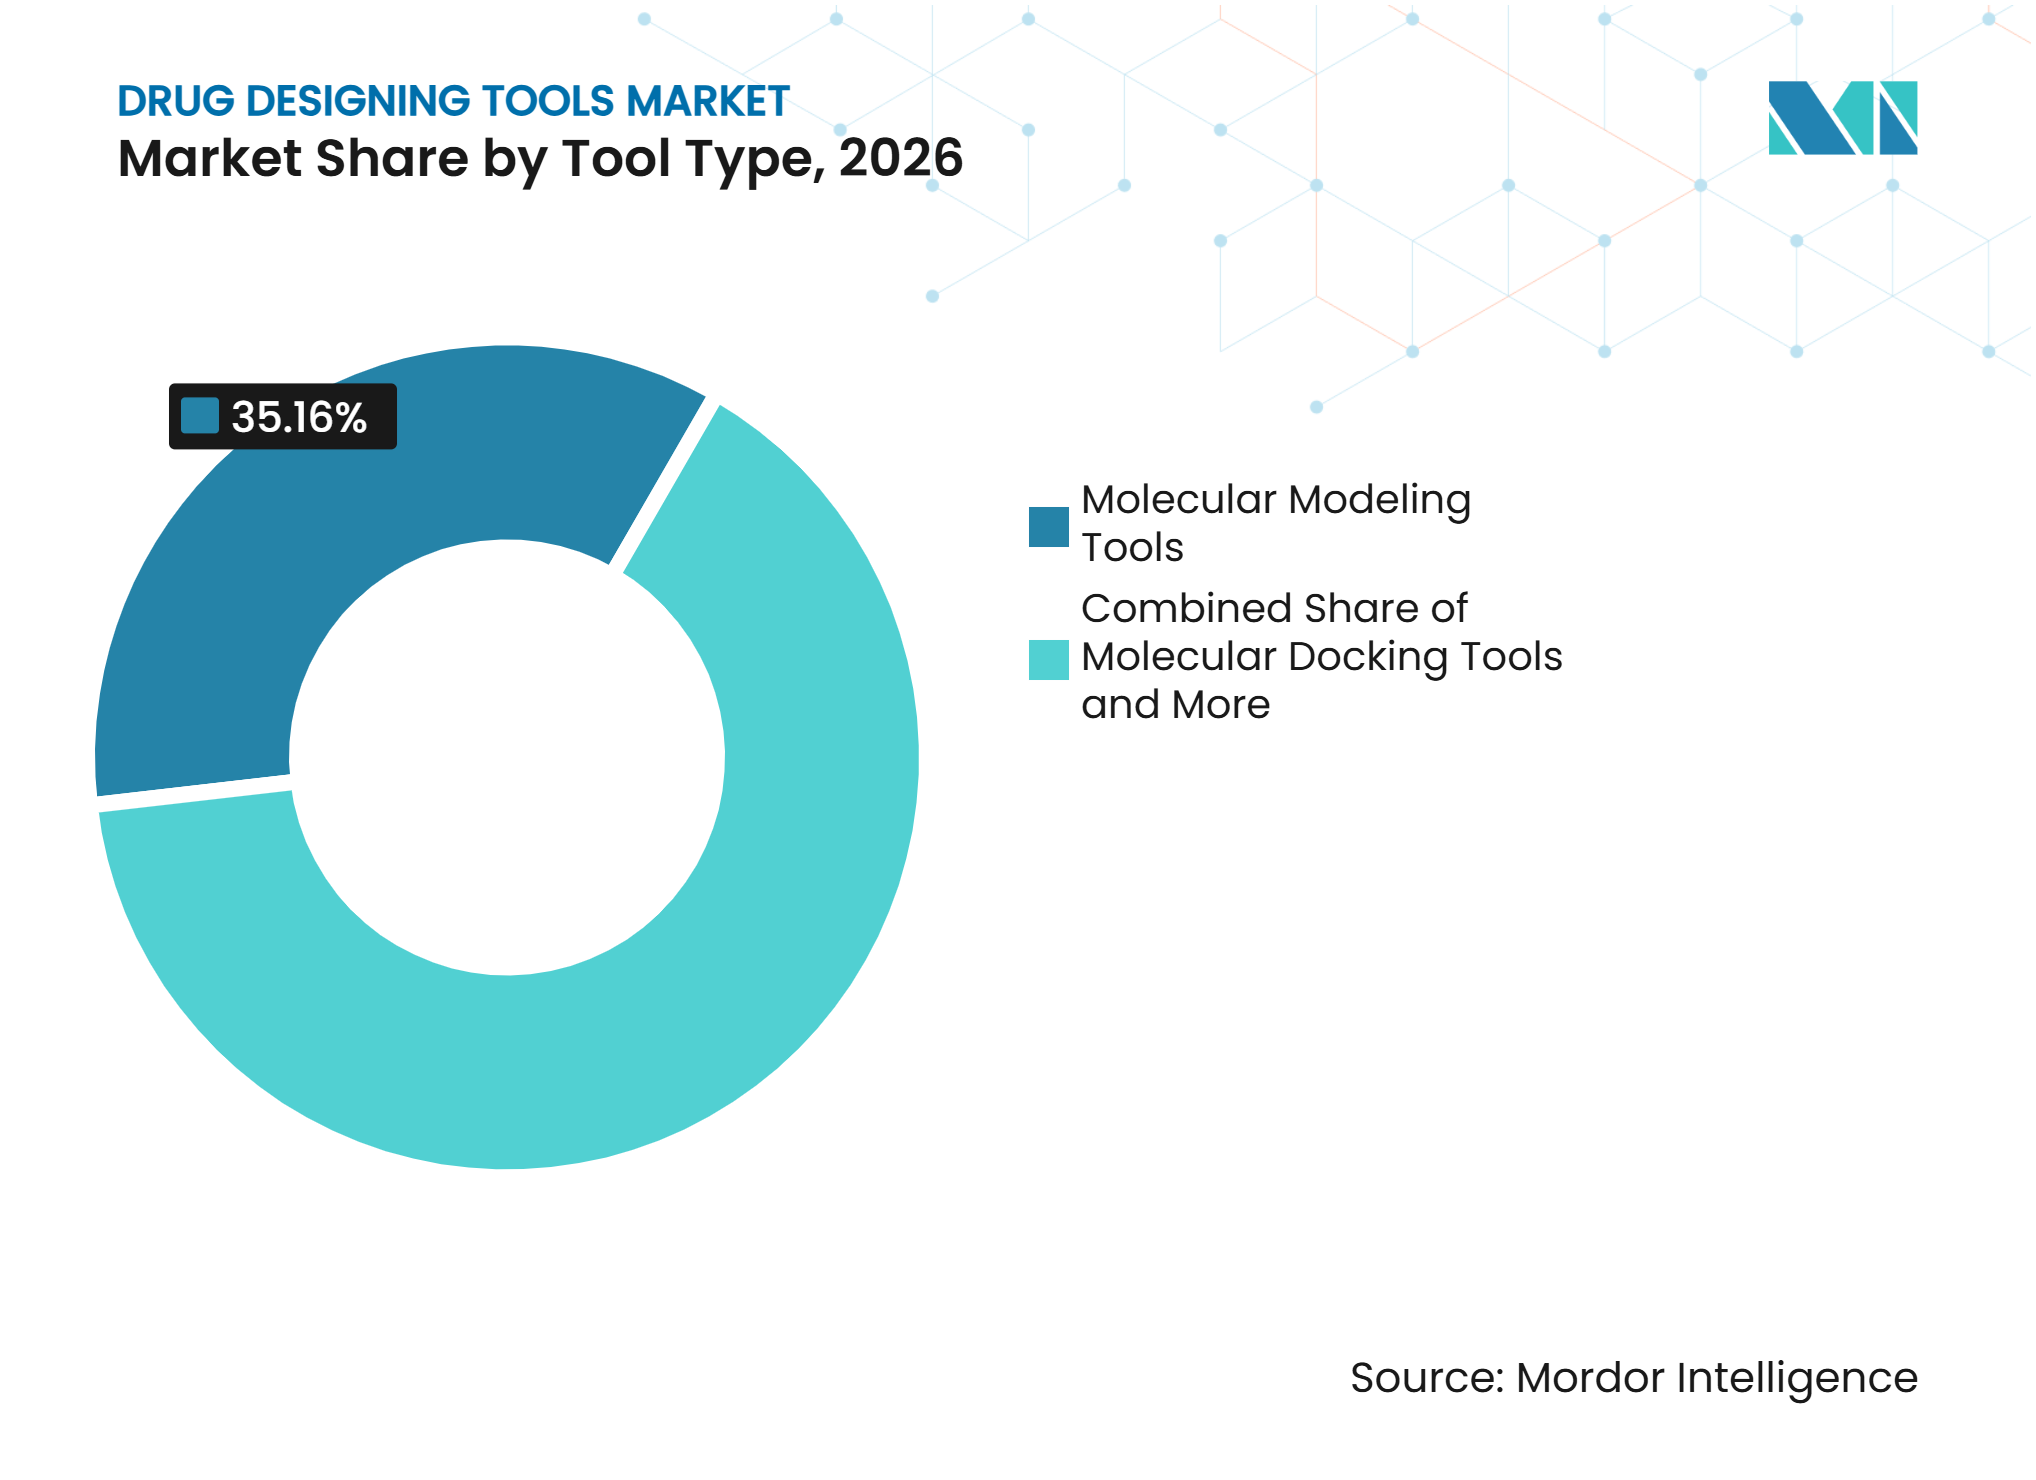
Molecular Modeling Leads While AI/ML Tools Grow FastestMolecular modeling tools held 35.16% of the drug designing tools market in 2026. Their position reflects their established role in 3D structural analysis, atomistic simulation, and binding-site characterization. Molecular docking, virtual screening, and structure-activity relationship tools serve distinct parts of lead identification and refinement. Virtual screening is gaining wider use as teams examine chemical libraries containing billions of candidate compounds. The use of physiologically based pharmacokinetic models as regulatory evidence has increased interest in validated biosimulation environments.
AI/ML-based drug design tools are forecast to grow at an 11.06% CAGR from 2027 to 2032. A 2026 review found that artificial intelligence methods were improving Phase I outcomes in emerging biopharma, while the Phase II evidence base remained too limited for broader conclusions. Platforms that connect predictions to measured outcomes can differentiate themselves from tools that only present algorithmic novelty. The drug designing tools industry is therefore moving toward combined physics-based and data-driven workflows rather than replacing established modeling methods outright.



By Deployment Mode:
On-Premises Systems Lead While Cloud Adoption AcceleratesOn-premises infrastructure held 47.78% of deployment revenue in 2026. Pharmaceutical companies often retain proprietary molecular datasets, target sequences, and structure-activity relationships within local environments. This data can core competitive assets, so users may require strict security and contractual controls before moving them to shared infrastructure. Hybrid deployment provides a middle option by keeping sensitive steps local and using scalable capacity for demanding calculations. This model can preserve data control while supporting parallel virtual screening and simulation workloads.
Cloud-based deployment is forecast to grow at a 10.17% CAGR from 2027 to 2032. Lilly’s 2025 computing investment and Bristol Myers Squibb’s August 2026 biosimulation initiative show that scalable GPU capacity is becoming central to discovery work. Cloud subscriptions can give smaller companies access to high-performance computing without building large local clusters. Security improvements and hybrid architecture reduce some barriers, but sensitive data concerns remain important. As a result, the drug designing tools market is likely to retain several deployment models rather than shift completely to cloud systems.
By Application:
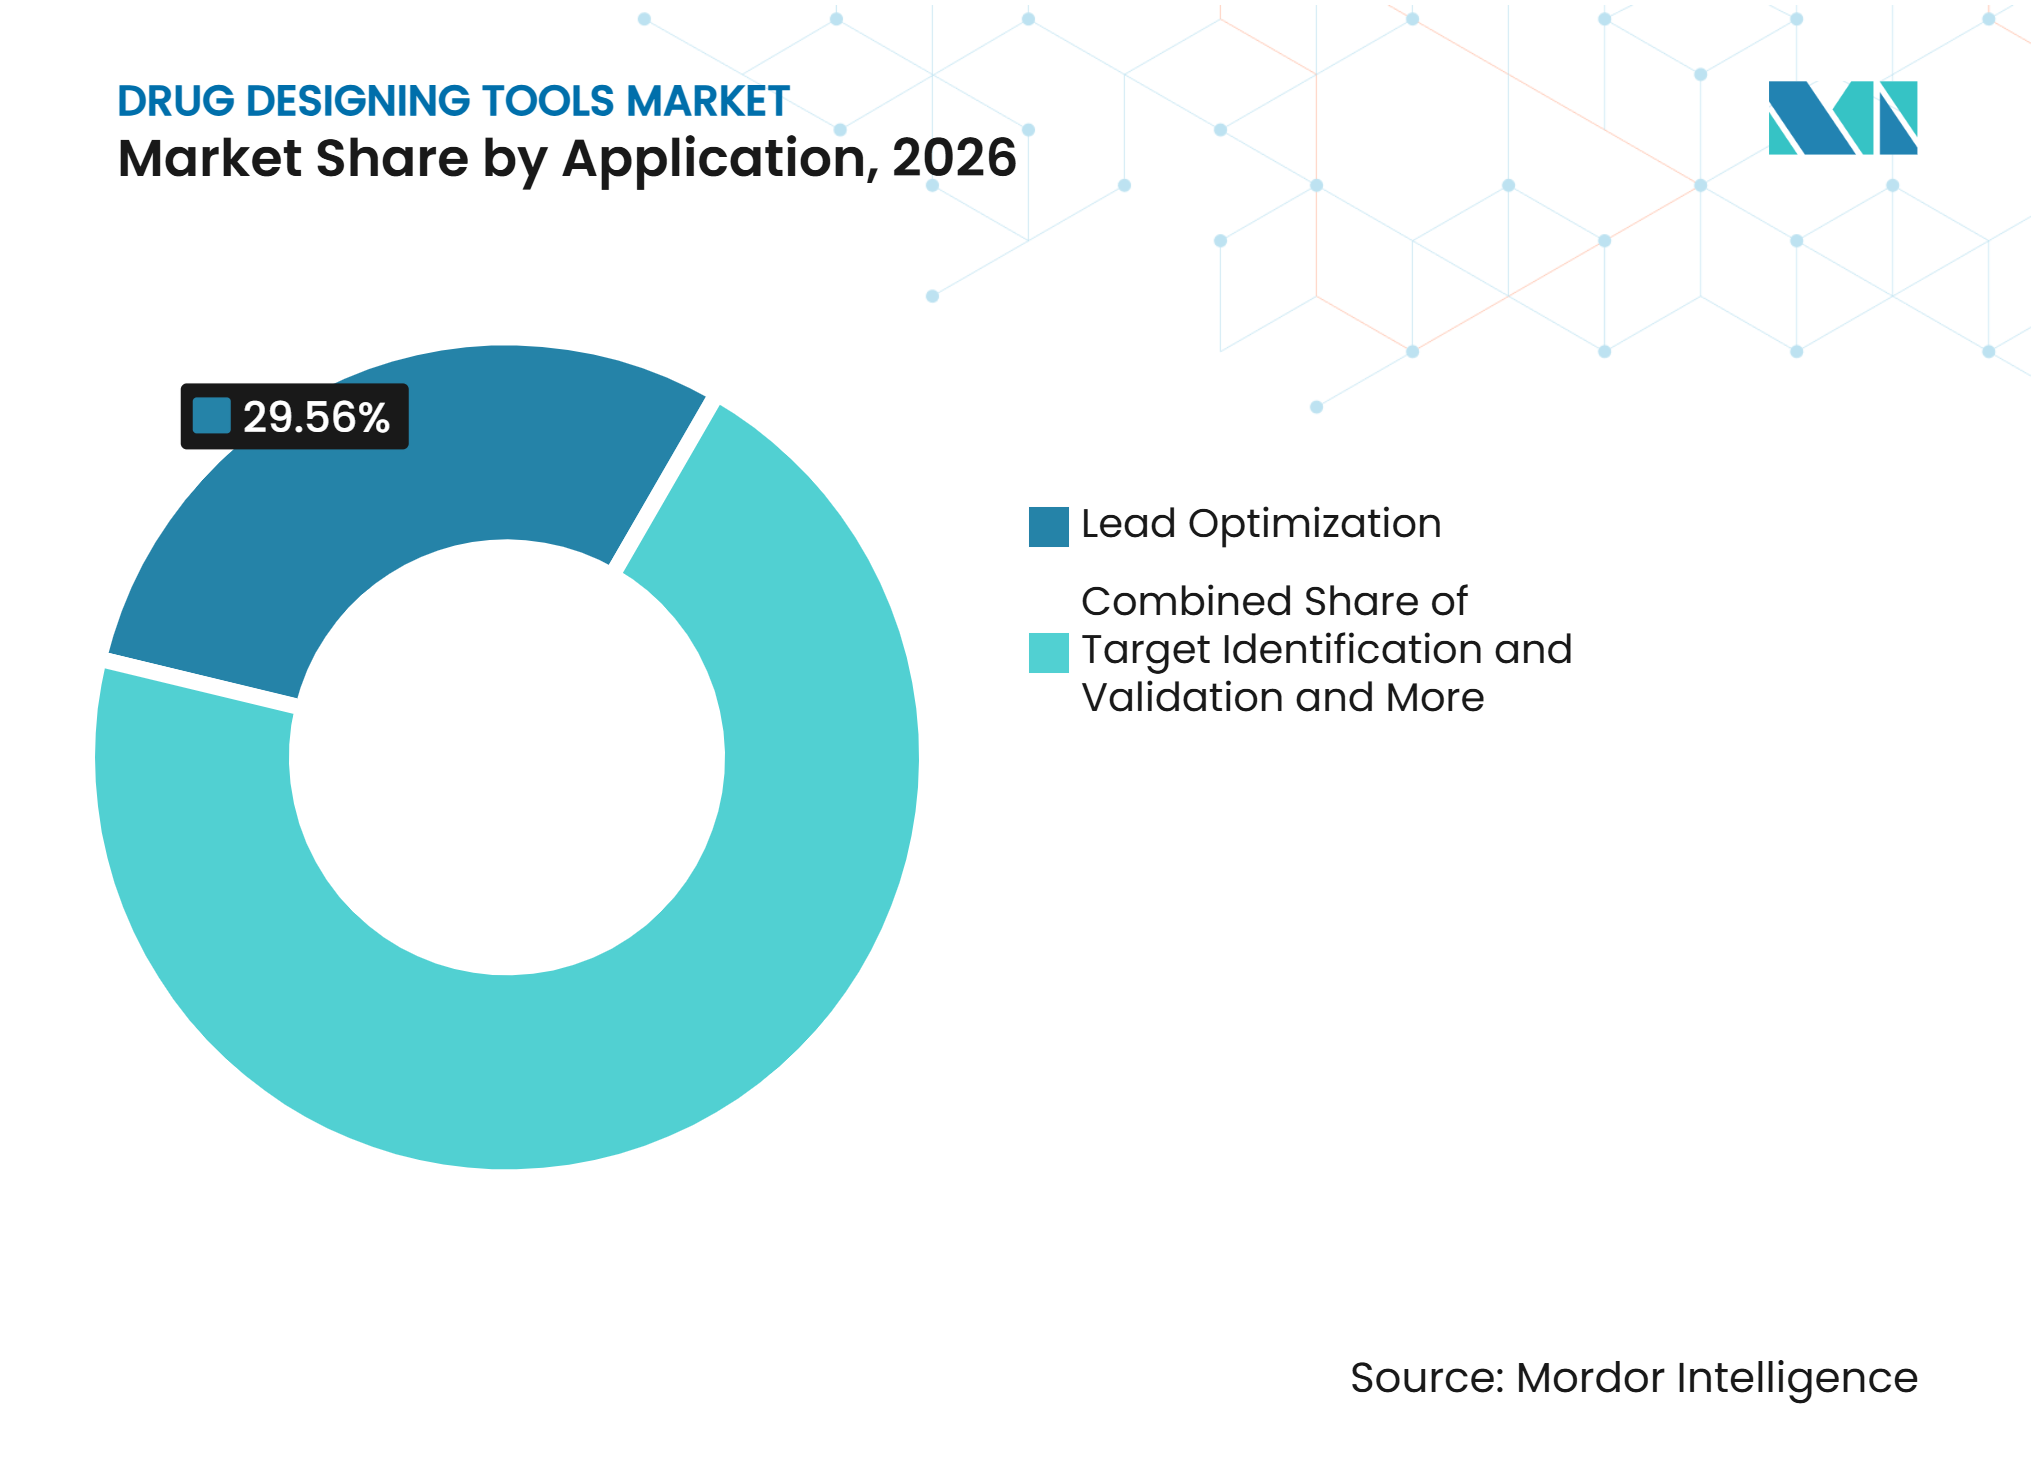
Lead Optimization Holds the Largest Position, While Repurposing ExpandsLead optimization held 29.56% of the drug designing tools market in 2026. This phase requires repeated decisions on potency, selectivity, safety, and drug-like properties. Free energy perturbation, multi-parameter optimization, and ADMET prediction tools can help reduce unnecessary synthesis and testing cycles. Their value is most visible when a team must compare many closely related compounds before nominating a candidate. Other uses include toxicity assessment and candidate prioritization across the discovery pipeline.
Drug repurposing is forecast to grow at a 9.83% CAGR from 2027 to 2032. It uses known molecular scaffolds and new biological knowledge to assess whether existing medicines may address different targets or diseases. Multi-omics information can make this work more systematic by connecting disease biology with target prioritization. Computational platforms can test binding compatibility without starting a complete new-molecule discovery program. Drug repurposing, therefore, acts as both an application area and a near-term adoption path for AI-enabled tools in the drug designing tools market.

By End User:
Pharmaceutical Companies Hold the Largest Share While Biotech Companies Grow FastestPharmaceutical companies held 48.3% of the drug designing tools market in 2026. Their large share is supported by extensive computational chemistry infrastructure, dedicated in silico teams, and multiyear software agreements. These companies use design tools from target identification through candidate nomination. Many are seeking integrated systems that connect molecular design, data management, and regulatory documentation. Contract research organizations and academic institutions account for a meaningful part of the remaining demand.
Biotechnology companies are forecast to grow at a 10.28% CAGR from 2027 to 2032. These users often prioritize speed and capital efficiency because they may not have dedicated local computing infrastructure. Subscription platforms give them access to artificial intelligence-based design capabilities without the same capital commitment as on-premises systems. Benchling reported that a pilot at a top 20 biopharma reduced 20 potential mouse models to 2 and saved an estimated 8 months of in vivo work. It also makes credible computational platforms more important in early-stage discovery planning within the drug designing tools market.
Geography Analysis
North America
North America held 43.11% of the drug designing tools market in 2026. The United States has concentrated pharmaceutical research spending, established computational chemistry vendors, and a well-funded biotechnology ecosystem. FDA guidance on artificial intelligence and new approach methodologies gives companies a clearer context for developing submission-ready computational tools. Canada contributes through academic and industry collaborations in computational biology, while Mexico offers a growing contract research organization demand base for virtual screening and molecular docking capabilities.
Europe
Europe represented a substantial share of the global drug designing tools market, supported by Germany’s pharmaceutical base, the United Kingdom’s computational biology ecosystem, and public life sciences programs in France. Germany and the United Kingdom host important operations for Merck KGaA, AstraZeneca, GlaxoSmithKline, and specialist computational chemistry firms. The European Medicines Agency is progressing toward more formal model-informed drug development guidance. Spain, Italy, and other European countries present smaller but growing markets for subscription-based platforms among contract research organizations and academic spinouts. EuroHPC-supported work, such as the PRECISION initiative, shows regional investment in molecular dynamics, machine learning, and binding free energy prediction.
Asia-Pacific, Middle East and Africa, South America
Asia-Pacific is forecast to grow at a 10.62% CAGR from 2027 to 2032. China’s biopharmaceutical clusters in Shanghai, Beijing, and the Yangtze River Delta are expanding internal artificial intelligence discovery teams, while Japan is supporting large-scale foundation models for drug design through METI and NEDO programs. India’s Pharmaceutical Production Linked Incentive scheme is supporting domestic computational chemistry investment, while Hyderabad and Bangalore contract research hubs are expanding in silico modeling capabilities. The drug designing tools market remains smaller in the Middle East, Africa, and South America, where demand is concentrated in GCC countries and Brazil. Contract research activity and government-backed biotechnology initiatives are broadening demand for virtual screening and structure-based design in these regions.
Competitive Landscape
Market Concentration
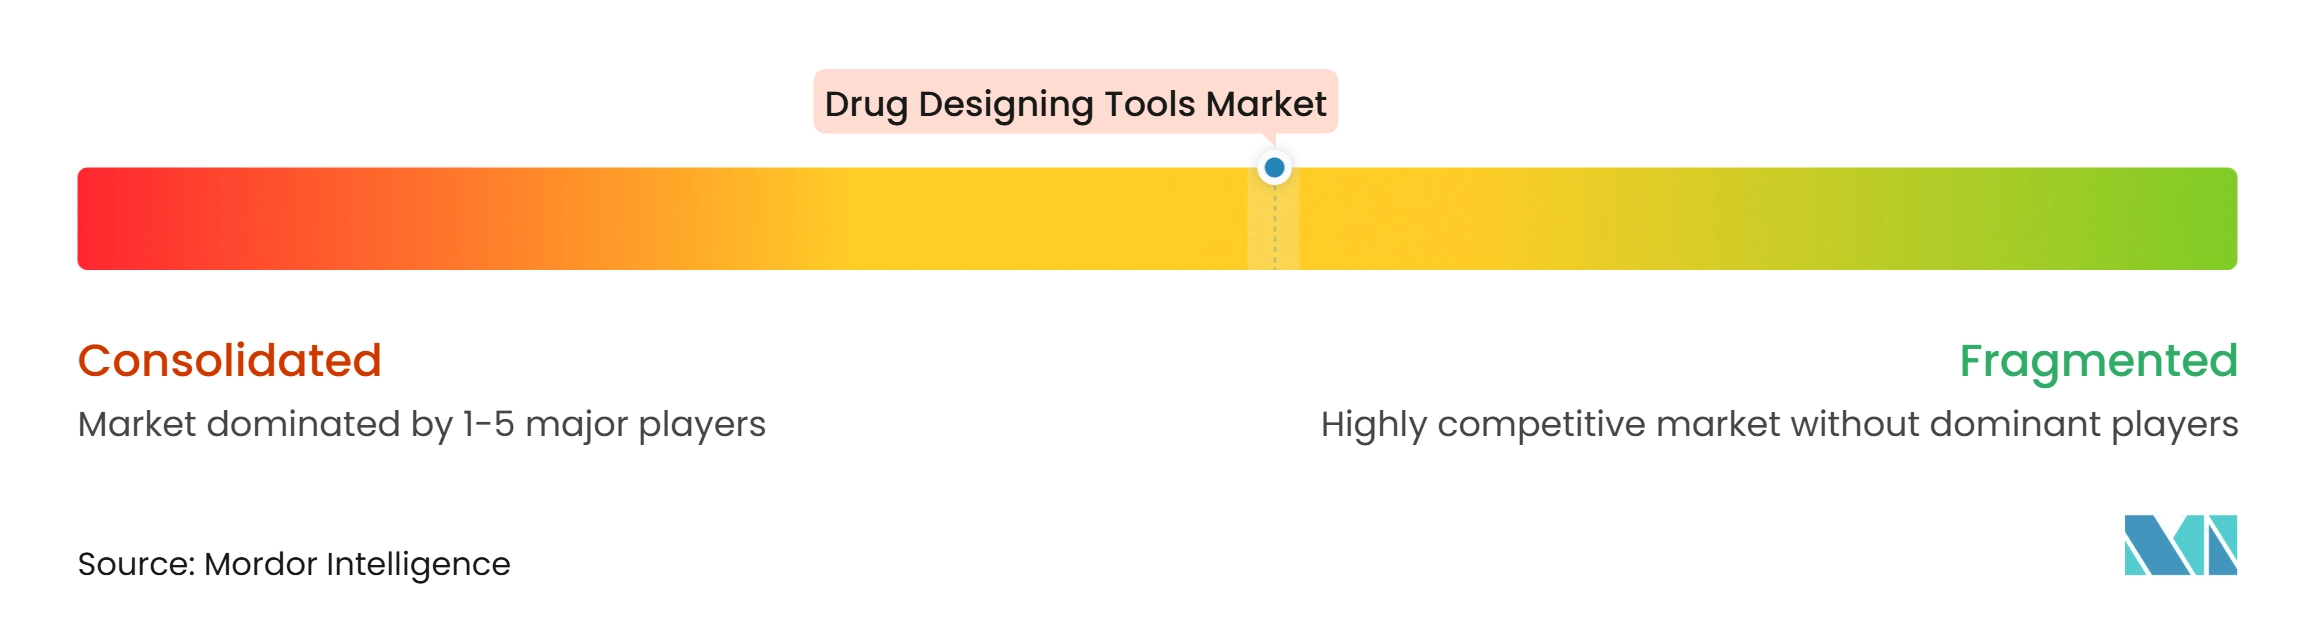
The drug designing tools market is moderately concentrated among specialized software vendors such as Schrödinger, Certara, Dotmatics, and Chemical Computing Group. Competition is centered on platform depth rather than individual software modules. Leading vendors are combining molecular modeling, artificial intelligence-assisted design, biosimulation, data management, and regulatory-ready documentation. This approach makes switching more difficult after a user has embedded experimental data, molecular libraries, and submission history in a platform. The field also has an open opportunity in multi-target polypharmacology and RNA-based therapeutic tools, where established systems remain more focused on small-molecule workflows.
The company introduced Bunsen in July 2026 as an early-access artificial intelligence co-scientist for multistep molecular discovery work, including docking, free energy perturbation, ADMET prediction, and molecular dynamics. It also partnered with Lilly in May 2026 to make the TuneLab platform available through LiveDesign for participating biotechnology companies. Certara announced in July 2026 that it would integrate the NVIDIA BioNeMo Agent Toolkit into its platform, combining biosimulation models, regulatory data, and scientific expertise. These moves show that vendors are competing to make their platforms part of the daily research workflow.
Open-source models and modular software subscriptions are also challenging established pricing and retention models. Open biomolecular artificial intelligence tools can provide lower-cost access to structural prediction and affinity estimation capabilities. Dotmatics launched Luma Agent in May 2026 to execute scientific workflows using structured and traceable data in its Luma platform. The company had also launched BioGlyph Luma in June 2025 for protein design and engineering, extending its platform into biologic design. The drug design tools market will continue to reward vendors that pair accessible tools with reliable data, validation, and integration.
Drug Designing Tools Industry Leaders
-
Certara
-
Dassault Systèmes
-
OpenEye, Cadence Molecular Sciences
-
Schrödinger, Inc.
-
Siemens AG (Dotmatics Ltd.)
- *Disclaimer: Major Players sorted in no particular order
Drug Designing Tools Market Companies Covered in this Report
- Acellera
- Benchling, Inc.
- BioSolveIT
- Certara
- ChemAxon Ltd.
- Chemical Computing Group
- Cresset
- Dassault Systèmes
- Enamine
- Genedata
- Merck
- OpenEye, Cadence Molecular Sciences
- Recursion
- Schrödinger, Inc.
- Siemens AG (Dotmatics Ltd.)
- Simulations Plus
- StarDrop
- Sygnature Discovery Limited
Recent Industry Developments in Drug Designing Tools Market
- July 2026: Schrödinger launched the early-access version of Bunsen, its agentic AI co-scientist capable of autonomously executing multi-step molecular discovery workflows across docking, free energy perturbation, ADMET prediction, and molecular dynamics in a natural-language interface. The platform is co-engineered with NVIDIA BioNeMo and Google Cloud, with full commercial release expected by end-2026.
- July 2026: Bristol Myers Squibb announced plans to deploy an NVIDIA DGX SuperPOD built on DGX Vera Rubin NVL72 systems, positioning it as the most powerful AI factory in life sciences. The infrastructure will support next-generation biosimulation foundation models trained on BMS's decades of proprietary data, directly advancing its "Predict First" strategy that applies AI-generated predictions to every small-molecule discovery program.
- July 2026: Certara announced a strategic partnership with NVIDIA to integrate the BioNeMo Agent Toolkit into its open, integrated AI platform, combining Certara's biosimulation models, regulatory datasets, and scientific expertise with NVIDIA's agentic AI framework to accelerate drug discovery and clinical decision-making.
Global Drug Designing Tools Market Report Scope
As per the scope of the report, drug design tools are computational software platforms that assist researchers in discovering, designing, and optimizing drug candidates by analyzing molecular structures, biological targets, and drug-target interactions. These tools use technologies such as molecular modeling, molecular docking, virtual screening, and artificial intelligence (AI) to accelerate drug discovery, reduce development costs, and improve the likelihood of identifying effective therapeutics.
The drug designing tools market is segmented by tool type, deployment mode, application, end user, and geography. By tool type, the market is divided into molecular modeling tools, molecular docking tools, virtual screening tools, AI/ML-based drug design tools, and other tools. By deployment mode, the market includes on-premises, cloud-based, and hybrid solutions. By application, the market is categorized into target identification and validation, hit identification and screening, lead optimization, drug repurposing, and other applications. By end user, the market covers pharmaceutical companies, biotechnology companies, contract research organizations (CROs), academic and research institutes, and other end users. The report also analyzes the market across North America, Europe, Asia-Pacific, the Middle East and Africa, and South America. Market size and forecasts are provided in terms of value (USD).
Segmentation Overview
| Molecular Modeling Tools |
| Molecular Docking Tools |
| Virtual Screening Tools |
| AI/ML-Based Drug Design Tools |
| Other Tools (SAR Tools and Pharmacophore Modeling Tools, Among Others) |
| On-Premises |
| Cloud-Based |
| Hybrid |
| Target Identification & Validation |
| Hit Identification & Screening |
| Lead Optimization |
| Drug Repurposing |
| Other Applications (Toxicity Assessment and Candidate Prioritization, Among Others) |
| Pharmaceutical Companies |
| Biotechnology Companies |
| Contract Research Organizations (CROs) |
| Academic & Research Institutes |
| Others (Government Research Organizations and Non-Profit Research Institutes, Among Others) |
| North America | United States |
| Canada | |
| Mexico | |
| Europe | Germany |
| United Kingdom | |
| France | |
| Italy | |
| Spain | |
| Rest of Europe | |
| Asia-Pacific | China |
| Japan | |
| India | |
| South Korea | |
| Australia | |
| Rest of Asia-Pacific | |
| Middle East and Africa | GCC |
| South Africa | |
| Rest of Middle East and Africa | |
| South America | Brazil |
| Argentina | |
| Rest of South America |
| By Tool Type | Molecular Modeling Tools | |
| Molecular Docking Tools | ||
| Virtual Screening Tools | ||
| AI/ML-Based Drug Design Tools | ||
| Other Tools (SAR Tools and Pharmacophore Modeling Tools, Among Others) | ||
| By Deployment Mode | On-Premises | |
| Cloud-Based | ||
| Hybrid | ||
| By Application | Target Identification & Validation | |
| Hit Identification & Screening | ||
| Lead Optimization | ||
| Drug Repurposing | ||
| Other Applications (Toxicity Assessment and Candidate Prioritization, Among Others) | ||
| By End User | Pharmaceutical Companies | |
| Biotechnology Companies | ||
| Contract Research Organizations (CROs) | ||
| Academic & Research Institutes | ||
| Others (Government Research Organizations and Non-Profit Research Institutes, Among Others) | ||
| By Geography | North America | United States |
| Canada | ||
| Mexico | ||
| Europe | Germany | |
| United Kingdom | ||
| France | ||
| Italy | ||
| Spain | ||
| Rest of Europe | ||
| Asia-Pacific | China | |
| Japan | ||
| India | ||
| South Korea | ||
| Australia | ||
| Rest of Asia-Pacific | ||
| Middle East and Africa | GCC | |
| South Africa | ||
| Rest of Middle East and Africa | ||
| South America | Brazil | |
| Argentina | ||
| Rest of South America | ||
Key Questions Answered in the Report
What is the projected value of drug designing tools in 2032?
The Drug designing tools market is projected to reach USD 6.12 billion by 2032, with an 8.39% CAGR from 2027 to 2032.
Which tool type is growing fast for drug discovery?
AI/ML-based drug design tools are forecast to grow at an 11.06% CAGR through 2032.
Why do pharmaceutical companies use molecular modeling software?
Molecular modeling supports 3D structural analysis, atomistic simulation, binding-site characterization, and lead optimization decisions.
Which deployment mode has the largest role in drug design software?
On-premises infrastructure held 47.78% of deployment revenue in 2026 because research teams seek strong control over proprietary molecular data.
Which application is growing fastest in computational drug design?
Drug repurposing is forecast to grow at a 9.83% CAGR through 2032 as multi-omics and computational target repositioning become more useful.
Which region is expanding fastest for drug designing tools?
Asia-Pacific is forecast to grow at 10.62% CAGR through 2032, supported by expanding artificial intelligence research capacity and regional biopharma activity.