
Cross-Border E-Commerce Customs Clearance Services Market Size and Share
Market Overview
| Study Period | 2020 - 2031 |
|---|---|
| Market Size (2026) | USD 13.88 Billion |
| Market Size (2031) | USD 20.20 Billion |
| Growth Rate (2026 - 2031) | 7.80 % |
| Fastest Growing Market | Asia-Pacific |
| Largest Market | Asia-Pacific |
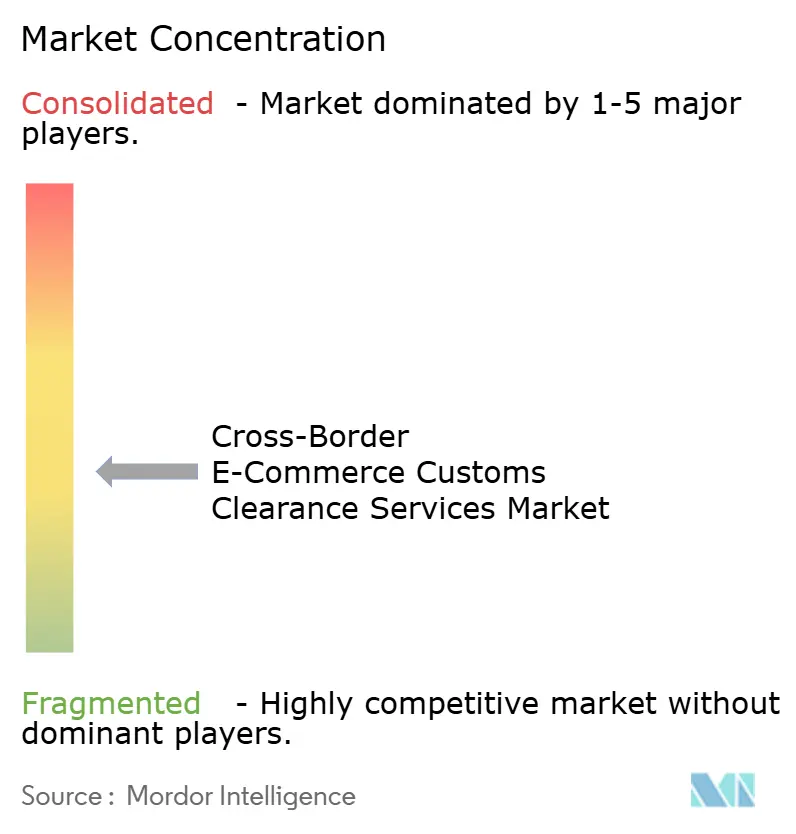
| Market Concentration | Medium |
Major Players *Disclaimer: Major Players sorted in no particular order Image © Mordor Intelligence. Reuse requires attribution under CC BY 4.0. | |
Cross-Border E-Commerce Customs Clearance Services Market Analysis by Mordor Intelligence
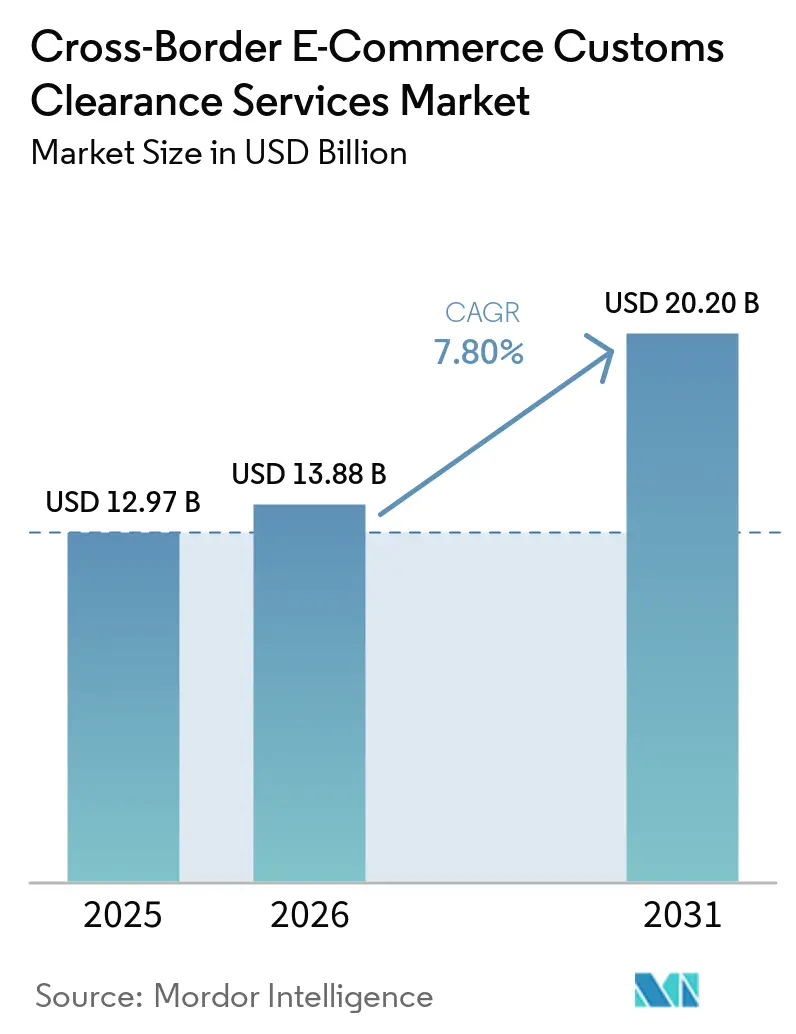
The cross-border e-commerce customs clearance services market size was valued at USD 12.97 billion in 2025 and is estimated to grow from USD 13.88 billion in 2026 to reach USD 20.20 billion by 2031, at a CAGR of 7.80% during the forecast period (2026-2031).
The cross-border e-commerce customs clearance services market is being reshaped by the end of duty-free treatment for many low-value shipments in the United States and the European Union. The United States suspended duty-free de minimis treatment for all countries from August 2025, which moved more parcels into formal entry processes.[1] The European Union applied a EUR 3 or USD 3.25 flat duty to certain low-value consignments from July 2026, increasing the need for duty calculation and entry preparation. Providers with broker licenses, bonded facilities, and structured pre-arrival submission capabilities are better placed to manage the resulting workloads. Tariff changes, uneven country rules, and higher processing costs continue to limit the scalability of simpler service models.
Key Report Takeaways
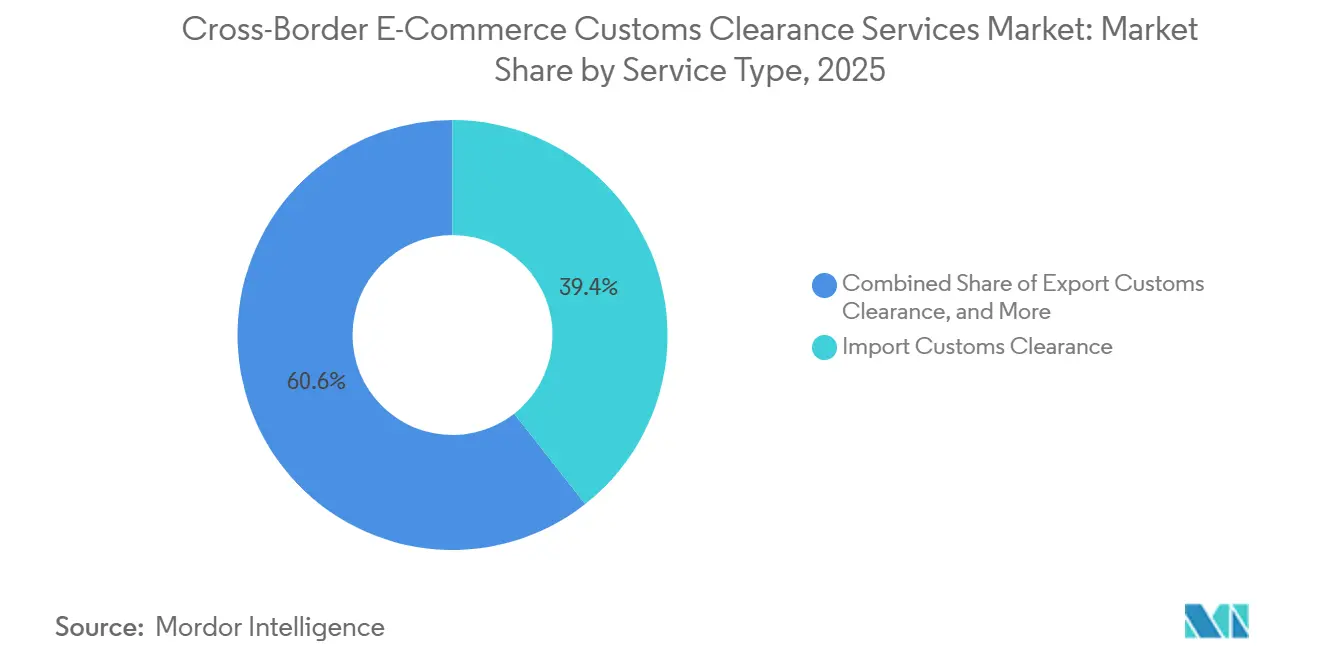
- By service type, import customs clearance held 39.40% of the cross-border e-commerce customs clearance services market share in 2025, while customs compliance and advisory recorded the highest projected CAGR at 9.50% through 2031.
- By business model, B2C held 53.69% of the cross-border e-commerce customs clearance services market size in 2025, while the same segment also recorded the highest projected CAGR at 9.34% through 2031.
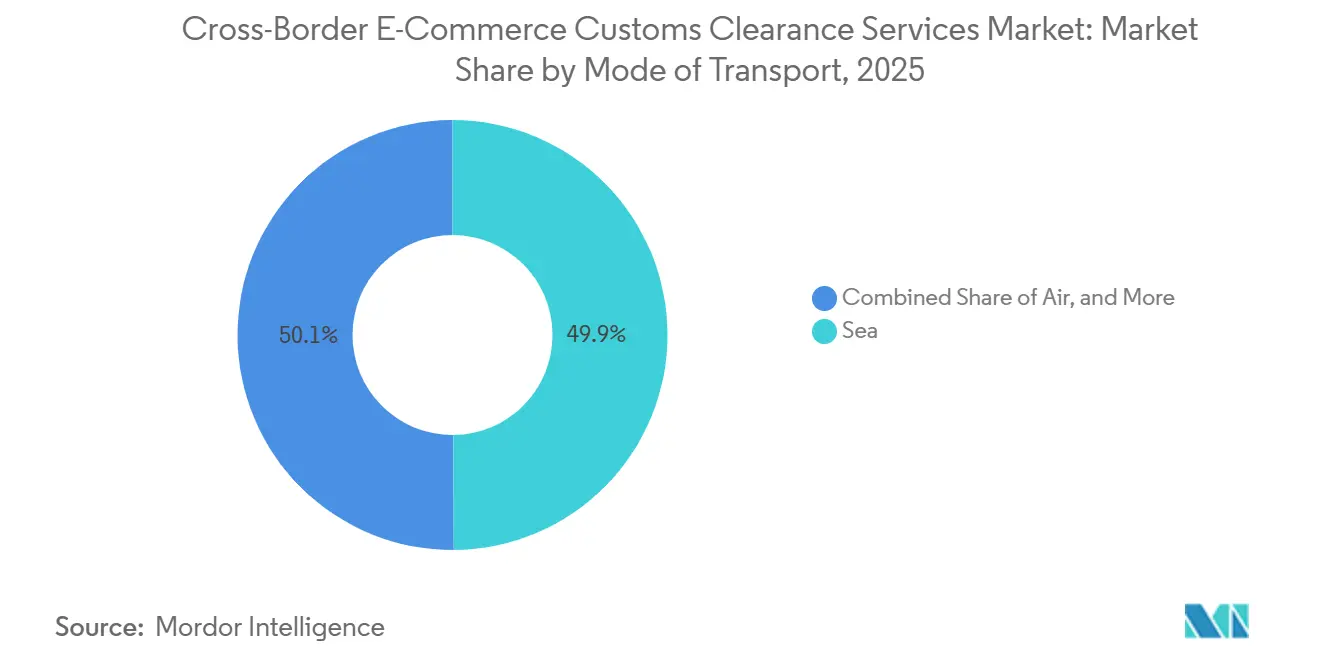
- By mode of transport, sea freight held 49.90% of the cross-border e-commerce customs clearance services market size in 2025, while air freight recorded the highest projected CAGR at 9.45% through 2031.
- By product category, apparel and footwear held 21.50% of the cross-border e-commerce customs clearance services market share in 2025, while health, beauty, and personal care recorded the highest projected CAGR at 8.98% through 2031.
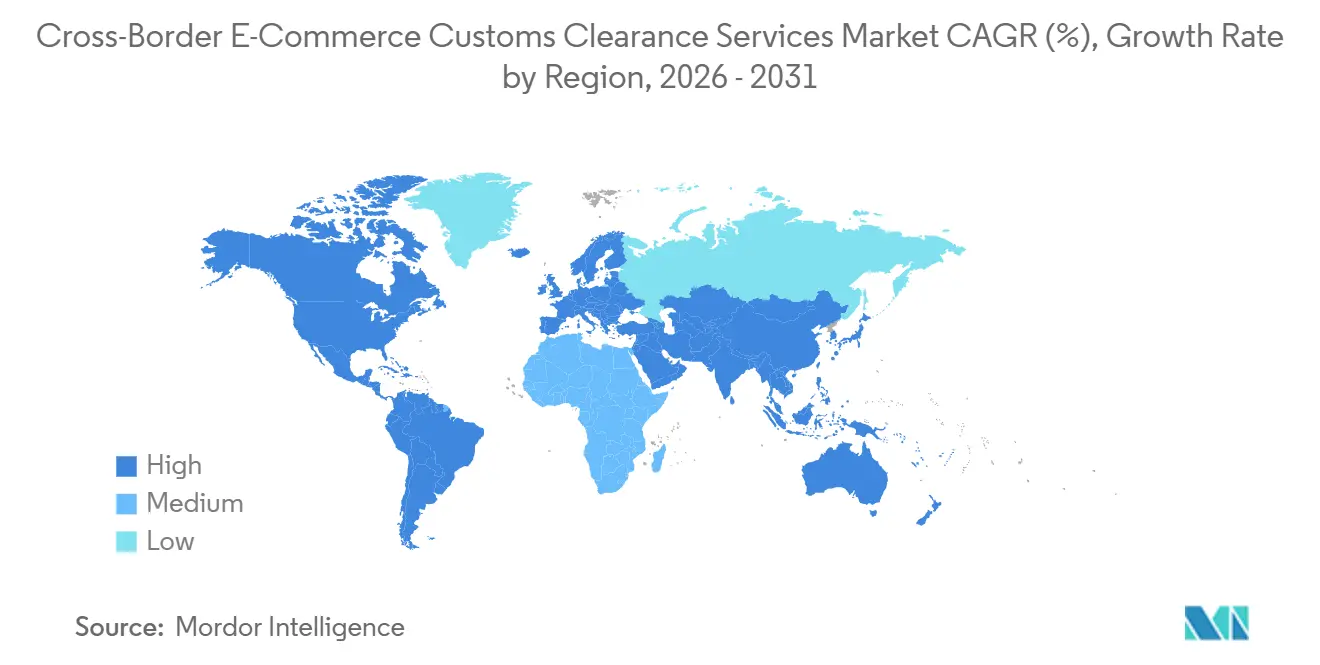
- By geography, Asia-Pacific held 31.40% of the cross-border e-commerce customs clearance services market share in 2025 and recorded the highest projected CAGR at 9.52% through 2031.
Note: Market size and forecast figures in this report are generated using Mordor Intelligence’s proprietary estimation framework, updated with the latest available data and insights as of January 2026.
Global Cross-Border E-Commerce Customs Clearance Services Market Trends and Insights
Drivers Impact Analysis*
| Driver | (~) % Impact on CAGR Forecast | Geographic Relevance | Impact Timeline |
|---|---|---|---|
| Cross-Border Parcel Volume Expansion | +1.8% | Global, concentrated in Asia-Pacific and North America | Short term (≤ 2 years) |
| Mandatory Duty-Paid and Formal-Entry Workflows | +1.5% | Global, most acute in North America and Europe | Short term (≤ 2 years) |
| Marketplace and Direct-to-Consumer Internationalization | +0.9% | Global, Asia-Pacific exporters reaching North America and Europe | Medium term (2-4 years) |
| Structured Pre-Arrival Data and Platform Accountability | +0.7% | Europe, North America, Asia-Pacific core, spillover to Middle East and Africa | Medium term (2-4 years) |
| SME Adoption of Outsourced Customs Operations | +0.5% | Global, most visible in ASEAN, India, and South America | Medium term (2-4 years) |
| Automated Classification and Landed-Cost Automation | +0.4% | Global | Long term (≥ 4 years) |
| Source: Mordor Intelligence | |||
Cross-Border Parcel Volume Expansion
The cross-border e-commerce customs clearance services market benefits from continued growth in parcel movements between origin and destination countries. Asia-Pacific accounted for nearly two-thirds of global e-commerce sales, according to the Asian Development Bank[2]. This concentration increases the need for customs documentation, duty calculation, and pre-arrival filing in the region's export corridors. Customs authorities face capacity limits as parcel volumes rise, which creates demand for licensed providers that can prepare formal entries and operate bonded storage. China's April 2026 trade facilitation action plan introduced 29 measures across 45 cities to improve clearance speed, compliance costs, and certificate issuance. These measures support a larger upstream flow of parcels entering organized export channels.
Mandatory Duty-Paid and Formal-Entry Workflows
The cross-border e-commerce customs clearance services market is gaining traction from parcels that now require formal processing. The United States ended duty-free de minimis treatment for China and Hong Kong in May 2025 and extended the suspension to all countries in August 2025[3]. The United States Customs and Border Protection reported that de minimis shipment volumes declined from 1.36 billion in FY2024 to 942.5 million in FY2025. The remaining shipments require more detailed classification, duty payment, and filing activity. The European Union's USD 3.25 flat duty for eligible low-value consignments adds a separate processing requirement for goods entering its customs area. The Import Control System 2 requires advanced cargo information across road, rail, air, maritime, and postal transport, making accurate data submission central to clearance operations.
Marketplace and Direct-to-Consumer Internationalization
Brands selling through direct-to-consumer channels need localized customs support when they enter new destination countries. India's April 2026 reforms removed the INR 10 lakh or USD 11,800 per-consignment value cap for courier exports and simplified documentation for MSME sellers. India's August 2026 inventory-based framework also allowed eligible exporters to manage overseas inventory while using organized customs arrangements. The Cross-border e-commerce customs clearance services market, therefore, has a wider customer base among sellers that need importer-of-record services, advance duty calculations, and product documentation. The European Union's customs reform makes electronic commerce platforms responsible for duties and customs formalities when they sell goods into the Union. This responsibility supports longer-term compliance and advisory work for platforms that need local representation and approved procedures.
Automated Classification and Landed-Cost Automation
The cross-border e-commerce customs clearance services market increasingly relies on automated systems for classification and landed-cost calculations. The World Customs Organization reported that advanced analytics and automation could support routine processing, risk assessment, and trade facilitation. These systems are useful when a broker manages a high volume of products with varying tariff treatments. Accurate classification is also important because tariff programs and country-specific documents raise the financial risk of filing errors. Check out duty estimates, automated product coding, and document validation form connected parts of the same service process. Providers that maintain current tariff data and integrate it with customer workflows can reduce manual handling. Smaller providers without these capabilities face more difficulty managing rapid changes in entry rules.
Restraints Impact Analysis*
| Restraint | (~) % Impact on CAGR Forecast | Geographic Relevance | Impact Timeline |
|---|---|---|---|
| Tariff Volatility and Duty Stacking | -1.2% | Global, acute in North America and Asia-Pacific | Short term (≤ 2 years) |
| Poor SKU-Level Data and Misclassification Liability | -0.8% | Global | Medium term (2-4 years) |
| Fragmented Country Rules and Licensing Requirements | -0.6% | Asia-Pacific, South America, Middle East and Africa | Long term (≥ 4 years) |
| Postal and Carrier Exception-Handling Bottlenecks | -0.4% | Global, concentrated in postal-heavy markets | Short term (≤ 2 years) |
| Source: Mordor Intelligence | |||
Tariff Volatility and Duty Stacking
Frequent tariff changes increase the workload for providers that manage cross-border entries. The World Trade Organization stated in 2025 that wider trade policy uncertainty could reduce global merchandise trade volumes by up to 1.5 percentage points[4]. Changes in origin rules, product tariffs, and country rates make static compliance databases less reliable. Brokers may need to conduct post-entry corrections or duty refund work after the rules change. This work can raise revenue but also increase operating costs and customer uncertainty. Providers that guarantee landed costs at checkout face direct exposure when their duty schedules do not reflect the latest treatment.
Fragmented Country Rules and Licensing Requirements
Different national rules raise the cost of offering a uniform customs service across markets. The European Union's 2026 customs reform places new responsibilities on platforms selling goods from outside the Union. India's 2026 inventory framework requires organized digital records and compliance controls for eligible exporters. Brazil and Argentina maintain different valuation, licensing, and fiscal documentation requirements for imported parcels. These differences increase the expense of local representation, system connections, and staff training. The Cross-border e-commerce customs clearance services market favors providers that combine local licenses with cross-country operational systems. Smaller technology-led providers may find it difficult to add country coverage at the same pace as established brokers.
*Our forecasts treat driver/restraint impacts as directional, not additive. The impact forecasts reflect baseline growth, mix effects, and variable interactions.
Segment Analysis
By Service Type: Import Volumes Support Integrated Clearance Services
Import customs clearance held 39.40% of the cross-border e-commerce customs clearance services market share in 2025. The segment reflects the large flow of consumer goods from Asian manufacturing centers to North America, Europe, and the Middle East. The change in low-value entry treatment in the United States and Europe has increased the number of shipments needing classification, duty payment, and broker submission. Export customs clearance is the next major activity because sellers need support with origin documentation and outbound declarations. India's courier export reforms and China's trade facilitation measures help move more exports through organized clearance channels. Transit and in-bond clearance serve specialized routes where cargo passes through an intermediate market without domestic entry.
Customs compliance and advisory has the highest forecast CAGR at 9.50% from 2026 to 2031. This service supports classification, country-of-origin assessment, tariff treatment, and compliance planning for shipments that no longer qualify for simplified treatment. The European customs reform raises the value of advisory support for platforms that take responsibility for import formalities. Duty and tax management is becoming more closely linked to advisory work because landed-cost programs need current duty data and post-entry reconciliation. Providers with both brokerage and advisory capability can manage the complete filing cycle. This creates a stronger service proposition than a basic document-submission model.

By Business Model: B2C Continues to Lead Formal Entry Demand
B2C held 53.69% of the cross-border e-commerce customs clearance services market size in 2025 and has the highest forecast CAGR at 9.34% through 2031. De minimis reform reduced some direct parcel flows into the United States, but the shipments that remain generate customs revenue per formal entry. The United States Customs and Border Protection recorded a decline in air freight bills of lading from 1.1 billion in FY2024 to 794.8 million in FY2025. High-volume sellers are also moving inventory into destination-country warehouses before individual orders are fulfilled. This shift creates demand for bonded warehousing, bulk import entries, and periodic customs processing. It also moves some B2C clearance work from the final parcel to the upstream inventory shipment.
B2B services support merchants moving stock to regional distribution centers for local fulfillment. This model is gaining relevance as brands alter fulfillment patterns after the United States and European policy changes. C2C is smaller by share, but digital platforms are incorporating duty calculation and documentation into their checkout processes. The European Union's approach places platform responsibility closer to the point of sale for many imports. That shift increases the role of outsourced customs support for marketplaces. It also makes compliance capability a practical requirement for cross-border peer-to-peer commerce.
By Mode of Transport: Sea Freight Leads While Air Freight Grows Fastest
Sea freight accounted for 49.90% of the cross-border e-commerce customs clearance services market share in 2025. Brands use sea freight to replenish inventory in bonded facilities located near major consumer markets. The approach became more relevant as high-volume sellers reduced their reliance on individual low-value parcel entries. Sea freight clearance often involves consolidated loads, warehouse entries, and documented onward distribution. Road freight is a major mode along the United States and Mexico border, where manufacturing and nearshoring activity support truck-based customs movements. The United States Customs and Border Protection data showed road freight bills of lading declined from 174.2 million in FY2024 to 141.6 million in FY2025.
Air freight recorded the highest forecast CAGR at 9.45% from 2026 to 2031. It serves time-sensitive categories such as health and beauty, electronics, and premium apparel, where 5-to-10-day delivery remains important. Postal flows also fell after the suspension of duty-free treatment, with postal bills of lading declining from 74.8 million to 68.6 million over the same period. Rail and multimodal transport remain smaller but important for corridors that combine sea, air, and inland movement. Such routes require coordinated data exchange between carriers, terminals, and brokers. The cross-border e-commerce customs clearance services industry benefits where providers can manage these handoffs without repeating documentation.
By Product Category: Apparel Leads While Health and Beauty Builds Clearance Demand
Apparel and footwear held 21.50% of the cross-border e-commerce customs clearance services market size in 2025. Its position reflects the scale of Asian fast-fashion platforms and direct-to-consumer sales by Western brands. The category has recurring valuation, textile classification, and labeling requirements across destination countries. These rules sustain demand for classification support and post-entry advisory work. Consumer electronics and electrical products are the second-largest category because they have high declared values and detailed certification needs. Product coding errors can be costly because electronics use granular customs subheadings.
Health, beauty, and personal care have the highest forecast CAGR at 8.98% through 2031. Cross-border demand for cosmetics, supplements, and skincare products increases the need for product safety documentation and country-specific import checks. China's customs authorities introduced a 2026 green-channel pilot for selected beauty products, supplements, and baby formula at Shanghai Pudong and Guangzhou Baiyun airports. Food and beverages, home and household products, and industrial goods have their own import requirements. Food and agricultural goods can involve the United States Food and Drug Administration and the United States Department of Agriculture requirements. These controls preserve the importance of specialized clearance work across lower-volume categories.
Geography Analysis
Asia-Pacific held 31.40% of the cross-border e-commerce customs clearance services market share in 2025 and has the highest forecast CAGR at 9.52% through 2031. The region combines large export manufacturing bases with rising consumer imports. China, India, South Korea, Japan, and Southeast Asian economies contribute different origin and destination flows. China's trade facilitation program supports faster clearance, lower compliance costs, and improved certificate issuance across 45 cities. India has made policy changes that support organized courier exports and inventory-based cross-border selling.
North America is the second-largest regional market within the Cross-border e-commerce customs clearance services market. The United States suspension of de minimis treatment changed the entry profile for low-value shipments. The declared value of the United States-bound de minimis shipments declined from USD 64.6 billion in FY2024 to USD 48.1 billion in FY2025. The remaining flows create more formal entry activity per shipment. Mexico supports continuing demand along the United States and Mexico corridor through its role in nearshoring and regional distribution.
Europe has a significant share because it receives large volumes of parcels from China and other Asian exporters. The USD 3.25 flat duty, wider Import Control System 2 coverage, and customs reform have increased both formal entry requirements and advisory needs. Germany, the United Kingdom, and France require country-specific knowledge of product safety, tax reporting, and authorized trader procedures. South America, the Middle East, and Africa are smaller but growing areas where local licensing and valuation rules support demand for specialist customs providers.
Competitive Landscape
The cross-border e-commerce customs clearance services market is moderately fragmented. Integrated logistics providers, specialist brokers, and software-enabled compliance providers compete across overlapping service areas. A.P. Moller - Maersk, DSV, and Kuehne + Nagel use forwarding networks to bundle transportation and customs services. This model links pre-arrival data, bonded clearance, and post-entry audit work within one customer relationship. Customs Support Group and Livingston International have positions in complex North American and European trade routes where local licenses and advisory expertise are important.
A.P. Moller - Maersk expanded its Trade & Tariff Studio in August 2026 to improve customs management and tariff classification capabilities. In April 2026, Maersk partnered with Altana on a digital trade network focused on compliance and product traceability. C.H. Robinson opened a South Texas logistics center in May 2026 to expand cross-border capability for Mexico-to-United States produce shipments. These moves show that network presence and customs capability are being developed together. Providers that can connect freight operations with customs data have a practical advantage in complex shipments.
Technology-focused providers compete by placing duty calculation, product classification, and pre-arrival data submission inside checkout and booking systems. This approach is most relevant for standard clearances that do not need extensive manual review. The main opportunity lies with SMEs selling into 5 to 15 destination markets that need more support than a self-service tool provides.
Cross-Border E-Commerce Customs Clearance Services Industry Leaders
-
DHL Group
-
United Parcel Service of America, Inc. (UPS)
-
Kuehne+Nagel
-
Expeditors International of Washington, Inc.
-
FedEx
- *Disclaimer: Major Players sorted in no particular order
Recent Industry Developments
- July 2026: FedEx Corporation signed a Memorandum of Understanding with Delivered Korea, a cross-border shopping and fulfillment provider specializing in K-culture goods, to support Korean businesses expanding exports to the United States and Europe, with integrated customs clearance specialists embedded in the fulfillment arrangement.
- May 2026: FedEx Corporation signed a Memorandum of Understanding with COKODIVE, a global K-content commerce platform with over 3 million international customers, to expand K-content product exports with access to FedEx's customs clearance specialists and global fulfillment infrastructure.
- May 2026: C.H. Robinson Worldwide opened a 142,600 ft² produce logistics center in South Texas, positioned near the United States and Mexico border, to expand cross-border customs clearance and cold chain logistics capabilities for fresh produce shipments from Mexico to the United States.
- April 2026: A.P. Moller - Maersk partnered with Altana to build the first digital trade network within a major global logistics infrastructure, creating trade compliance and product-level traceability recognized by customs authorities across 12 international ports handling 70% of global trade, deployed first within the Gemini Cooperation.
Global Cross-Border E-Commerce Customs Clearance Services Market Report Scope
| Import Customs Clearance |
| Export Customs Clearance |
| Transit & In-Bond Customs Clearance |
| Duty & Tax Management |
| Customs Compliance & Advisory |
| Other Customs Clearance Services |
| Business-to-Business (B2B) |
| Business-to-Consumer (B2C) |
| Consumer-to-Consumer (C2C) |
| Air |
| Sea |
| Cross-Border Road |
| Rail |
| Postal Network |
| Multimodal |
| Apparel & Footwear |
| Automotive Parts & Accessories |
| Consumer Electronics & Electrical Products |
| Food & Beverages |
| Health, Beauty & Personal Care |
| Home & Household Products |
| Industrial & Commercial Products |
| Other Product Categories |
| North America | United States |
| Canada | |
| Mexico | |
| South America | Brazil |
| Argentina | |
| Peru | |
| Chile | |
| Rest of South America | |
| Europe | Germany |
| United Kingdom | |
| France | |
| Italy | |
| Spain | |
| Russia | |
| Nordics (Denmark, Finland, Iceland, Norway, and Sweden) | |
| Rest of Europe | |
| Asia-Pacific | China |
| India | |
| Japan | |
| South Korea | |
| Australia | |
| Southeast Asia (ASEAN) | |
| Rest of Asia-Pacific | |
| Middle East and Africa | Saudi Arabia |
| United Arab Emirates | |
| Qatar | |
| South Africa | |
| Nigeria | |
| Egypt | |
| Rest of Middle East and Africa |
| By Service Type | Import Customs Clearance | |
| Export Customs Clearance | ||
| Transit & In-Bond Customs Clearance | ||
| Duty & Tax Management | ||
| Customs Compliance & Advisory | ||
| Other Customs Clearance Services | ||
| By Business Model | Business-to-Business (B2B) | |
| Business-to-Consumer (B2C) | ||
| Consumer-to-Consumer (C2C) | ||
| By Mode of Transport | Air | |
| Sea | ||
| Cross-Border Road | ||
| Rail | ||
| Postal Network | ||
| Multimodal | ||
| By Product Category | Apparel & Footwear | |
| Automotive Parts & Accessories | ||
| Consumer Electronics & Electrical Products | ||
| Food & Beverages | ||
| Health, Beauty & Personal Care | ||
| Home & Household Products | ||
| Industrial & Commercial Products | ||
| Other Product Categories | ||
| By Geography | North America | United States |
| Canada | ||
| Mexico | ||
| South America | Brazil | |
| Argentina | ||
| Peru | ||
| Chile | ||
| Rest of South America | ||
| Europe | Germany | |
| United Kingdom | ||
| France | ||
| Italy | ||
| Spain | ||
| Russia | ||
| Nordics (Denmark, Finland, Iceland, Norway, and Sweden) | ||
| Rest of Europe | ||
| Asia-Pacific | China | |
| India | ||
| Japan | ||
| South Korea | ||
| Australia | ||
| Southeast Asia (ASEAN) | ||
| Rest of Asia-Pacific | ||
| Middle East and Africa | Saudi Arabia | |
| United Arab Emirates | ||
| Qatar | ||
| South Africa | ||
| Nigeria | ||
| Egypt | ||
| Rest of Middle East and Africa | ||
Key Questions Answered in the Report
What is the value of the cross-border e-commerce customs clearance services market in 2026?
The cross-border e-commerce customs clearance services market was valued at USD 13.88 billion in 2026 and is forecast to reach USD 20.20 billion by 2031. This gives the cross-border e-commerce customs clearance services market a 7.80% CAGR for 2026 to 2031.
What is driving clearance demand in the cross-border e-commerce customs clearance services market?
Within the cross-border e-commerce customs clearance services market, the suspension of de minimis treatment in the United States and new European duty requirements are moving more shipments into formal clearance procedures.
Which service type has the largest share?
In the cross-border e-commerce customs clearance services market, import customs clearance held 39.40% share in 2025.
Which business model leads cross-border customs services?
In the cross-border e-commerce customs clearance services market, B2C held 53.69% share in 2025 and also has the highest forecast CAGR at 9.34% through 2031.
Which transport mode is expanding the fastest?
For the cross-border e-commerce customs clearance services market, air freight has the highest forecast CAGR at 9.45% through 2031.
Which region leads in customs clearance services?
Within the cross-border e-commerce customs clearance services market, Asia-Pacific held 31.40% share in 2025 and has the highest forecast CAGR at 9.52% through 2031.