
Chemical Imaging Systems For Manufacturing Market Size and Share
Market Overview
| Study Period | 2020 - 2031 |
|---|---|
| Market Size (2026) | USD 368.20 Million |
| Market Size (2031) | USD 588.89 Million |
| Growth Rate (2026 - 2031) | 9.85 % |
| Fastest Growing Market | Asia-Pacific |
| Largest Market | North America |
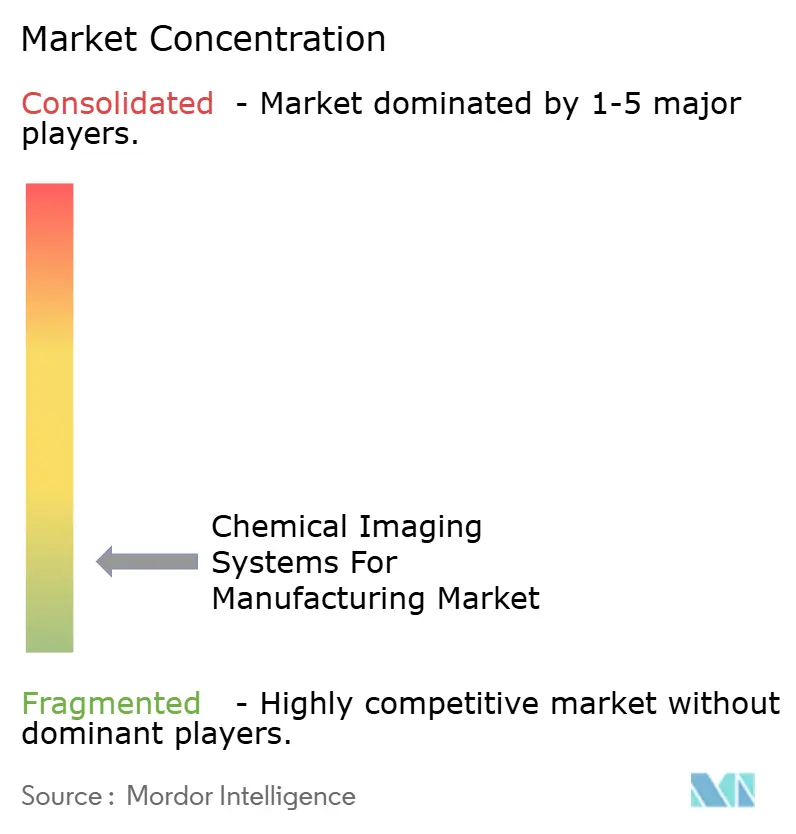
| Market Concentration | Low |
Major Players *Disclaimer: Major Players sorted in no particular order Image © Mordor Intelligence. Reuse requires attribution under CC BY 4.0. | |
Chemical Imaging Systems For Manufacturing Market Analysis by Mordor Intelligence
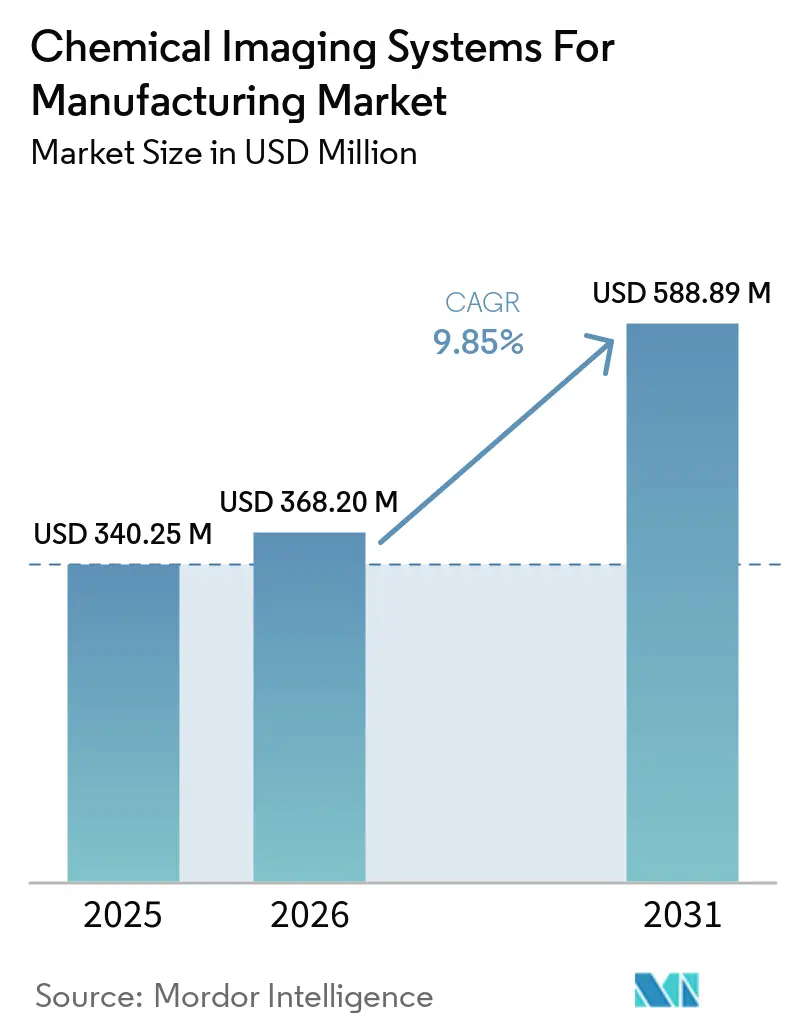
The chemical imaging systems for manufacturing market size was valued at USD 340.25 million in 2025 and estimated to grow from USD 368.20 million in 2026 to reach USD 588.89 million by 2031, at a CAGR of 9.85% during the forecast period (2026-2031). Demand is moving from periodic sample testing toward continuous chemical inspection during production. These systems combine chemical identification with location data, which helps manufacturers find defects, contaminants, and formulation changes without disrupting throughput. Traceability requirements are becoming more important in pharmaceutical, semiconductor, food, beverage, and advanced-material production. Suppliers are increasingly competing through integrated systems, validated performance, and software that can interpret spectral data quickly. The chemical imaging systems for manufacturing market also has opportunities in battery production, advanced semiconductor packaging, and manufacturing environments that require non-destructive inspection.
Key Report Takeaways
- By imaging modality, hyperspectral imaging held 31.72% of the chemical imaging systems for manufacturing market share in 2025, while Raman imaging is projected to expand at a 10.92% CAGR through 2031.
- By system configuration, inline systems held 34.63% of the chemical imaging systems for manufacturing market share in 2025, while integrated turnkey systems are expected to expand at a 11.84% CAGR through 2031.
- By application, in-process monitoring held 28.41% of revenue in 2025, while contamination and composition control is projected to expand at a 10.67% CAGR through 2031.
- By end-user industry, semiconductor and electronics accounted for 20.87% of revenue in 2025, while battery and energy materials are projected to expand at a 10.46% CAGR through 2031.
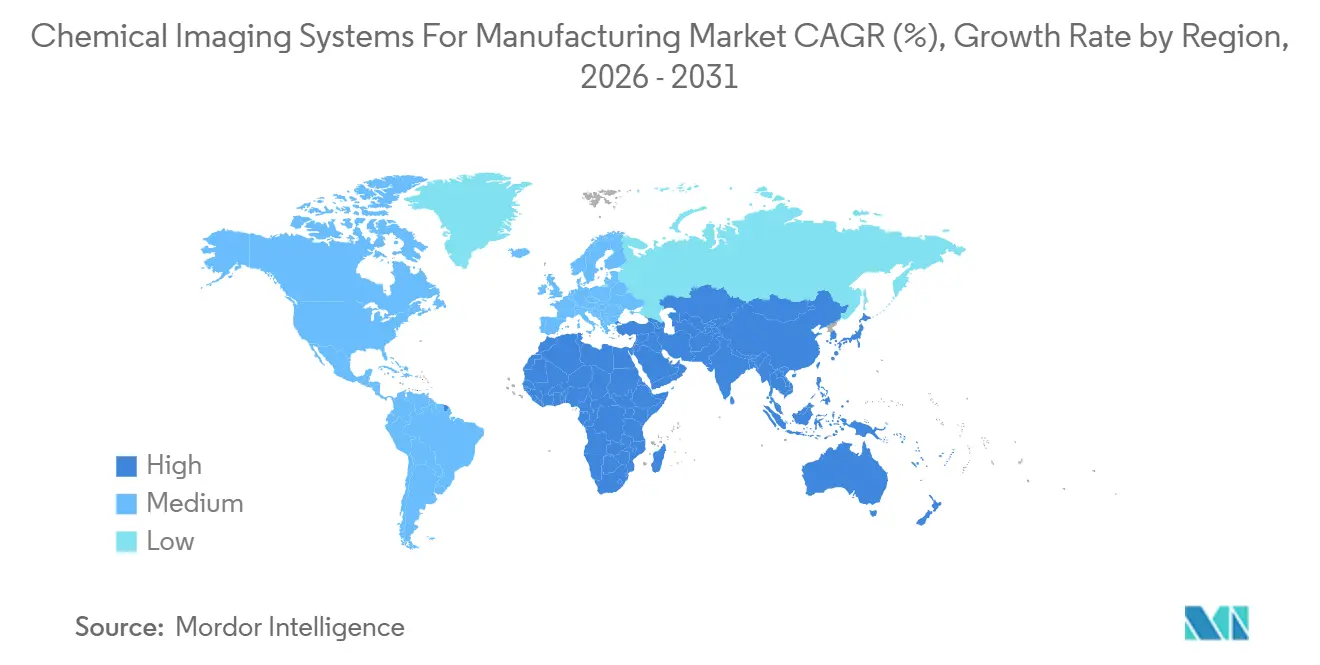
- By geography, North America held 32.64% of revenue in 2025, while Asia-Pacific is projected to expand at an 11.73% CAGR through 2031.
Note: Market size and forecast figures in this report are generated using Mordor Intelligence’s proprietary estimation framework, updated with the latest available data and insights as of January 2026.
Global Chemical Imaging Systems For Manufacturing Market Trends and Insights
Drivers Impact Analysis*
| Driver | (~) % Impact on CAGR Forecast | Geographic Relevance | Impact Timeline |
|---|---|---|---|
| Adoption of Inline Chemical Quality Control | +1.8% | Global, with early strength in North America and Europe and rapid uptake in Asia-Pacific battery and semiconductor hubs | Medium term (2-4 years) |
| Demand for Non-Destructive Manufacturing Inspection | +1.4% | Global, concentrated in semiconductor fabs in Asia-Pacific and North America and pharmaceutical plants in Europe and North America | Short term (≤ 2 years) |
| Expansion of Process Analytical Technology in Regulated Manufacturing | +1.1% | North America and Europe, with spillover to Asia-Pacific pharmaceutical clusters | Medium term (2-4 years) |
| Use of Artificial Intelligence for Spectral Classification | +0.9% | Global, led by Asia-Pacific and North America | Long term (≥ 4 years) |
| Complexity of Multilayer and Advanced Materials | +0.5% | North America, Europe, Japan, and South Korea | Medium term (2-4 years) |
| Need for Real-Time Chemical Mapping in Additive Manufacturing | +0.3% | North America and Europe | Long term (≥ 4 years) |
| Source: Mordor Intelligence | |||
Increasing Adoption of Inline Chemical Quality Control
Manufacturers are replacing periodic laboratory sampling with continuous chemical inspection across production lines. Inline systems can reduce the delay between a process deviation and corrective action. A 2025 study described how pushbroom hyperspectral imaging and variographic image analysis tracked the uniformity of pharmaceutical blends in real time. The method identified over-blending and de-mixing events that static samples could miss. This capability supports chemical traceability for automotive, semiconductor, and regulated pharmaceutical supply chains. The chemical imaging systems for the manufacturing market therefore benefit when plants seek full in-stream inspection and faster process feedback.
Rising Demand for Non-Destructive Manufacturing Inspection
Non-destructive inspection is being applied throughout production, rather than only during final-product verification. Manufacturers need speed, spatial resolution, and chemical specificity in the same workflow. A 2025 review found that conventional spectroscopic methods cannot always meet these requirements on their own in industrial settings. Chemical imaging can map surface and subsurface composition without contact, sample preparation, or material loss. This makes the systems suitable for continuous production environments. Semiconductor packaging, composite structures, and battery cells require this type of inspection, where conventional methods have limited access or may damage the sample.
Expansion of Process Analytical Technology in Regulated Manufacturing
The FDA describes process analytical technology as a framework for designing, analyzing, and controlling manufacturing through timely measurements of critical quality and performance attributes. The FDA’s 2025 Chemistry, Manufacturing, and Controls Development and Readiness Pilot also continued to support early discussion of modern manufacturing approaches.[1]U.S. Food and Drug Administration, “PAT: A Framework for Innovative Pharmaceutical Development, Manufacturing, and Quality Assurance,” U.S. Food and Drug Administration, fda.gov Chemical imaging can support these requirements through inline measurement and spatially detailed process monitoring. A 2025 review of pharmaceutical manufacturing identified cost, training, and cross-functional coordination as important barriers to broader PAT adoption. The remaining adoption gap creates room for systems that are easier to validate, deploy, and maintain in commercial facilities. The chemical imaging systems for the manufacturing market are positioned to benefit as regulated producers add continuous manufacturing capacity.
Growing Use of Artificial Intelligence for Spectral Classification
Artificial intelligence is increasing the practical value of spectral imaging in high-throughput manufacturing. A 2026 study found that deep recurrent neural networks outperformed CNN- and Transformer-based models for industrial-grade steel alloy classification using spectroscopic data. A 2025 study also reported 99% correlation between generated and ground-truth spectra in cross-modality materials characterization. These tools can shorten the time needed to create phase maps and classify materials. They can also reduce recalibration effort when product grades or raw material sources change. This matters for mid-sized manufacturers because calibration is a substantial operating cost in inline deployments.
Restraints Impact Analysis*
| Restraint | (~) % Impact on CAGR Forecast | Geographic Relevance | Impact Timeline |
|---|---|---|---|
| High Capital Cost of Chemical Imaging Systems | -1.0% | Global, most acute in South America, Africa, and small and medium-sized manufacturing clusters in Southeast Asia | Short term (≤ 2 years) |
| Management of High-Volume Spectral Data | -0.6% | Global, concentrated in high-throughput inline deployments in Asia-Pacific and North America | Medium term (2-4 years) |
| Calibration Drift Across Production Environments | -0.3% | Global, especially high-temperature and high-vibration chemical processing and additive manufacturing sites | Short term (≤ 2 years) |
| Limited Interoperability With Factory-Control Systems | -0.2% | Global, particularly legacy plants in Europe and South America | Long term (≥ 4 years) |
| Source: Mordor Intelligence | |||
High Capital Cost of Chemical Imaging Systems
Fully integrated inline hyperspectral and Raman systems require spending on hardware, software, calibration, and production-line integration. This requirement can exceed the discretionary equipment budgets of manufacturers outside the largest industrial groups. A 2025 pharmaceutical manufacturing review identified cost, training, and cross-departmental support as key constraints on PAT adoption. These conditions can extend procurement cycles, especially in South America and Africa. They can also favor established vendors that have service networks and flexible commercial models. Portable and at-line configurations lower the barrier to entry, but they do not provide the full coverage of inline surveillance.
Complex Management of High-Volume Spectral Data
Inline chemical imaging produces large volumes of hyperspectral information during normal production. A 2025 review identified on-the-fly compression, feature selection, and historical image storage as unresolved challenges in industrial hyperspectral imaging. Facilities that install imaging hardware without suitable analytical pipelines may not achieve planned utilization. This gap can increase total ownership costs and delay capital approval. It also reinforces demand for systems that integrate hardware, software, data handling, and factory connectivity into a single validated package.
*Our forecasts treat driver/restraint impacts as directional, not additive. The impact forecasts reflect baseline growth, mix effects, and variable interactions.
Segment Analysis
By Imaging Modality: Hyperspectral Platforms Define the Baseline
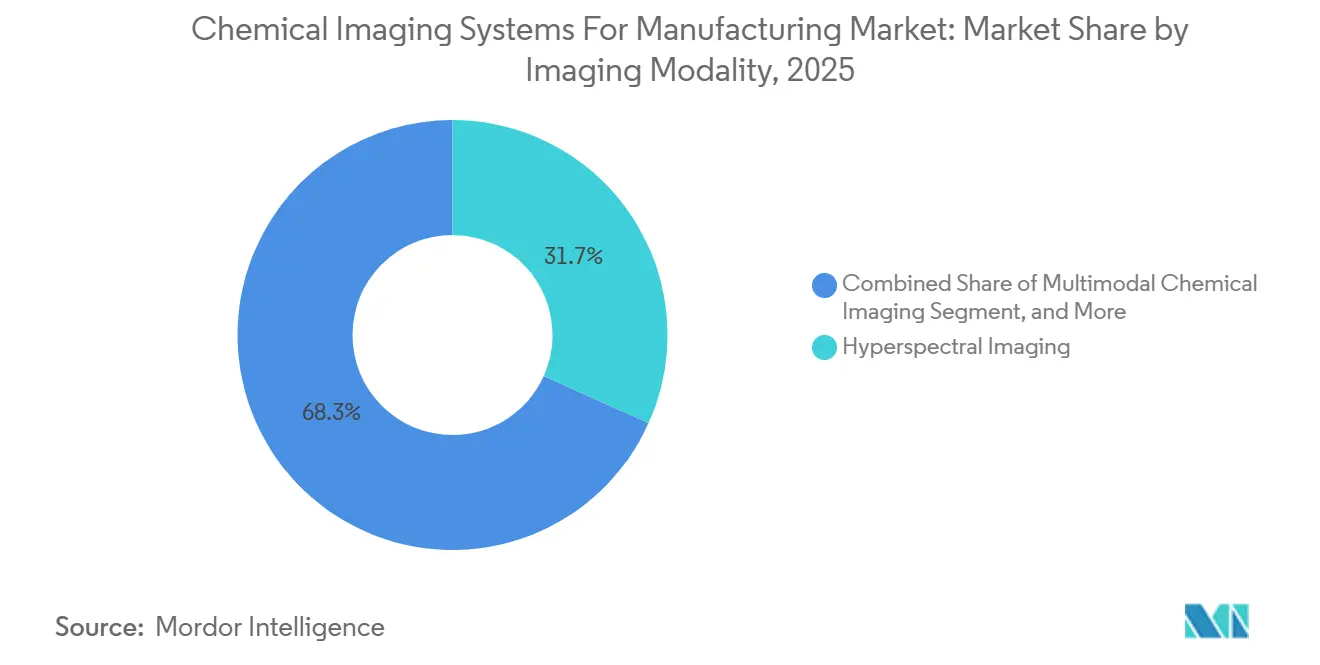
Hyperspectral imaging accounted for 31.72% of chemical imaging systems in the manufacturing market in 2025. The technology captures multiple spectral bands simultaneously and does not require prior knowledge of the target chemistry. This makes it useful for raw material screening, blend uniformity checks, and recycling classification. These uses often involve feedstocks with changing composition. Infrared and Fourier-transform infrared imaging held the next-largest position in the modality group. They provide strong chemical specificity for organic and polymer materials, but diffraction limits can constrain their use in sub-5 μm inspection.
Raman imaging is projected to advance at a 10.92% CAGR from 2026 to 2031. Its compatibility with aqueous environments supports biopharmaceutical monitoring and battery electrolyte analysis. HORIBA and Fujifilm announced a high-sensitivity inline Raman system in June 2026 for continuous monitoring in cell culture and purification. Their demonstration tests reported a 10% improvement in antibody yield during purification compared with conventional UV-Vis process control. Smaller O-PTIR installations provide submicron infrared analysis for failure analysis and contamination work. Photothermal Spectroscopy reported that the method offers spatial resolution near 30 times better than traditional FTIR microscopy.



By System Configuration: Inline Adoption Supports Full Production Coverage
Inline systems led with 34.63% of the chemical imaging systems for manufacturing market share in 2025. Their role reflects established use in pharmaceutical continuous manufacturing, food sorting, and semiconductor wafer inspection. At-line systems analyze samples removed from a process. This can create representativeness issues and reporting delays. Benchtop systems remain important for quality laboratories, research, reference-standard work, and incoming-material authentication. Portable systems serve field-based verification and comparative audits across several sites.
Integrated turnkey systems are projected to expand at an 11.84% CAGR from 2026 to 2031. Semiconductor and pharmaceutical manufacturers increasingly want factory-calibrated systems with validated spectral libraries. They also require a connection to supervisory control and manufacturing execution systems. This approach reduces the integration risk associated with component-assembled installations. At-line systems remain a transitional choice for producers testing the case for full inline deployment.
By Application: In-Process Monitoring Anchors Revenue and Contamination Control Accelerates
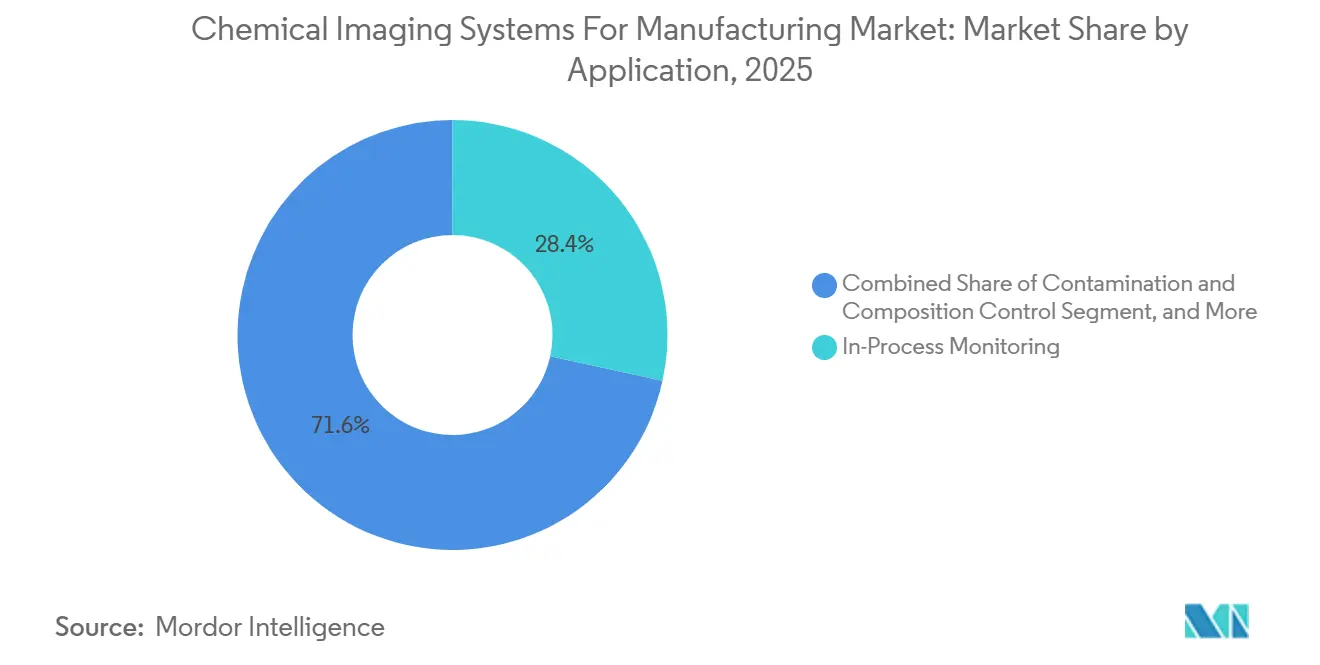
In-process monitoring accounted for 28.41% of application revenue in 2025. It addresses the recurring requirement to confirm that a production process remains within its intended chemical specification. Pushbroom hyperspectral imaging and chemometric soft sensors can track the uniformity of distribution in pharmaceutical and chemical blending. A 2025 study noted that pixel-level prediction from hyperspectral imaging provides spatial composition information that object-level methods cannot resolve. Raw-material authentication and final-product verification form another important revenue group. Coating and thickness inspection is also becoming more relevant in battery electrode and thin-film solar production.
Contamination and composition control in the chemical imaging systems for manufacturing market is projected to expand at a 10.67% CAGR from 2026 to 2031. This application is important in semiconductor packaging, where foreign material at hybrid-bond interfaces can affect yield. A 2026 IEEE CSTIC paper described O-PTIR identification of unknown foreign material in 2.5D and 3D integrated-circuit packages. The work reported 0.5 μm resolution for a task that conventional FTIR could not address effectively. Waste classification and recovery remain smaller applications, but tighter recycled-content requirements support their longer-term relevance. Near-infrared and Raman imaging are also used to identify subsurface cracking, lamination defects, and adhesion failures.
By End-User Industry: Semiconductor Leads and Battery Materials Grow Fastest
Semiconductor and electronics held 20.87% of end-user revenue in 2025, the largest share across verticals. The sector requires strict control of contamination and defects, especially in advanced packaging. Chemical imaging is moving from post-event failure analysis to process control during the bonding and encapsulation stages. Bruker installed its Dimension IconIR AFM-IR system at imec through a joint development project in April 2026.[2]Bruker Corporation, “Bruker Invests in Photothermal AFM-IR to Advance Semiconductor Research,” Bruker Corporation, bruker.com The project targets EUV photoresist chemistry, transistor-scaling materials, and contamination analysis at sub-5 nm device scales. Pharmaceutical and biotechnology, chemicals, and food and beverage represent the next major group of users.
Battery and energy material in the chemical imaging systems for manufacturing market is projected to advance at a 10.46% CAGR through 2031. Capacity expansion for lithium-ion and solid-state cells is increasing the need to inspect electrode chemistry and coating uniformity. A 2026 Nature Communications study found that binder-informed optimization reduced electronic resistivity by 14% and ionic resistance in the electrodes by 40% in lithium-ion negative electrodes. Additive manufacturing is also drawing research interest for real-time composition validation. A 2026 peer-reviewed study demonstrated in-situ spectroscopy and three-dimensional reconstruction during laser powder bed fusion. Recycling and resource recovery offer a longer-term opportunity, although current system economics constrain wider deployment.
Geography Analysis
North America held 32.64% of the chemical imaging systems for manufacturing market share in 2025. Pharmaceutical continuous-manufacturing facilities, semiconductor fabs, and precision manufacturers support the region’s demand. The United States remained the largest regional contributor. The FDA’s CMC Development and Readiness Pilot continued in 2025 and supported early engagement on manufacturing development.[3]U.S. Food and Drug Administration, “Chemistry, Manufacturing, and Controls Development and Readiness Pilot Program, Program Announcement,” Federal Register, federalregister.gov Canada adds food-processing demand, while Mexico contributes through automotive composite manufacturing.
Europe was the second-largest geographic group in the chemical imaging systems for manufacturing market. Germany’s precision manufacturing and pharmaceutical active-ingredient production support demand. The United Kingdom’s biopharmaceutical contract manufacturing base also requires validated process measurement. France and Italy add demand from specialty chemicals and packaging. European pharmaceutical companies face quality-by-design expectations that align with the operational aims of FDA PAT guidance.
Asia-Pacific is projected to expand at an 11.73% CAGR from 2026 to 2031. China’s battery gigafactory construction and semiconductor self-sufficiency efforts create demand for electrode and wafer inspection in the chemical imaging systems for manufacturing market. South Korea uses chemical imaging in semiconductor, packaging, and display manufacturing. Japan contributes demand from advanced materials and pharmaceutical manufacturing. India’s pharmaceutical producers are adopting inline spectroscopy for export compliance. Australia has emerging use in critical-minerals processing, while South America, the Middle East, and Africa remain earlier-stage regions with greater cost and data-infrastructure constraints.

Competitive Landscape
The chemical imaging systems for manufacturing market remains fragmented, and no vendor holds more than a mid-to-high single-digit global revenue share. Specialist suppliers include Specim, Spectral Imaging, Headwall Photonics, ChemImage, WITec, and Photothermal Spectroscopy. Bruker, HORIBA, and Thermo Fisher compete with broader portfolios of analytical instruments and service capabilities. Capital requirements, calibration expertise, and spectral data management create barriers for new entrants. Buyers favor suppliers that can provide application support, validation documentation, and service over the life of a system.
HORIBA completed its acquisition of Pristine Deeptech Private Limited in February 2026. The acquisition combined lab-grown diamond expertise with HORIBA’s Raman spectroscopy portfolio for diamond-wafer semiconductor materials in the chemical imaging systems for manufacturing market.[4]HORIBA, Ltd., “HORIBA Acquires Pristine Deeptech Private Limited in India,” HORIBA, horiba.com Bruker also pursued a joint development project with imec in April 2026. This positioned its AFM-IR system in a leading semiconductor research environment ahead of larger procurement cycles. Such moves show how suppliers are seeking early positions in demanding technical applications.
Opportunity areas in the chemical imaging systems for manufacturing market include artificial intelligence-based spectral analysis, turnkey battery-gigafactory systems, and instruments that combine Raman and O-PTIR data. Cambridge Raman Imaging, Indatech, and tec5 compete through specific applications and faster deployment. Software that can adapt to process drift without repeated manual recalibration can reduce production disruption. Pharmaceutical and semiconductor customers also require documented data integrity and validated results. ISO 17025 accreditation and FDA 21 CFR Part 11 requirements can affect supplier qualification.
Chemical Imaging Systems For Manufacturing Industry Leaders
Agilent Technologies, Inc.
BaySpec, Inc.
Bruker Corporation
Cambridge Raman Imaging Ltd
ChemImage Corporation
- *Disclaimer: Major Players sorted in no particular order

Recent Industry Developments
- August 2026: Thermo Fisher Scientific Inc. introduced the Orbitrap Isora Mass Spectrometer and Orbitrap Isora Pro, the company’s first Orbitrap instruments with a dedicated isotope-ratio analysis mode, forming an integrated workflow for molecular-level isotope-ratio characterization applicable to advanced materials qualification and pharmaceutical manufacturing traceability.
- June 2026: HORIBA, Ltd. and Fujifilm Corporation announced the co-development of a high-sensitivity inline Raman measurement system for continuous, real-time monitoring during cell culture and purification in biopharmaceutical manufacturing. Demonstration tests using Fujifilm model systems showed a 10% improvement in antibody yield during purification relative to conventional UV-Vis-based process control methods.
- April 2026: Bruker Corporation announced the installation of its Dimension IconIR photothermal AFM-IR system at imec, a world-leading semiconductor research hub, under a formal joint development project. The initiative focuses on EUV photoresist patterning chemistry, transistor-scaling materials, site-selective surface functionalization, and contamination analysis at sub-5 nm device scales, extending Bruker’s established role in nanoscale infrared spectroscopy into next-generation semiconductor research.
- March 2026: Bruker Corporation showcased the TITAN next-generation handheld XRF analyzer at Analytica 2026 in Munich, targeting production-floor elemental analysis, materials identification, and regulatory screening in demanding industrial quality-control environments.


Global Chemical Imaging Systems For Manufacturing Market Report Scope
The chemical imaging systems for manufacturing market comprises technologies that use spectroscopy, hyperspectral imaging, and other analytical methods to identify, visualize, and measure the chemical composition of materials during manufacturing processes. These systems support quality control, process monitoring, defect detection, and material characterization across industries such as pharmaceuticals, food and beverages, chemicals, electronics, and automotive manufacturing.
The Chemical Imaging Systems for Manufacturing Market Report is Segmented by Imaging Modality (Hyperspectral Imaging, Raman Imaging, Infrared/FTIR Imaging, Optical Photothermal Infrared (O-PTIR) Imaging, Multimodal Chemical Imaging, and Other Imaging Modalities), System Configuration (Benchtop Systems, Portable Systems, At-Line Systems, Inline Systems, and Integrated Turnkey Systems), Application (Raw Material Authentication, In-Process Monitoring, Coating and Thickness Inspection, Contamination and Composition Control, Surface and Structural Defect Detection, Final Product Verification, and Waste Classification and Recovery), End-User Industry (Pharmaceutical and Biotechnology, Chemical, Semiconductor and Electronics, Food and Beverage, Polymer, Film and Packaging, Additive, Battery and Energy Material, Composite and Advanced Material, Recycling and Resource Recovery, and Other End-User Industries), and Geography (North America, South America, Europe, Asia-Pacific, Middle East, and Africa). The Market Forecasts are Provided in Terms of Value (USD).
| Hyperspectral Imaging |
| Raman Imaging |
| Infrared / FTIR Imaging |
| Optical Photothermal Infrared (O-PTIR) Imaging |
| Multimodal Chemical Imaging |
| Other Imaging Modalities |
| Benchtop Systems |
| Portable Systems |
| At-Line Systems |
| Inline Systems |
| Integrated Turnkey Systems |
| Raw Material Authentication |
| In-Process Monitoring |
| Coating and Thickness Inspection |
| Contamination and Composition Control |
| Surface and Structural Defect Detection |
| Final Product Verification |
| Waste Classification and Recovery |
| Pharmaceutical and Biotechnology |
| Chemical |
| Semiconductor and Electronics |
| Food and Beverage |
| Polymer, Film and Packaging |
| Additive |
| Battery and Energy Material |
| Composite and Advanced Material |
| Recycling and Resource Recovery |
| Other End-user Industries |
| North America | United States |
| Canada | |
| Mexico | |
| South America | Brazil |
| Argentina | |
| Chile | |
| Rest of South America | |
| Europe | Germany |
| United Kingdom | |
| France | |
| Italy | |
| Spain | |
| Rest of Europe | |
| Asia-Pacific | China |
| Japan | |
| India | |
| South Korea | |
| Australia | |
| Rest of Asia-Pacific | |
| Middle East | United Arab Emirates |
| Saudi Arabia | |
| Rest of Middle East | |
| Africa | South Africa |
| Egypt | |
| Rest of Africa |
| By Imaging Modality | Hyperspectral Imaging | |
| Raman Imaging | ||
| Infrared / FTIR Imaging | ||
| Optical Photothermal Infrared (O-PTIR) Imaging | ||
| Multimodal Chemical Imaging | ||
| Other Imaging Modalities | ||
| By System Configuration | Benchtop Systems | |
| Portable Systems | ||
| At-Line Systems | ||
| Inline Systems | ||
| Integrated Turnkey Systems | ||
| By Application | Raw Material Authentication | |
| In-Process Monitoring | ||
| Coating and Thickness Inspection | ||
| Contamination and Composition Control | ||
| Surface and Structural Defect Detection | ||
| Final Product Verification | ||
| Waste Classification and Recovery | ||
| By End-User Industry | Pharmaceutical and Biotechnology | |
| Chemical | ||
| Semiconductor and Electronics | ||
| Food and Beverage | ||
| Polymer, Film and Packaging | ||
| Additive | ||
| Battery and Energy Material | ||
| Composite and Advanced Material | ||
| Recycling and Resource Recovery | ||
| Other End-user Industries | ||
| By Geography | North America | United States |
| Canada | ||
| Mexico | ||
| South America | Brazil | |
| Argentina | ||
| Chile | ||
| Rest of South America | ||
| Europe | Germany | |
| United Kingdom | ||
| France | ||
| Italy | ||
| Spain | ||
| Rest of Europe | ||
| Asia-Pacific | China | |
| Japan | ||
| India | ||
| South Korea | ||
| Australia | ||
| Rest of Asia-Pacific | ||
| Middle East | United Arab Emirates | |
| Saudi Arabia | ||
| Rest of Middle East | ||
| Africa | South Africa | |
| Egypt | ||
| Rest of Africa | ||


Key Questions Answered in the Report
What is the size of the chemical imaging systems for manufacturing market?
The chemical imaging systems for manufacturing market was valued at USD 340.25 million in 2025, is estimated at USD 368.20 million in 2026, and is forecast to reach USD 588.89 million by 2031. The 9.85% CAGR reflects demand for continuous inspection systems that can monitor chemical composition across a production line.
What is driving demand for chemical imaging systems in manufacturing?
Demand in the chemical imaging systems for manufacturing market is supported by inline quality control, non-destructive inspection, PAT adoption, and faster spectral classification through artificial intelligence. These capabilities help producers identify chemical variation without interrupting production. They also support traceability, contamination control, and more timely corrective action in regulated and precision-manufacturing settings.
Which imaging modality leads manufacturing chemical imaging?
Hyperspectral imaging led the modality group with 31.72% share in 2025 because it supports broad chemical mapping without prior knowledge of the target compound. Raman imaging is projected to grow faster at a 10.92% CAGR through 2031. The chemical imaging systems for manufacturing market uses both modalities where chemical specificity and spatial information are needed.
Which system configuration is growing fastest?
Integrated turnkey systems are projected to grow at an 11.84% CAGR through 2031 as manufacturers seek calibrated and validated solutions. Inline systems held the largest configuration share in 2025, at 34.63%. In the chemical imaging systems for manufacturing market, turnkey systems can reduce the work of combining instruments, software, calibration, and production-line connectivity.
Which region is growing fastest for these systems?
Asia-Pacific is projected to expand at an 11.73% CAGR through 2031, supported by battery, semiconductor, pharmaceutical, and materials production. North America held the largest regional share in 2025, at 32.64%.
Page last updated on:


 Your data is secure and never sold or shared.


