
Cable Landing Station Market Size and Share
Market Overview
| Study Period | 2020 - 2031 |
|---|---|
| Market Size (2026) | USD 4.48 Billion |
| Market Size (2031) | USD 6.23 Billion |
| Growth Rate (2026 - 2031) | 6.82 % |
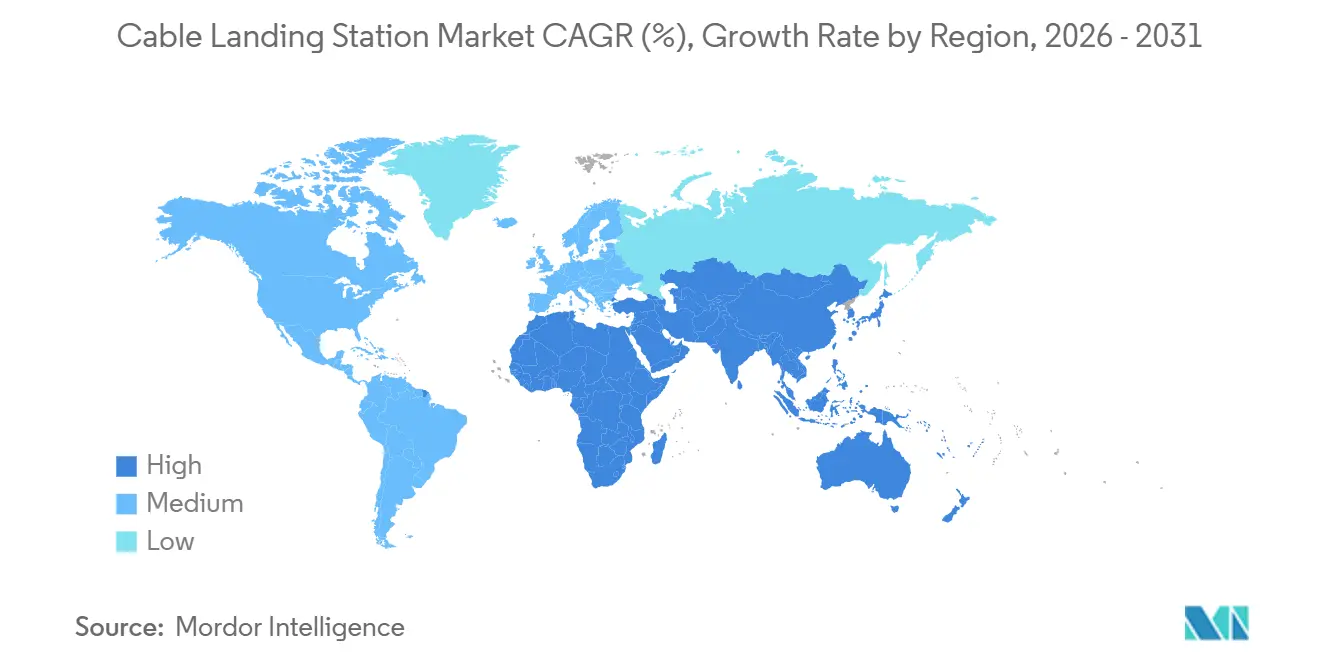
| Fastest Growing Market | Middle East |
| Largest Market | Asia-Pacific |
| Market Concentration | Medium |
Major Players *Disclaimer: Major Players sorted in no particular order Image © Mordor Intelligence. Reuse requires attribution under CC BY 4.0. | |
Cable Landing Station Market Analysis by Mordor Intelligence
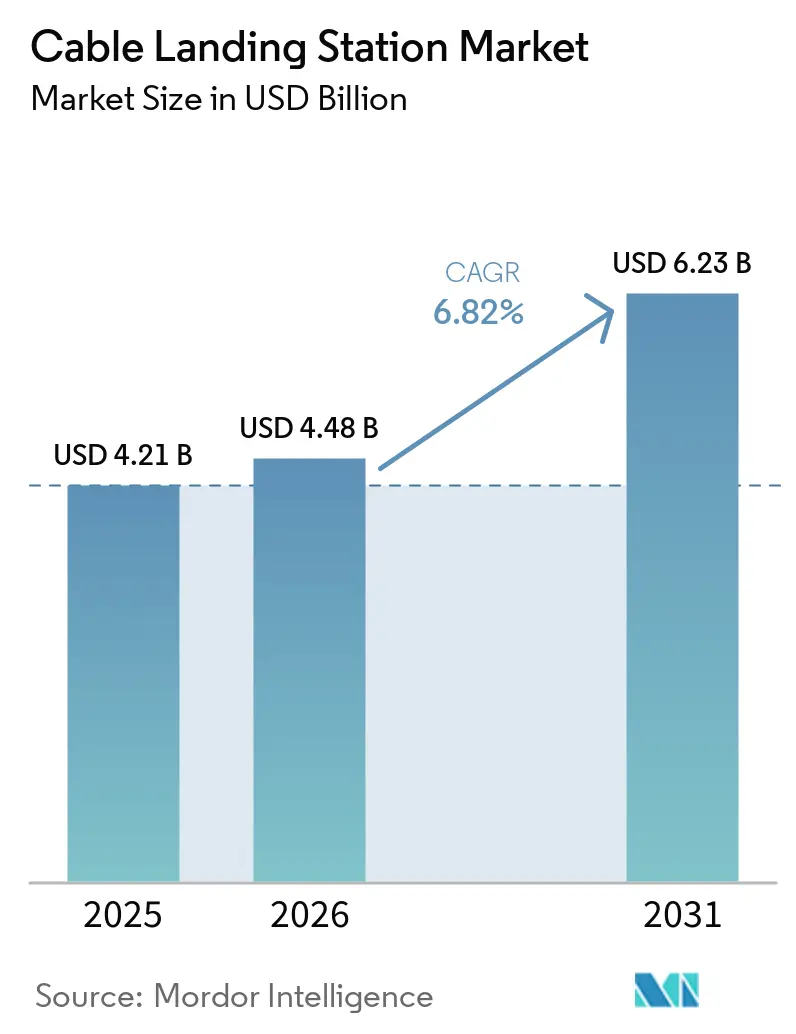
The Cable Landing Station Market size is expected to grow from USD 4.21 billion in 2025 to USD 4.48 billion in 2026 and is forecast to reach USD 6.23 billion by 2031 at 6.82% CAGR over 2026-2031.
New submarine cable projects committed USD 13 billion during 2025-2027, while cables scheduled to enter service during 2026-2029 total more than USD 16 billion in value. Cable landing stations connect offshore cable systems to terrestrial networks, so the development of new routes creates direct demand for site capacity, power systems, security, and optical equipment. Private cloud owners are changing procurement because they increasingly design and control their own routes rather than acquiring shared capacity. National resilience programs also shift investment toward landing diversity, repair readiness, and infrastructure located outside established hubs. The cable landing station market, therefore, depends on both new cable construction and upgrades to sites built for earlier generations of optical equipment. Developers must also coordinate marine contractors, local authorities, power providers, backhaul operators, and tenants before a station can enter service. This coordination gives established operators an advantage where they can offer proven procedures and dependable local partnerships.
Key Report Takeaways
- By component, Submarine Line Terminal Equipment held 32.51% of the cable landing station market share in 2025, while Monitoring and Control Equipment is projected to expand at a 7.46% CAGR through 2031.
- By service, Installation and Commissioning held 43.26% of the cable landing station market share in 2025, while Upgrades and Retrofits are projected to expand at an 8.15% CAGR through 2031.
- By application, Telecommunications and Internet Backbone accounted for 52.48% of the cable landing station market size in 2025, while Hyperscale and Data Center Interconnection is projected to expand at a 7.84% CAGR through 2031.
- By ownership and business model, Consortium-Owned Systems held 45.73% of the cable landing station market share in 2025, while Single-Owner Systems is projected to expand at a 7.53% CAGR through 2031.
- By geography, Asia-Pacific accounted for 38.63% of the cable landing station market in 2025, while the Middle East is projected to expand at an 8.37% CAGR through 2031.
Note: Market size and forecast figures in this report are generated using Mordor Intelligence’s proprietary estimation framework, updated with the latest available data and insights as of January 2026.
Market Trends and Insights
Drivers Impact Analysis of Cable Landing Station Market*
| Driver | (~) % Impact on CAGR Forecast | Geographic Relevance | Impact Timeline |
|---|---|---|---|
| Cloud and AI Traffic Driving International Capacity | +2.1% | Global | Short term (≤ 2 years) |
| Hyperscaler Investment in Single-Owner Systems | +1.6% | North America, Asia-Pacific, Europe | Short term (≤ 2 years) |
| Digital Sovereignty and Critical Infrastructure Spending | +1.0% | Asia-Pacific, Europe, Middle East | Medium term (2-4 years) |
| Carrier-Neutral Expansion in Emerging Corridors | +0.7% | Africa, South America, South and Southeast Asia | Medium term (2-4 years) |
| Offshore Energy and Island Connectivity Needs | +0.5% | North Sea, Middle East, Southeast Asia, Pacific | Long term (≥ 4 years) |
| Modular and Prefabricated Station Deployment | +0.4% | Global, concentrated in emerging markets | Short term (≤ 2 years) |
| Source: Mordor Intelligence | |||
Cloud and AI Traffic Driving New International Capacity
Artificial intelligence inference requires low latency and recurring transfers of large model files between locations. Used international bandwidth is projected to grow at a 24% annual rate from 2025 through 2035, which requires continued investment in long-haul capacity rather than isolated network upgrades. Higher traffic density raises the need for optical monitoring at coastal facilities. Operators also need dependable power, cooling, and backhaul links when they increase port capacity. The cable landing station market benefits because each new route must connect to a protected site with terrestrial network access. Demand is especially relevant where cloud regions need direct links across the Atlantic, Pacific, and Indian Ocean basins.
Hyperscaler Investment in Single-Owner Submarine Systems
Large technology companies increasingly favor routes that give them control over capacity, routing, and network design. Meta announced Project Waterworth in 2025 as a 50,000-km, five-continent cable system that it would own, which illustrates this direction.[1] Amazon announced Fastnet in 2025, a cable linking Maryland and County Cork with more than 320 terabits per second of capacity. These projects require stations capable of accommodating private optical systems and dedicated terrestrial connections. Host operators can capture service revenue by modifying power, physical layout, and optical distribution frames in private systems. This ownership model supports growth in single-owner deployments and in retrofit work at existing facilities.
National Digital Sovereignty and Critical Infrastructure Spending
Governments are treating submarine cable resilience as a strategic infrastructure issue. The European Commission allocated EUR 347 million (USD 381 million) in February 2026 for cable projects and repair capability through the Connecting Europe Facility. The allocation included EUR 60 million (USD 66 million) for repair equipment. Japan also supported greater geographic diversity in cable landing locations through its digital infrastructure resilience program in 2025. These programs create demand where private capital may otherwise favor established landing points. The cable landing station market gains from public spending on alternative routes, repair capacity, and resilient local infrastructure.
Carrier-Neutral Landing Station Expansion in Emerging Corridors
Carrier-neutral facilities allow several cable owners and network providers to use the same secure landing location. This structure can reduce the fixed cost carried by any individual route. In India, Sify began developing an open cable landing station and a 50-megawatt AI edge data center in Visakhapatnam in October 2025. The project targeted connections to Singapore, Malaysia, Australia, and Thailand. Shared facilities can support routes that would not justify a dedicated site under a single-provider model. This approach creates room for the cable landing station market in emerging corridors where traffic volumes are increasing but remain distributed among several users.
Restraints Impact Analysis of Cable Landing Station Market*
| Restraint | (~) % Impact on CAGR Forecast | Geographic Relevance | Impact Timeline |
|---|---|---|---|
| Coastal Permitting and Environmental Review Delays | -1.2% | North America, Europe, Pacific islands | Short term (≤ 2 years) |
| Cybersecurity and Physical-Security Compliance Costs | -0.8% | Global, primary impact in North America and Europe | Medium term (2-4 years) |
| Cable Repair Vessel and Specialist Workforce Constraints | -0.6% | Global | Long term (≥ 4 years) |
| Concentrated Landing-Point and Backhaul Failure Exposure | -0.4% | Asia-Pacific, Middle East | Medium term (2-4 years) |
| Source: Mordor Intelligence | |||
Coastal Permitting and Environmental Review Delays
Environmental review and local approvals can delay a cable landing project for years. Each route requires approvals from multiple authorities, and its commercial operation may depend on all planned landing points being ready. The United States House of Representatives passed the Undersea Cable Protection Act in 2025 to remove a duplicative special-use permit requirement under the National Marine Sanctuary Act. The measure addresses a specific approval step but does not remove broader coastal, environmental, and community review requirements. Delays can leave completed marine portions of a system waiting for a single unready site. This uncertainty increases development risk for the cable landing station market, particularly in coastal areas with strict review processes.
Cybersecurity and Physical-Security Compliance Costs
The Federal Communications Commission adopted new cybersecurity and physical-security requirements for submarine cable licensees in June 2026. The agency estimated first-year industry-wide compliance costs of USD 39.2 million, including USD 28.5 million for risk-management plan development and USD 10.7 million in recurring obligations. The rules applied to an estimated 3,136 entities across 98 licensed cable systems. Smaller operators may face a higher relative cost because they must maintain plans, reporting processes, and security controls with fewer routes. Customers with global networks may also request comparable safeguards outside jurisdictions with formal rules. These costs can constrain smaller entrants even as they improve operational security across the cable landing station market. They also make security planning a necessary part of site design, vendor selection, operating procedures, and customer negotiations. Compliance requirements may raise project preparation costs before a cable owner commits to a route.
*Our forecasts treat driver/restraint impacts as directional, not additive. The impact forecasts reflect baseline growth, mix effects, and variable interactions.
Cable Landing Station Market Segment Analysis
By Component:
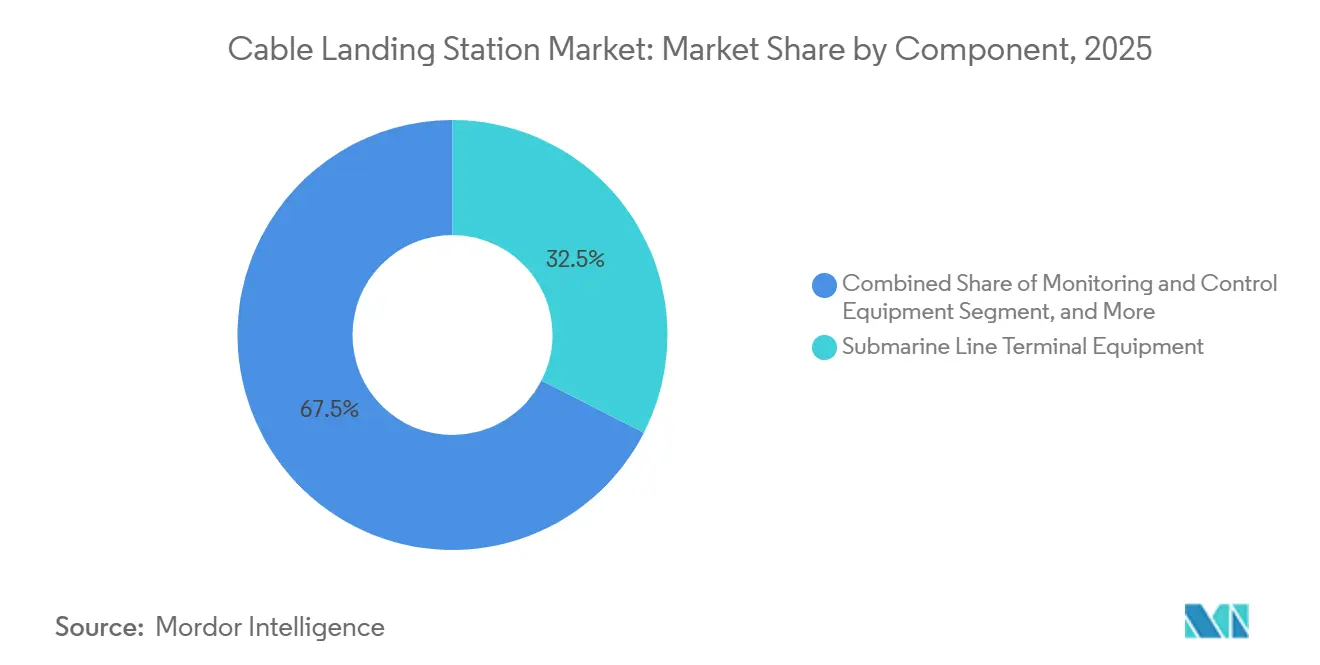
Optical Interface Equipment Holds the Largest Revenue PositionSubmarine Line Terminal Equipment held 32.51% of the cable landing station market share in 2025. It converts traffic between submarine and terrestrial systems, making it central to every high-capacity cable termination. Its role results in a significant equipment requirement whenever operators develop a new landing point. Nokia supplied Submarine Line Terminal Equipment for the Bangladesh Private Cable System, a project with a total investment of USD 150 million. Buyers assess capacity, energy use, equipment interoperability, and security when they select these systems. The installed base also requires periodic replacement as optical standards advance.
Monitoring and Control Equipment is projected to expand at a 7.46% CAGR from 2026 to 2031. Operators need continuous visibility into optical performance as fiber-pair counts and wavelength capacity rise. Monitoring can identify degraded performance before it creates a larger service issue. Power Feeding Equipment and Protection Equipment support the electrical and physical integrity of the landing installation. Many facilities date from earlier fiber deployments, so existing systems may not have been designed for current coherent optical technologies. The International Telecommunication Union noted in 2026 that changing environmental pressures affect the resilience of cables and coastal infrastructure. This replacement need supports component demand during both expansion and slower new-build periods. It also gives equipment suppliers recurring opportunities to improve automation, fault visibility, energy management, and compatibility with new optical systems. Station owners can use these upgrades to extend the useful life of protected coastal facilities without rebuilding the entire site.

By Service:
Installation Leads While Retrofit Work Gains ImportanceInstallation and Commissioning held 43.26% of the cable landing station market share in 2025. The service includes beach-joint work, cable burial, optical alignment, testing, and the final integration of station equipment. These activities require specialized engineering and coordination with the marine cable contractor. Cables due to enter service from 2026 to 2029 exceed USD 16 billion in value, supporting the current installation pipeline. NEC served as system integrator for the Candle system, covering manufacturing, route design, installation, and testing.[2] Turnkey contracts can reduce coordination risk for cable owners who need a single accountable delivery partner.
Upgrades and Retrofits are projected to expand at an 8.15% CAGR from 2026 to 2031. Existing sites need more optical capacity, additional power management, and room for private systems owned by large technology companies. Maintenance and Support contracts also become more valuable when operators require continuous performance oversight. Design and engineering are becoming more complex at carrier-neutral sites because developers must reserve conduits, power capacity, and frame space for future cables. Modular construction can shorten the on-site work required for a new facility. These service needs allow the cable landing station industry to generate activity from operating sites as well as from new landings. Service providers that understand local construction rules and optical integration can support customers throughout design, commissioning, maintenance, expansion, and incident response. That broader service role can be important in regions with limited specialist capacity.
By Application:
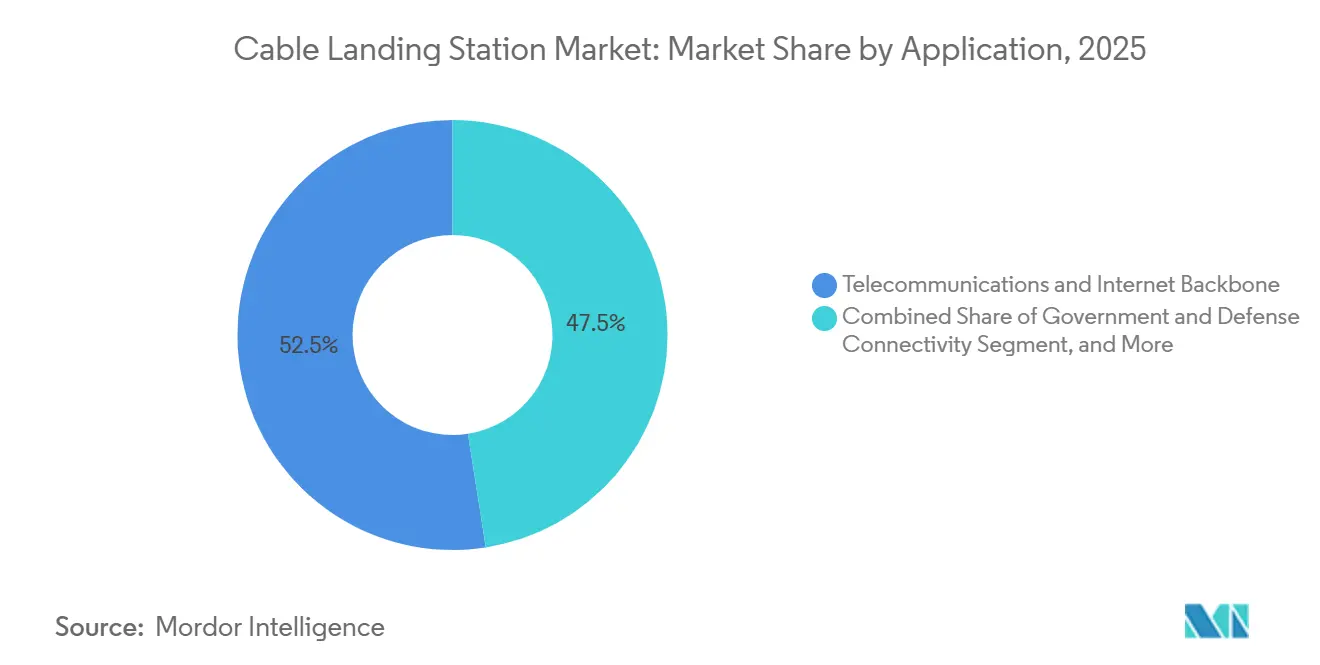
Backbone Networks Remain the Largest Use CaseTelecommunications and Internet Backbone accounted for 52.48% of the cable landing station market size in 2025. Carrier consortium cables across the Atlantic, Pacific, and Indian Ocean basins established the large installed base behind this position. Backbone stations require high availability because they support many connected national networks. Their operators focus on dependable power, backhaul capacity, physical protection, and rapid restoration arrangements. Cable systems are therefore designed with consideration for both marine route diversity and landing-site resilience. The continued need to connect national networks keeps backbone infrastructure central to the cable landing station market.
Hyperscale and Data Center Interconnection is projected to expand at a 7.84% CAGR from 2026 to 2031. Private cloud routes connect data center regions directly, reducing reliance on wholesale capacity purchases. Meta's Project Waterworth and Amazon's Fastnet demonstrate the growing role of single-owner systems in this application. Government and Defense Connectivity also grows when public entities fund routes with greater geographic diversity. Offshore Energy and Industrial Connectivity requires specialized infrastructure where sites connect islands or offshore assets. Vietnam completed a 77-km, 110-kilovolt submarine power cable to Con Dao Islands in 2025, illustrating the scale of island connectivity investment. Each application has different design needs, but all require reliable interfaces between marine and land networks. The equipment layout and operating model must match the availability, security, power, and access needs of the customer. This makes application requirements a material consideration for every location in the cable landing station market.
By Ownership and Business Model:
Consortium Systems Retain Scale AdvantagesConsortium-Owned Systems held 45.73% market share in the cable landing station market in 2025. This model lets several carriers share the capital cost and capacity of large intercontinental cable systems. It remains useful where no single buyer needs the full capacity of a route. Telecom Egypt completed 2 SEA-ME-WE-6 landing points in 2025 for a 21,700-km cable system with 17 landing points and a design capacity of 126 terabits per second. Such systems require coordination among cable owners, landing parties, governments, and terrestrial network providers.
Single-Owner Systems are projected to expand at a 7.53% CAGR from 2026 to 2031. Large technology companies seek control of capacity and route decisions without consortium approval processes. Carrier-neutral landing-party models help these owners use certified sites without operating every facility themselves. Government and development-bank-backed systems remain smaller, but public financing can support routes that advance national connectivity goals. The Australian Government supported the Adamasia Cable System 1, with a landing station planned for the Solomon Islands.
Geography Analysis
APAC Cable Landing Station Market
Asia-Pacific held 38.63% of the cable landing station market share in 2025. The region combines large internet populations, dense intra-Asian traffic, and major transpacific routes. New Asian cable investment is expected to exceed USD 3.7 billion during 2026-2029. Japan's location-diversification program selected SoftBank to establish new cable landing stations in Hokkaido and Kyushu in 2025.[3] India, China, Malaysia, Indonesia, and the Philippines provide additional sources of route development. The cable landing station market in Asia-Pacific is supported by commercial cloud demand and public resilience programs.
EMEA and North America Cable Landing Station Market
The Middle East is projected to expand at an 8.37% CAGR from 2026 to 2031. Its location between Asian, European, and African cable routes supports its role as a transit region. Mobily landed the Africa-1 cable in Duba, Saudi Arabia, in 2025. The 10,000-km system has 8 fiber pairs and 11 landing points. Egypt added SEA-ME-WE-6 landing infrastructure at Port Said and Ras Ghareb. Diversified sites along the Red Sea and Mediterranean improve route options for operators serving east-west traffic. North America reflects demand for private facilities used by hyperscalers. Amazon selected a Maryland landing location for Fastnet, while its cable will connect the United States and Ireland.
Europe, Africa, South America and APAC Cable Landing Station Market
Europe is directing EUR 347 million (USD 381 million) toward cable security and priority projects through 2027. Africa can gain from carrier-neutral facilities that lower the cost of entering Atlantic routes. South America has scope for modular installations and new links to Asia-Pacific. The cable landing station market across these regions depends on local permitting, grid access, coastal security, and resilient terrestrial backhaul. Local development conditions can be as important as the physical route because a cable cannot deliver capacity until its station and terrestrial links are ready. Developers that secure these requirements early can reduce the risk of delays after marine construction begins.
Competitive Landscape
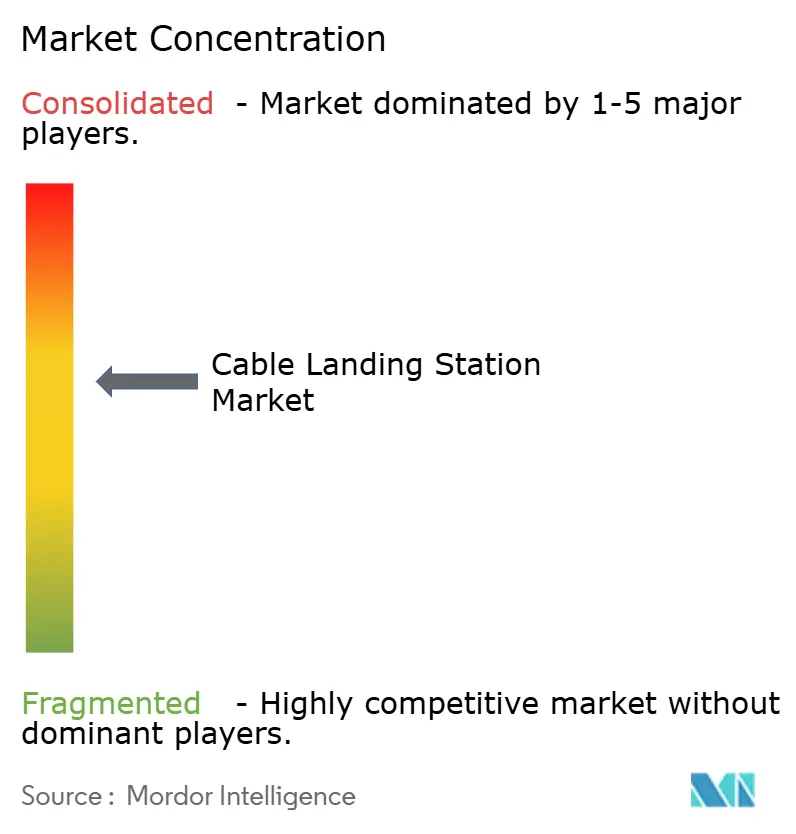
The cable landing station market is moderately concentrated at the system-integration level. Alcatel Submarine Networks, SubCom, and NEC receive large turnkey awards because they combine cable manufacturing, marine installation, and system integration capabilities. Alcatel Submarine Networks received the I-AM Cable contract in 2026 for an 8,100-km system between Japan, Malaysia, and Singapore. SubCom was selected for Space Norway's Arctic Way cable in 2025.[4] These contracts show the importance of experience across different marine conditions and landing jurisdictions.
Nokia is active in the optical equipment layer. Its 1830 GX Series platform with ICE7 coherent optics was selected for Medusa, a system intended to link Europe and North Africa. Competition in this layer centers on capacity, power efficiency, and interoperability with cable systems. Station developers compete through local land access, permits, grid connections, and carrier-neutral design. DXN uses prefabricated station modules to reduce construction time in smaller or remote markets.
Regional operators can compete effectively where they understand local regulation and can provide reliable terrestrial backhaul. Open cable specifications allow equipment from multiple vendors on the same system. This change can reduce proprietary lock-in and place greater value on managed services and network control software. Large technology companies also have more influence because they finance single-owner routes and can specify equipment architectures. The cable landing station industry remains less concentrated in site development than in turnkey system supply.
Cable Landing Station Industry Leaders
-
Alcatel Submarine Networks SAS
-
SubCom, LLC
-
Huawei Marine Networks Co., Ltd.
-
NEC Corporation
-
Fujitsu Limited
- *Disclaimer: Major Players sorted in no particular order
Cable Landing Station Market Companies Covered in this Report
- Alcatel Submarine Networks SAS
- SubCom, LLC
- Huawei Marine Networks Co., Ltd.
- NEC Corporation
- Fujitsu Limited
- Nokia Corporation
- Ciena Corporation
- Xtera Limited
- Global Marine Systems Limited
- Prysmian S.p.A.
- Nexans S.A.
- Sumitomo Electric Industries, Ltd.
- Hengtong Optic-Electric Co., Ltd.
- ZTT International Limited
- LS Cable & System Ltd.
- TE Connectivity Ltd.
- Corning Incorporated
- Infinera Corporation
- ZTE Corporation
- Elettra Tlc S.p.A.
Recent Industry Developments in Cable Landing Station Market
- July 2026: IPS Inc. commenced feasibility evaluation for a JPY 23 billion (USD 143.75 million) open-access cable landing station in Wakayama, Japan, to host a branch line of the Candle system, with a final investment decision expected in Q2 fiscal year 2026.
- June 2026: The FCC released its Second Report and Order on submarine cable landing license rules, mandating cybersecurity and physical-security risk-management plans for approximately 3,136 SLTE operators, with estimated first-year industry-wide compliance costs of USD 39.2 million.
- February 2026: The European Commission adopted the EU Cable Security Toolbox and allocated EUR 347 million (USD 381 million) via the Connecting Europe Facility for 13 Cable Projects of European Interest, with EUR 60 million (USD 66 million) earmarked for cable-repair equipment.
- January 2026: NTT Data, Sumitomo Corporation, and JA Mitsui Leasing announced the USD 1 billion, 8,100-km I-AM Cable connecting Japan, Malaysia, Singapore, and South Korea, with Alcatel Submarine Networks and OMS Group contracted for supply and installation, targeting service in early fiscal year 2029.
Global Cable Landing Station Market Report Scope
A cable landing station is a facility where submarine communication cables terminate and connect to terrestrial networks, enabling the transmission of data, voice, and internet traffic between countries and regions. The scope of the report covers the cable landing station market, including the infrastructure, services, and technologies associated with deploying, operating, and maintaining cable landing stations that support global subsea connectivity.
The Cable Landing Station Market Report is Segmented by Component (Power Feeding Equipment, Submarine Line Terminal Equipment, Monitoring and Control Equipment, Protection Equipment, and Other Components), Service (Design and Engineering, Installation and Commissioning, Maintenance and Support, and Upgrades and Retrofits), Application (Telecommunications and Internet Backbone, Hyperscale and Data Center Interconnection, Government and Defense Connectivity, Offshore Energy and Industrial Connectivity, and Inter-Country and Island Connection), Ownership and Business Model (Consortium-Owned Systems, Single-Owner Systems, Carrier-Neutral Landing-Party Model, and Government and Development-Bank-Backed Systems), and Geography (North America, South America, Europe, Asia-Pacific, Middle East, and Africa). The Market Forecasts are Provided in Terms of Value (USD).
Segmentation Overview
| Power Feeding Equipment |
| Submarine Line Terminal Equipment |
| Monitoring and Control Equipment |
| Protection Equipment |
| Other Components |
| Design and Engineering |
| Installation and Commissioning |
| Maintenance and Support |
| Upgrades and Retrofits |
| Telecommunications and Internet Backbone |
| Hyperscale and Data Center Interconnection |
| Government and Defense Connectivity |
| Offshore Energy and Industrial Connectivity |
| Inter-Country and Island Connection |
| Consortium-Owned Systems |
| Single-Owner Systems |
| Carrier-Neutral Landing-Party Model |
| Government and Development-Bank-Backed Systems |
| North America | United States |
| Canada | |
| Mexico | |
| South America | Brazil |
| Argentina | |
| Chile | |
| Rest of South America | |
| Europe | Germany |
| United Kingdom | |
| France | |
| Italy | |
| Spain | |
| Rest of Europe | |
| Asia-Pacific | China |
| Japan | |
| India | |
| South Korea | |
| Australia | |
| Rest of Asia-Pacific | |
| Middle East | United Arab Emirates |
| Saudi Arabia | |
| Qatar | |
| Rest of Middle East | |
| Africa | South Africa |
| Egypt | |
| Nigeria | |
| Rest of Africa |
| By Component | Power Feeding Equipment | |
| Submarine Line Terminal Equipment | ||
| Monitoring and Control Equipment | ||
| Protection Equipment | ||
| Other Components | ||
| By Service | Design and Engineering | |
| Installation and Commissioning | ||
| Maintenance and Support | ||
| Upgrades and Retrofits | ||
| By Application | Telecommunications and Internet Backbone | |
| Hyperscale and Data Center Interconnection | ||
| Government and Defense Connectivity | ||
| Offshore Energy and Industrial Connectivity | ||
| Inter-Country and Island Connection | ||
| By Ownership and Business Model | Consortium-Owned Systems | |
| Single-Owner Systems | ||
| Carrier-Neutral Landing-Party Model | ||
| Government and Development-Bank-Backed Systems | ||
| By Geography | North America | United States |
| Canada | ||
| Mexico | ||
| South America | Brazil | |
| Argentina | ||
| Chile | ||
| Rest of South America | ||
| Europe | Germany | |
| United Kingdom | ||
| France | ||
| Italy | ||
| Spain | ||
| Rest of Europe | ||
| Asia-Pacific | China | |
| Japan | ||
| India | ||
| South Korea | ||
| Australia | ||
| Rest of Asia-Pacific | ||
| Middle East | United Arab Emirates | |
| Saudi Arabia | ||
| Qatar | ||
| Rest of Middle East | ||
| Africa | South Africa | |
| Egypt | ||
| Nigeria | ||
| Rest of Africa | ||
Key Questions Answered in the Report
What is the cable landing station market size?
The cable landing station market size is USD 4.48 billion in 2026 and is projected to reach USD 6.23 billion by 2031 at a 6.82% CAGR.
What is driving demand for cable landing stations?
International bandwidth growth, cloud connectivity, AI workloads, new private cable systems, and public investment in cable resilience are increasing demand. These factors require secure sites that link submarine systems with dependable terrestrial networks.
Which component leads revenue in cable landing stations?
Submarine Line Terminal Equipment led with 32.51% share in 2025, while Monitoring and Control Equipment is projected to grow at a 7.46% CAGR. Both categories support the optical capacity, visibility, power management, and protection needed at operating locations.
Which service is growing fastest for cable landing facilities?
Upgrades and Retrofits is projected to grow at an 8.15% CAGR through 2031 as operators modernize equipment and support higher-capacity systems. The service includes modifications for newer optical technologies, private systems, and continuous performance management.
Which region has the largest cable landing station presence?
Asia-Pacific held 38.63% share in 2025, supported by transpacific routes, intra-Asian links, and digital infrastructure programs. Japan, India, China, Southeast Asia, and island markets provide a broad base of current and planned route activity.