
Brazil E-commerce Logistics Market Size and Share
Market Overview
| Study Period | 2021 - 2032 |
|---|---|
| Forecast Data Period | 2027 - 2032 |
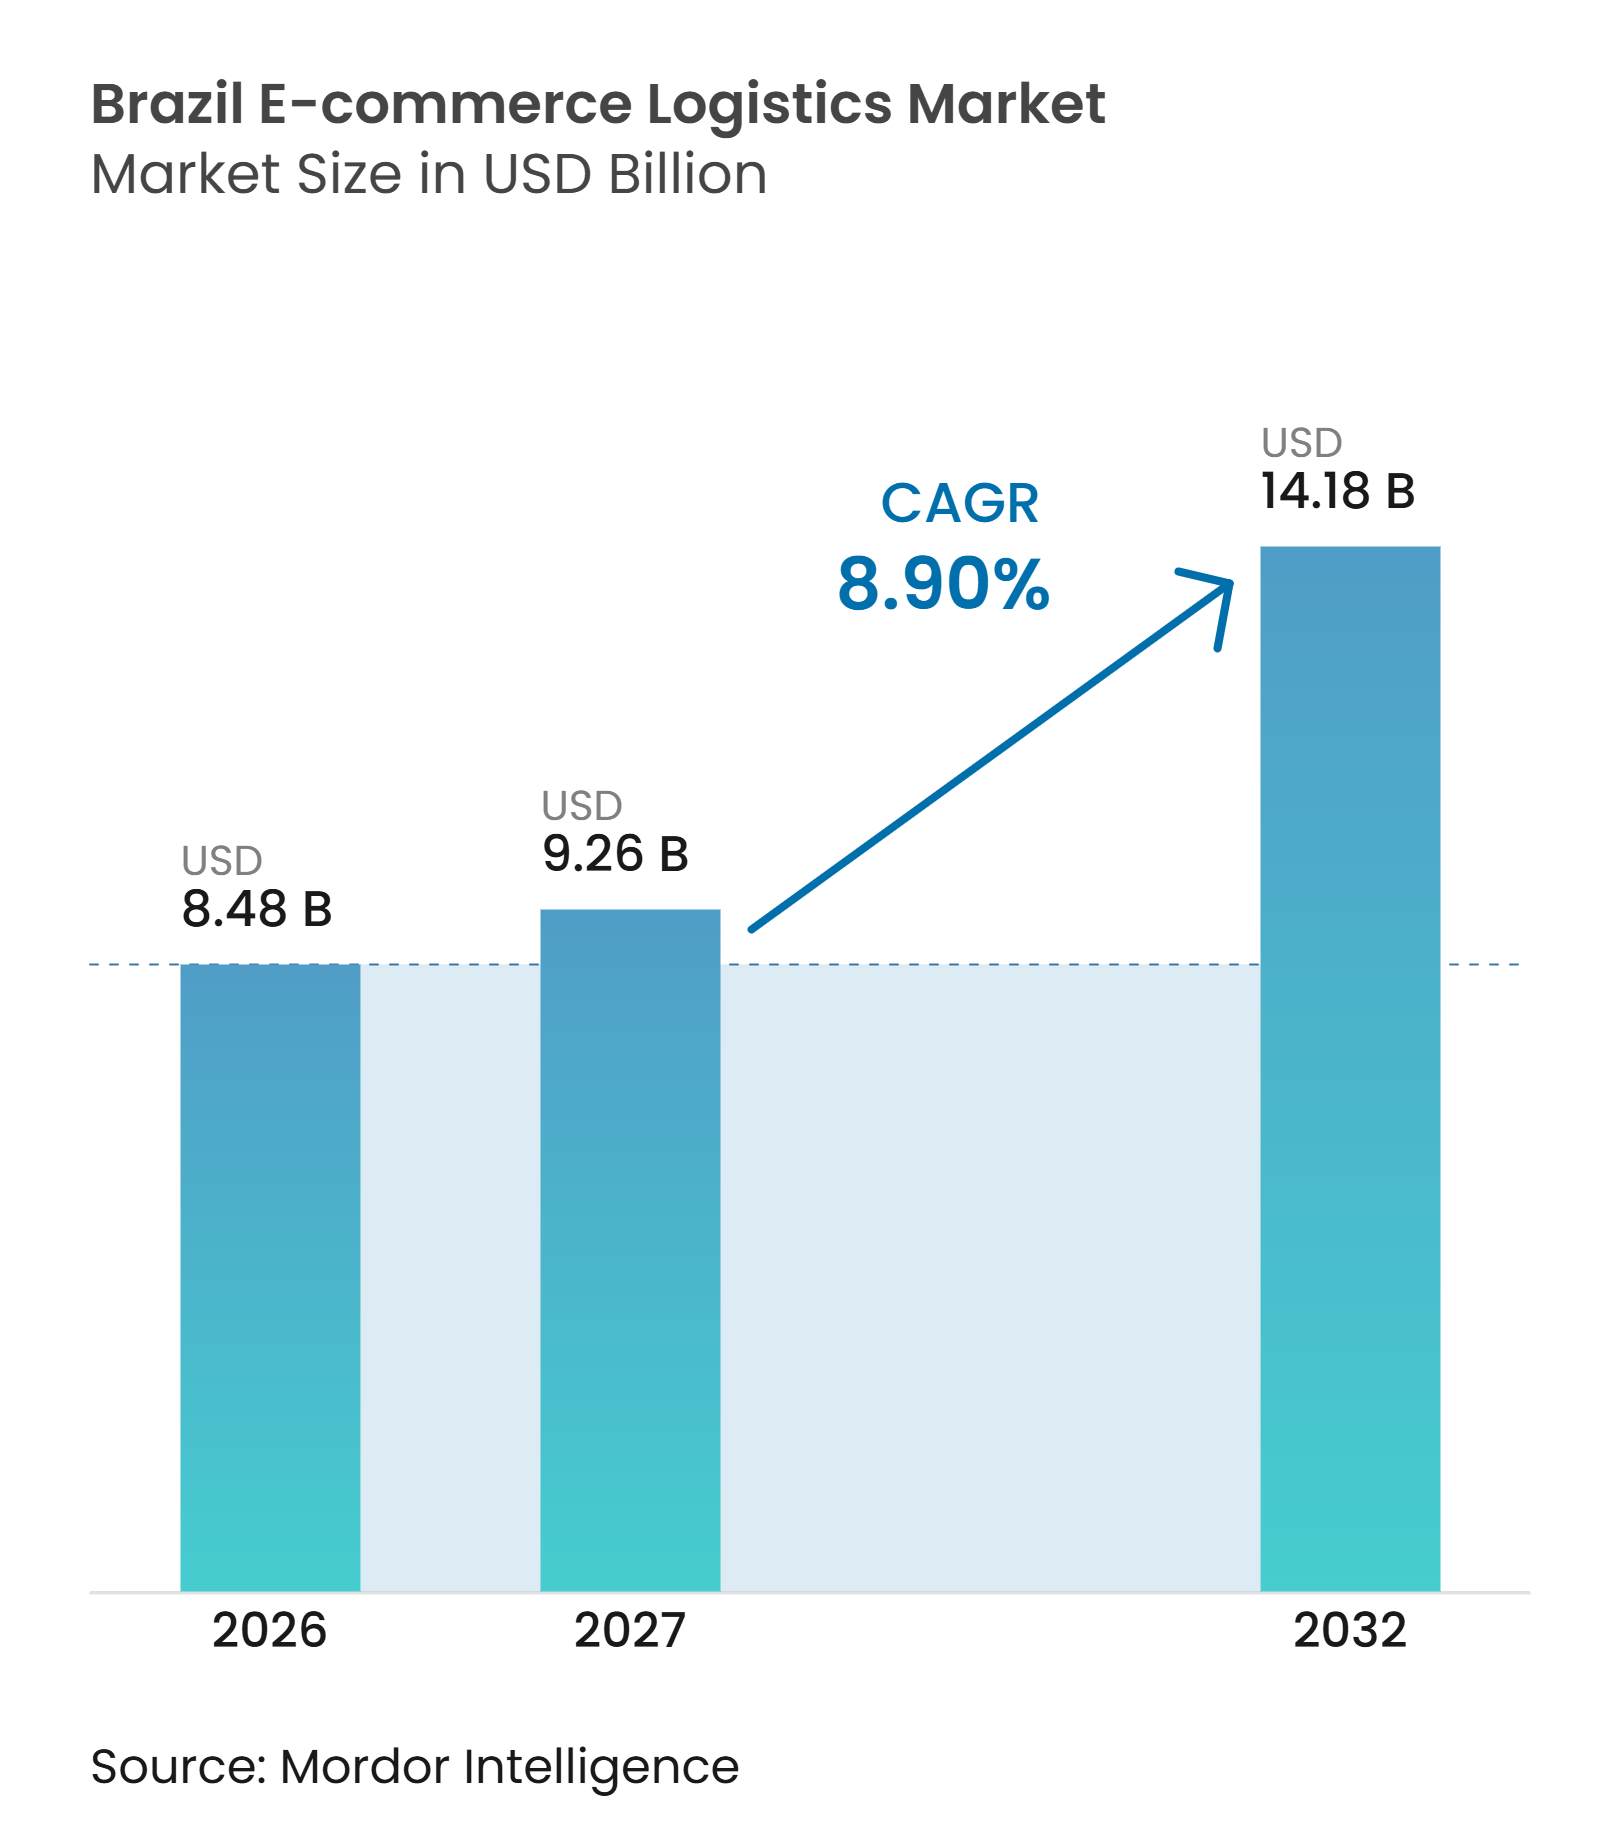
| Base Year Market Size (2026) | USD 8.48 Billion |
| Market Size (2027) | USD 9.26 Billion |
| Market Size (2032) | USD 14.18 Billion |
| Growth Rate (2027 - 2032) | 8.90 % |
| Market Concentration | Medium |
Major Players *Disclaimer: Major Players sorted in no particular order Image © Mordor Intelligence. Reuse requires attribution under CC BY 4.0. | |
Brazil E-commerce Logistics Market Analysis by Mordor Intelligence
The Brazil e-commerce logistics market size is valued at USD 8.48 billion in 2026 and is estimated to grow from USD 9.26 billion in 2027 to USD 14.18 billion by 2032 at an 8.90% CAGR over 2027-2032.
The Brazil e-commerce logistics industry is supported by a large online buyer base and increasing order volumes, which require more fulfillment capacity across the country. Brazil recorded BRL 295.6 billion in e-commerce gross merchandise value in 2025 (USD 55.8 billion), and 94.2 million active online shoppers placed 438.9 million orders. Platform operators are expanding fulfillment networks, while third-party logistics providers are adding automation and shared warehousing capacity. Delivery expectations are also rising as platform investments bring faster services into more cities. At the same time, road dependence, warehouse scarcity, congestion, and cross-border compliance requirements continue to raise delivery costs and favor operators with dense networks.
Key Report Takeaways
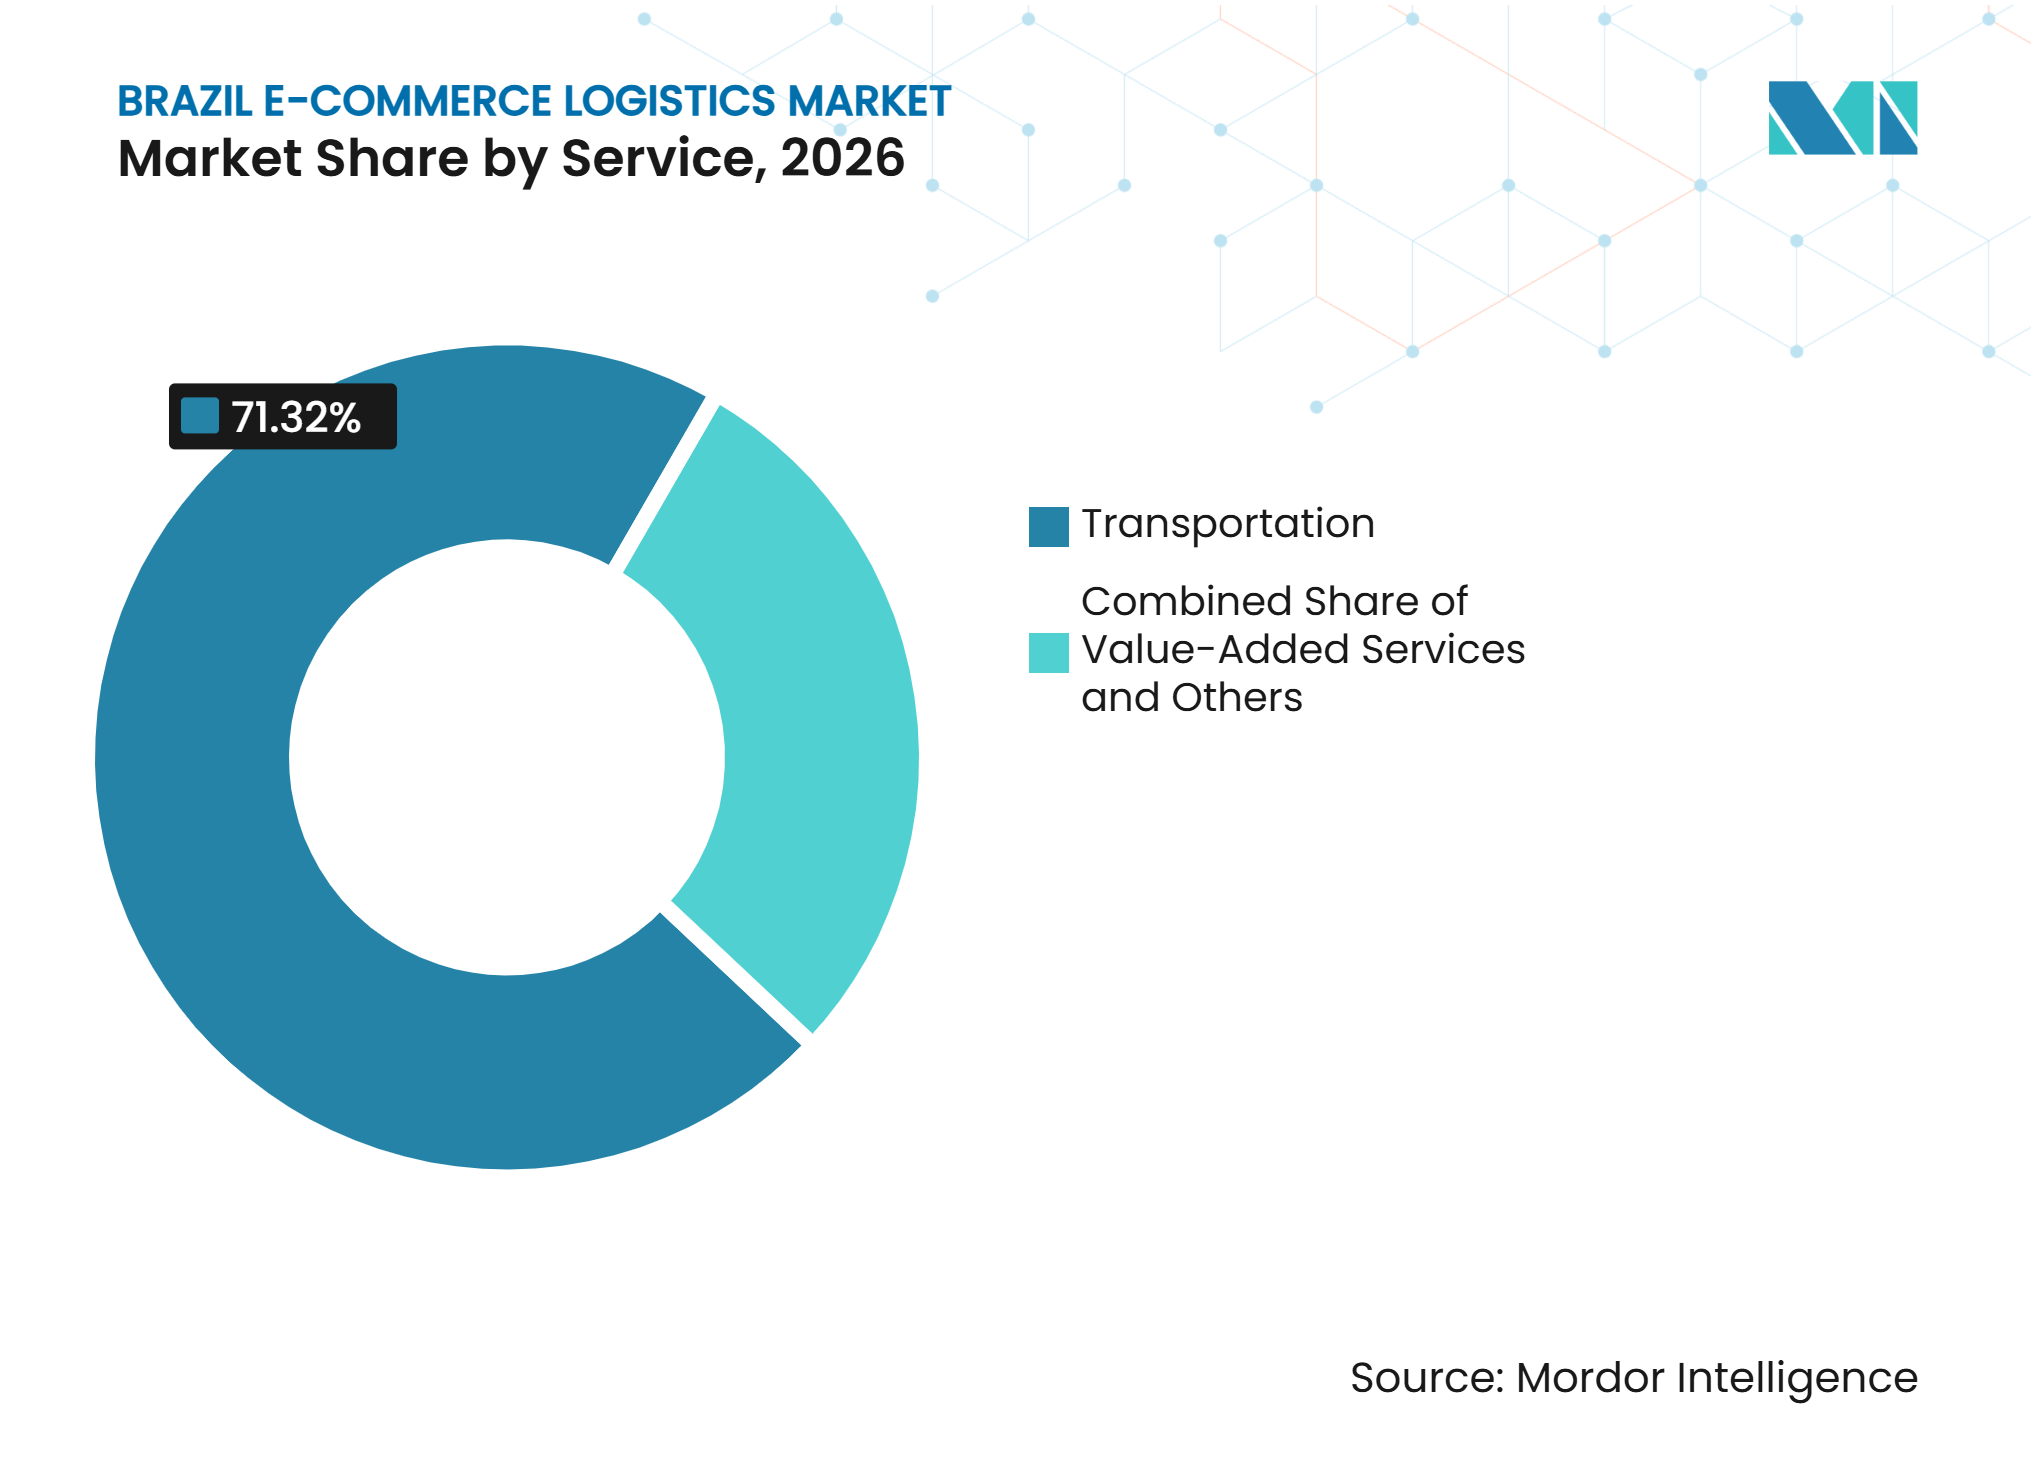
- By service, transportation accounts for 71.32% of the Brazil e-commerce logistics market share in 2026, while value-added services are projected to register a 10.31% CAGR through 2032.
- By business model, B2C accounts for 76.93% of the Brazil e-commerce logistics market size in 2026, while B2B is projected to register a 9.65% CAGR through 2032.
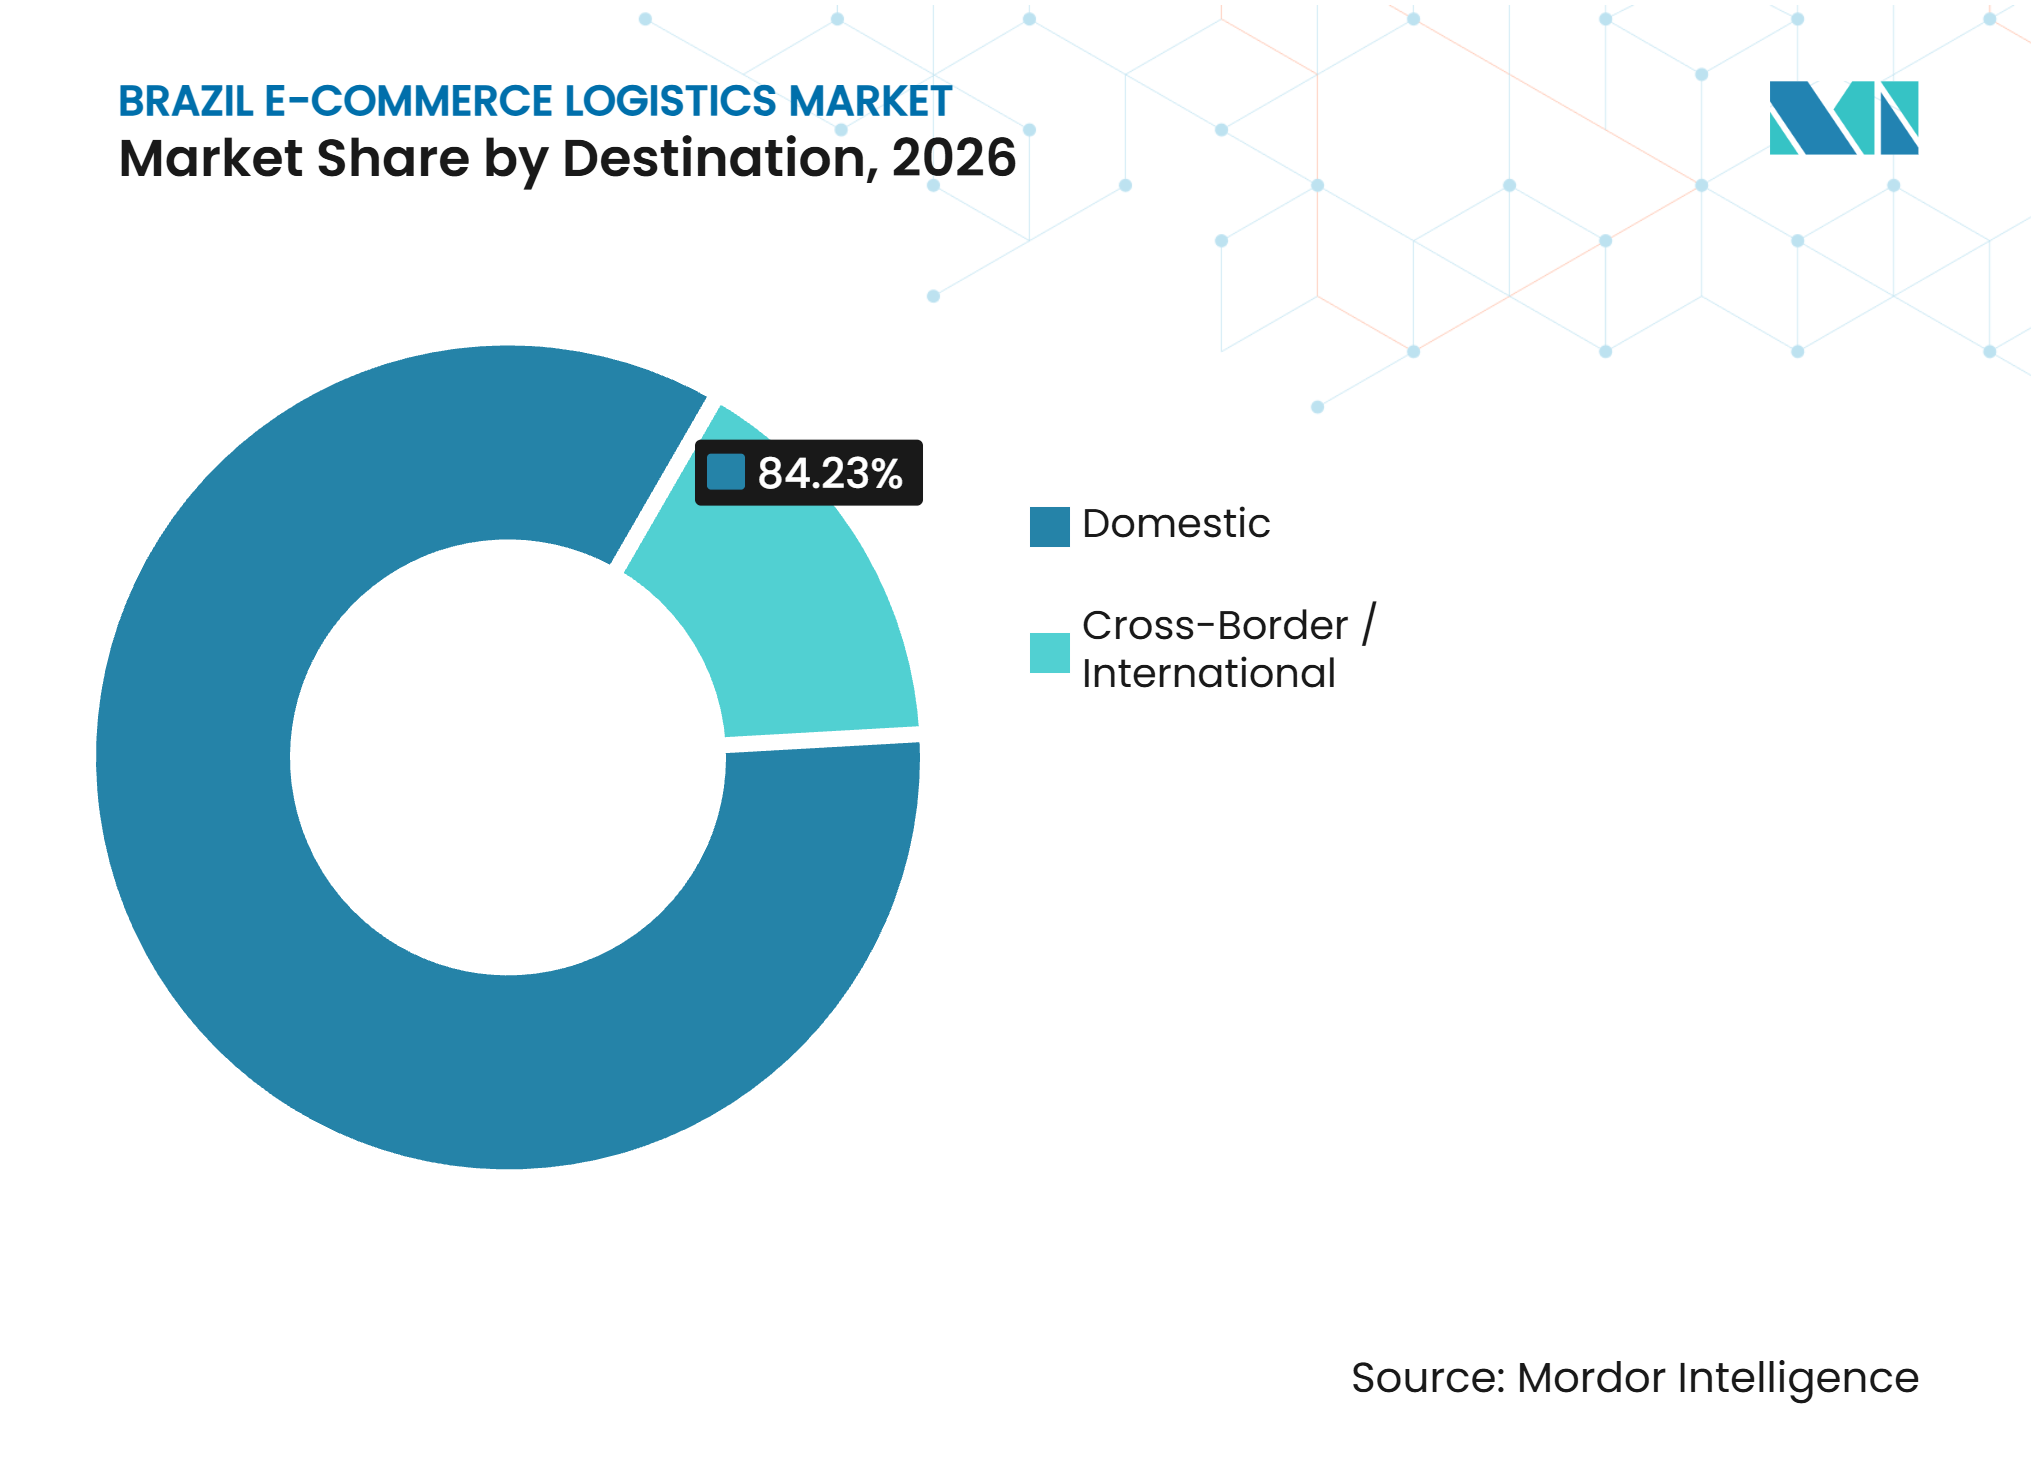
- By destination, domestic logistics accounts for 84.23% of the Brazil e-commerce logistics market share in 2026, while cross-border and international logistics is projected to register a 9.42% CAGR through 2032.
- By delivery speed, standard delivery accounts for 58.84% of the Brazil e-commerce logistics market size in 2026, while same-day delivery is projected to register a 10.28% CAGR through 2032.
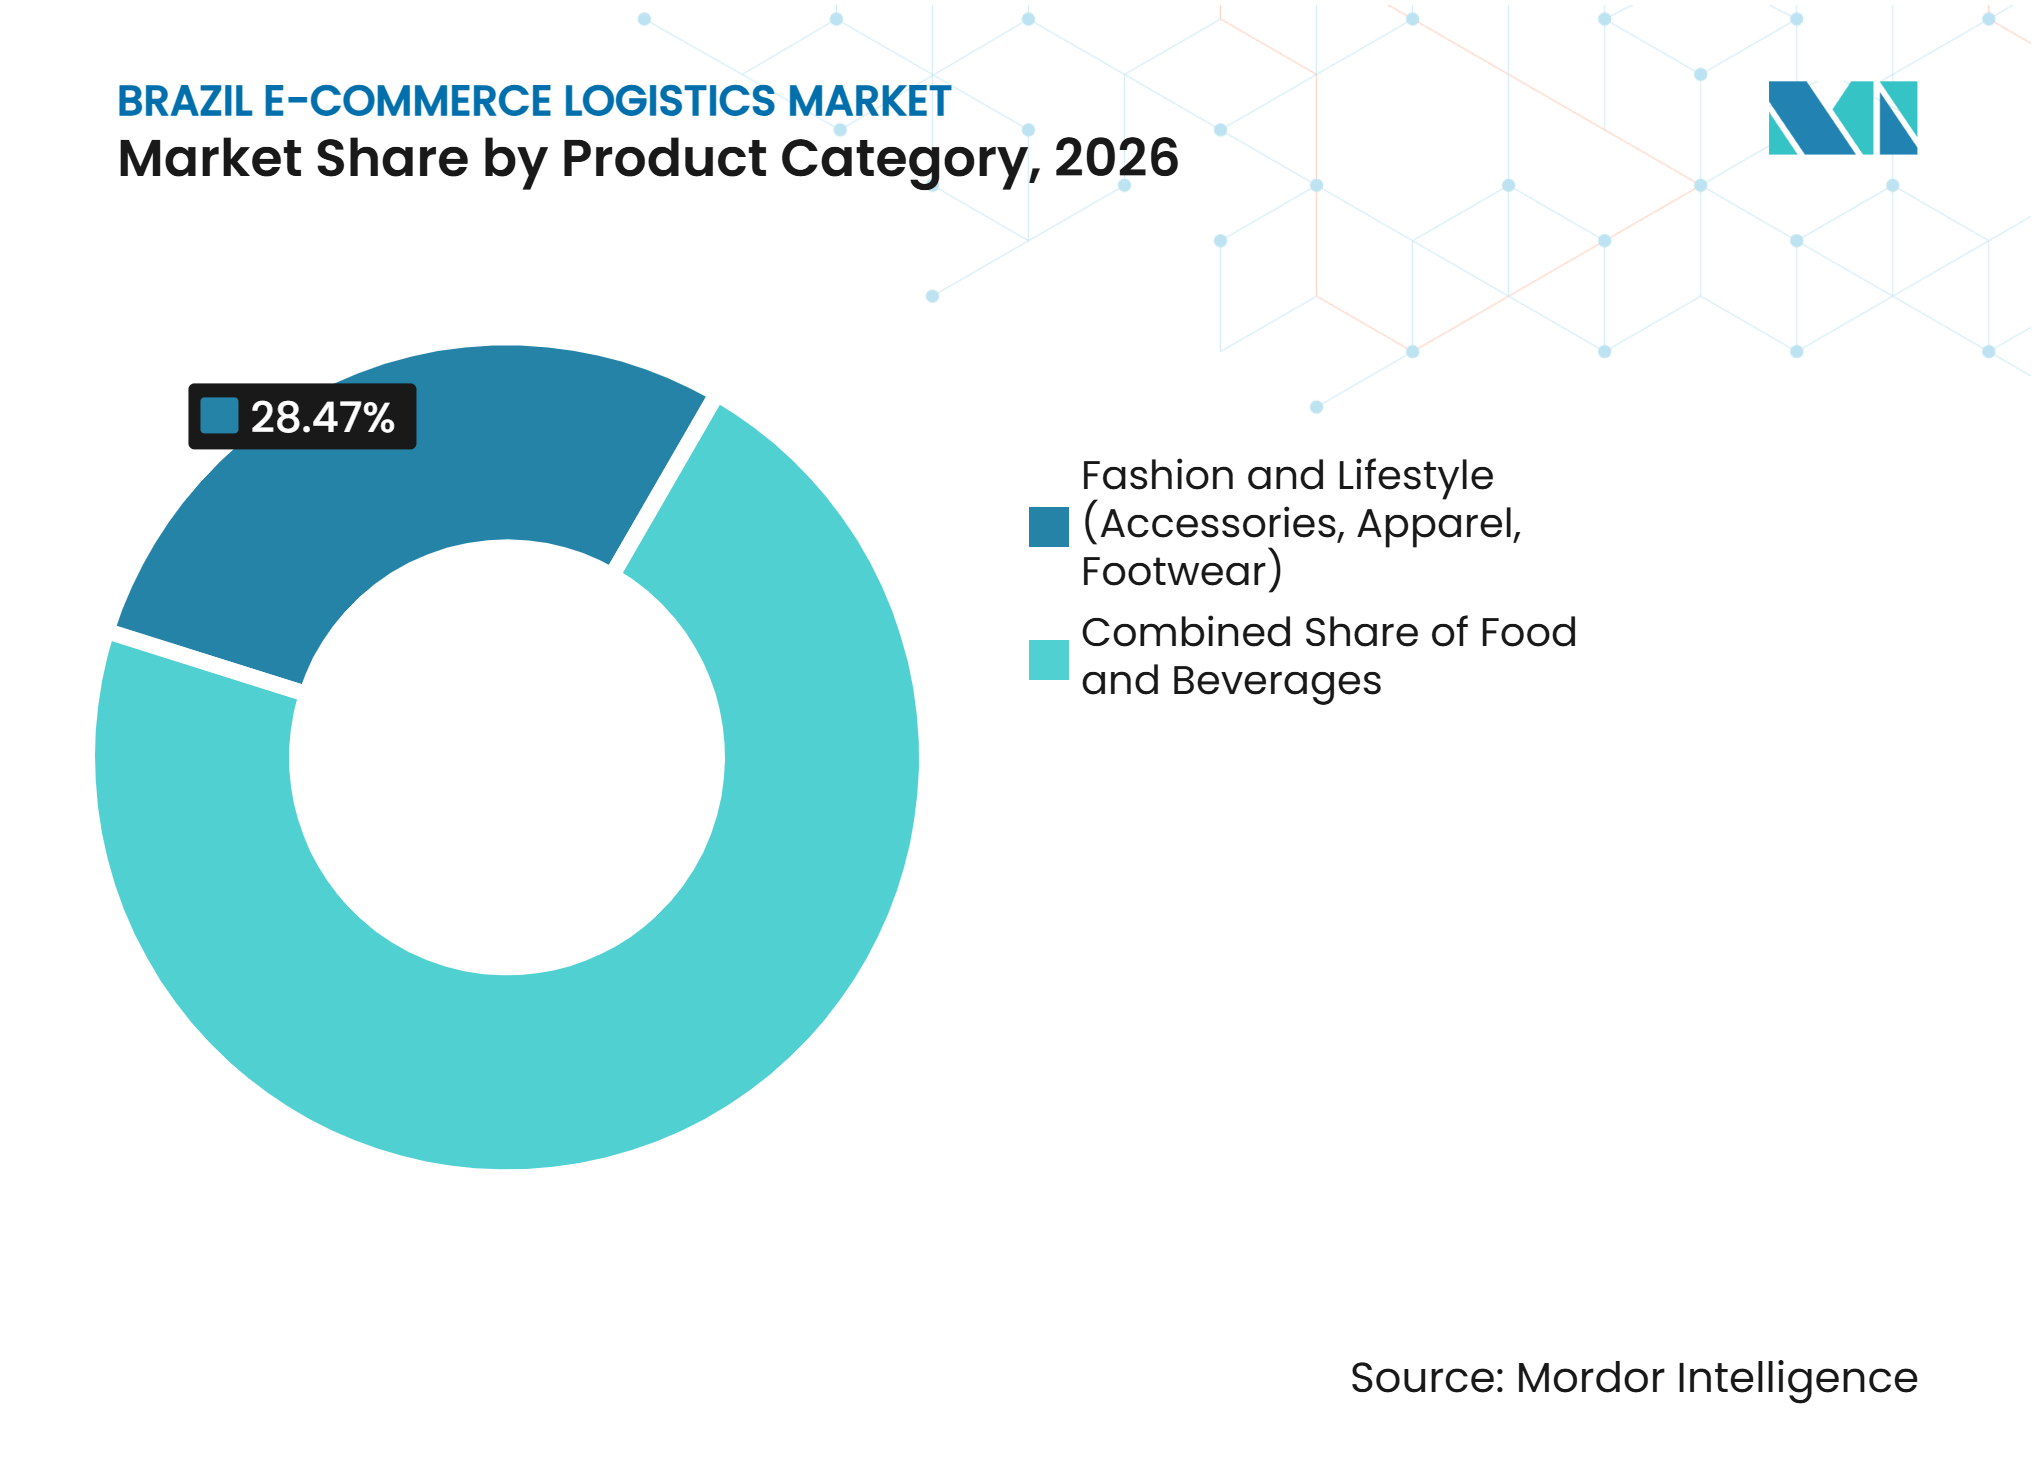
- By product category, fashion and lifestyle accounts for 28.47% of the Brazil e-commerce logistics market size in 2026, while food and beverages is projected to register a 9.63% CAGR through 2032.
- By city tier, Tier 1 cities account for 57.34% of the Brazil e-commerce logistics market share in 2026, while Tier 3 cities and below are projected to register a 10.26% CAGR through 2032.
- By geography, Southeast Brazil accounts for 50.02% of the Brazil e-commerce logistics market size in 2026, while Northeast Brazil is projected to register a 10.65% CAGR through 2032.
Note: Market numbers in this report are based on Mordor Intelligence's proprietary estimation framework, which combines nine months of actuals with Q4 projections for base year 2026.
Market Trends and Insights
Drivers Impact Analysis of Brazil E-commerce Logistics Market*
| Driver | (~) % Impact on CAGR Forecast | Geographic Relevance | Impact Timeline |
|---|---|---|---|
| Online Buyer Growth Increasing E-Commerce Logistics Demand | +2.5% | National; highest intensity in Southeast and emerging Northeast | Short term (≤ 2 years) |
| Marketplace Fulfillment Investment Expanding Distribution Network Capacity | +2.2% | National; anchored in Southeast, spilling to North, Northeast, Central-West | Medium term (2–4 years) |
| Pix Adoption Accelerating Order Processing and Settlement | +1.5% | National; strongest in Tier 2 and Tier 3 cities where SME adoption is highest | Short term (≤ 2 years) |
| Seller Decentralization Increasing Regional Fulfillment Network Requirements | +1.3% | Northeast, South, Central-West | Medium term (2–4 years) |
| Micro-Fulfillment Expansion Improving Underserved Corridor Service Coverage | +1.0% | Tier 2 and Tier 3 cities; underserved urban corridors nationwide | Long term (≥ 4 years) |
| Omnichannel Retail Growth Increasing Integrated Fulfillment Requirements | +1.2% | Southeast core; expanding to Tier 1 cities in Northeast and South | Medium term (2–4 years) |
| Source: Mordor Intelligence | |||
Online Buyer Growth Increasing E-Commerce Logistics Demand
Brazil had 94.2 million active online shoppers in 2025, creating a broad demand base for the Brazil e-commerce logistics market. The country’s online retail activity generated 438.9 million orders during the year, increasing requirements for sorting, transportation, returns, and customer communication[1]. Small and medium-sized enterprises are becoming a larger source of shipments, with Loggi reporting a 77% increase in package volumes from these firms in 2025. Their shipments originate across a wider set of locations than those of large brands, which creates demand for collection and line-haul capacity outside established corridors. Mobile purchases accounted for 79% of Brazilian e-commerce transactions, reinforcing the need for faster confirmation, fulfillment, and delivery processes.
Marketplace Fulfillment Investment Expanding Distribution Network Capacity
Marketplace investment is expanding the physical base of the Brazil e-commerce logistics industry. Mercado Libre announced BRL 57 billion (USD 10.9 billion) in Brazil investments for 2026, including 14 new fulfillment distribution centers, with logistics as the primary allocation. Amazon expanded to more than 300 logistics centers across Brazil and offers its fastest delivery service in 8 cities. These investments also create service opportunities for third-party operators that manage platform facilities or provide specialized functions. ID Logistics reported 3 new e-commerce projects in April 2026, totaling nearly 120,000 m² and more than 2,000 jobs.
Pix Adoption Accelerating Order Processing and Settlement
Pix is changing the payment step that comes before fulfillment in the Brazilian e-commerce logistics market. Instant payment confirmation can shorten the delay between a purchase and the release of an order to a warehouse. This is especially relevant for groceries, beverages, and other categories where delivery windows can be short. Pix Garantido was introduced in 2025 to support installment payments, extending the system to purchases that have traditionally depended on card installments[2]. The wider use of immediate payment confirmation can improve inventory staging and picking schedules, although the operational benefit depends on the retailer’s systems and fulfillment design.
Micro-Fulfillment Expansion Improving Underserved Corridor Service Coverage
Micro-fulfillment facilities can bring inventory closer to demand and reduce the distance traveled in the last mile. The model includes dark stores, store-based picking, and small urban staging sites that support fast-moving products. Mercado Libre’s collaboration with Assaí Atacadista uses selected wholesale-store space for micro-fulfillment staging, extending rapid delivery without building a dedicated facility for every location. Amazon has also described local engineering work that uses data to improve inventory positioning and delivery coverage. In smaller cities, these formats can offer a practical route to service expansion where parcel density does not yet justify a large distribution center. Their economics remain dependent on order density, store partnerships, and reliable replenishment from regional hubs.
Restraints Impact Analysis of Brazil E-commerce Logistics Market*
| Restraint | (~) % Impact on CAGR Forecast | Geographic Relevance | Impact Timeline |
|---|---|---|---|
| Road Dependence Limiting Multimodal Logistics Network Efficiency | -1.4% | National; most acute in North, Central-West, and long-haul interstate corridors. | Long term (≥ 4 years) |
| Last-Mile Costs Increasing Delivery and Fulfillment Expenses | -1.2% | Urban centers in Southeast and Northeast; Tier 2 and Tier 3 cities nationwide | Medium term (2–4 years) |
| Urban Congestion Increasing Failed-Delivery and Delay Risks | -0.8% | São Paulo, Rio de Janeiro, Fortaleza, Recife, Belém | Medium term (2–4 years) |
| Customs Complexity Increasing Cross-Border Logistics Processing Burden | -0.6% | National; primarily affects cross-border e-commerce import corridors | Short term (≤ 2 years) |
| Source: Mordor Intelligence | |||
Road Dependence Limiting Multimodal Logistics Network Efficiency
Road freight remains the principal transport mode for domestic cargo in Brazil, creating a lasting cost and service constraint for the Brazil e-commerce logistics market. The effect is strongest in the North and Central-West, where long distances and limited modal alternatives make delivery planning difficult. The Ministry of Transport’s National Logistics Plan 2050 seeks to improve integration among transport modes, including waterways and rail, but its impact will develop over a long period. Carriers therefore need to continue designing networks around road capacity and its operating costs during the forecast period.
Last-Mile Costs Increasing Delivery and Fulfillment Expenses
Last-mile delivery is expensive when destinations are dispersed, addresses vary, and delivery density is low. These conditions affect secondary cities and outer urban areas as much as they affect dense metropolitan areas. Warehouse availability also limits how quickly operators can position inventory closer to consumers. A shortage of well-located facilities raises occupancy costs and can slow expansion into fast-growing locations. The issue is material for Tier 3 cities and below, where the fastest city-tier growth is expected, but parcel economics are less favorable. Large networks can spread technology, route planning, and collection-point costs over more shipments, which makes it harder for new regional operators to compete.
*Our forecasts treat driver/restraint impacts as directional, not additive. The impact forecasts reflect baseline growth, mix effects, and variable interactions.
Brazil E-commerce Logistics Market Segment Analysis
By Service:
Transportation Leads Revenue, While Value-Added Services Expand FasterTransportation accounts for 71.32% of the Brazil e-commerce logistics market share in 2026, reflecting the scale of domestic parcel movement across a large country. Road transport remains the main mode because many routes have limited rail or waterway alternatives. Air cargo serves time-sensitive routes and destinations where road transit is less practical. Transportation providers must balance broad coverage with the cost of operating on congested and uneven road infrastructure. The Brazil e-commerce logistics industry therefore relies on line-haul networks, local delivery fleets, sorting facilities, and collection points that work together across long distances.
Value-added services are projected to register a 10.31% CAGR through 2032 as sellers outsource labeling, packaging, kitting, and returns work. These services help retailers prepare orders for specific channels and customer requirements. They are particularly useful for fashion, beauty, electronics, and products requiring careful presentation or handling. The Brazil e-commerce logistics market is therefore expanding beyond the movement of parcels into integrated order preparation and returns work. Warehousing and fulfillment is the second-largest service area, supported by platform and third-party investment in the Southeast and Northeast. DHL Supply Chain opened an e-commerce fulfillment center in Extrema, Minas Gerais, in January 2025, with capacity for 350,000 B2C and B2B deliveries each month[3].



By Business Model:
B2C Dominates, While B2B Gains a Larger RoleB2C accounts for 76.93% of the Brazil e-commerce logistics market size in 2026 because consumer marketplace orders remain the core source of demand. The 438.9 million orders placed in 2025 illustrate the large number of individual parcels moving through retail networks. Consumer demand requires broad delivery coverage, simple tracking, flexible delivery options, and an effective returns process. Large platforms have responded by controlling more of their fulfillment and delivery activities. This has increased the importance of network density and data coordination for carriers that serve consumer orders.
B2B is forecast to register a 9.65% CAGR through 2032 as omnichannel retailers connect store replenishment with digital fulfillment. Magazine Luiza reported that Magalog served more than 1,200 external clients and moved nearly 10 million packages per month during 2025[4]. This model allows retail-owned logistics assets to serve outside customers as well as the parent company’s sales channels. C2C remains smaller but benefits from re-commerce and peer-to-peer selling, which depend on simple parcel collection and delivery arrangements. Shared facilities can process B2C, B2B, and C2C flows, reducing the need for separate networks. The resulting overlap makes service quality, systems integration, and pricing more important points of differentiation.
By Destination:
Domestic Logistics Holds the Major Share, While Cross-Border Services Build Through ComplianceDomestic logistics accounts for 84.23% of the Brazil e-commerce logistics market share in 2026, supported by a large consumer base and the use of locally stocked high-volume products. Domestic fulfillment allows platforms to control inventory, delivery times, and customer service more directly. It also avoids many customs steps that affect international parcels. The Brazil e-commerce logistics market size for domestic activity remains tied to the growth of large marketplaces and national retail networks. Domestic volumes give carriers consistent demand for regional hubs, sorting capacity, and city-level delivery operations.
Cross-border and international logistics is projected to register a 9.42% CAGR through 2032. Brazil’s Programa Remessa Conforme allows accredited platforms to collect and prepay applicable taxes before importation, which can improve customs processing. The framework favors operators that can maintain compliant data, tax, and shipment processes at scale. Import duties under the simplified courier regime and state ICMS requirements still add complexity for non-accredited sellers. The World Customs Journal described the program as a shift toward more structured compliance in cross-border e-commerce. As a result, customs capability is becoming part of the operating model rather than a separate administrative step.

By Delivery Speed:
Standard Delivery Retains Major Share, While Same-Day Services Intensify CompetitionStandard delivery, defined as 3 to 5 days, accounts for 58.84% of the Brazil e-commerce logistics market share in 2026. It remains relevant for customers who prioritize delivery cost and for locations where very fast fulfillment is not yet economical. Standard services also support rural destinations and long-distance routes that cannot reliably meet same-day windows. The category provides a broad baseline for national network utilization. Its continued scale means that carriers need to improve cost control as well as delivery speed.
Same-day delivery is projected to register a 10.28% CAGR through 2032 as large platforms add urban fulfillment density. Mercado Libre stated that 76% of its Brazilian deliveries were completed within 48 hours in the first quarter of 2026 and 59% of express deliveries reached state capitals the following day. Amazon expanded Amazon Now to 8 cities after launching the service in São Paulo in March 2026. Faster services rely on local inventory, route planning, and dense delivery demand. Next-Day Delivery provides an important middle option in cities where new regional fulfillment hubs are shortening transit times. The segment is pushing operators to treat delivery speed as a measurable service feature rather than a secondary benefit.
By Product Category:
Fashion Leads Current Demand, While Food and Beverages Gain PaceFashion and lifestyle accounts for 28.47% of the Brazil e-commerce logistics market size in 2026, supported by the role of apparel, footwear, and accessories in online retail. These products require reliable returns handling because sizing and product choice can lead to exchanges. Fashion orders also create demand for labeling, packaging, and quality checks within fulfillment centers. The category’s large installed base helps sustain regular parcel volumes for platforms and carriers. Its distribution patterns are concentrated around major consumption centers but still require national reach.
Food and beverages are projected to register a 9.63% CAGR through 2032 as rapid-commerce services expand. The category requires close inventory placement, quick picking, and reliable delivery windows because product freshness and customer expectations are central to the service. This makes micro-fulfillment, store-based picking, and local delivery partnerships more relevant. Zé Delivery introduced Modo Turbo in 2026 for 15-minute beverage delivery, demonstrating the role of proximity inventory in this category. Healthcare and pharmacy products also require specialized storage and compliance with Brazil’s National Health Surveillance Agency requirements. Electronics and furniture create different operating needs, including careful handling, security, and heavy-load delivery capacity.
By City Tier:
Tier 1 Cities Hold the Base, While Smaller Cities Extend Network ReachTier 1 cities account for 57.34% of the Brazil e-commerce logistics market share in 2026 because they combine large consumer populations, fulfillment facilities, and frequent delivery demand. São Paulo, Rio de Janeiro, Belo Horizonte, Brasília, and Curitiba provide high shipment density and established carrier capacity. These locations can support same-day services more easily than smaller municipalities. They also remain the main testing ground for new delivery products and warehouse automation. Within the Brazil e-commerce logistics market, Tier 1 Cities retain the largest city-tier revenue position because major distribution assets remain concentrated in Brazil’s largest urban centers.
Tier 3 cities and below are forecast to register a 10.26% CAGR through 2032 as networks reach smaller municipalities. Loggi expanded from 1,000 to 1,700 pickup points and from 90 to 194 cities in 2025, targeting small and medium-sized sellers outside traditional hubs. Amazon’s national network includes more than 100 facilities in the North and Northeast, extending delivery coverage beyond the main metropolitan areas. The Brazil e-commerce logistics market is becoming more dependent on collection points, partner stores, and better routing to reduce the cost of serving these areas. Operators that establish coverage early may have an advantage because building local density takes time.
Geography Analysis
Southeast Brazil accounts for 50.02% of revenue in 2026. São Paulo is the core of the region’s fulfillment activity because it combines demand, warehouse supply, transport links, and platform investment. Mercado Libre, Amazon, and Shopee have developed large networks in or around the state. The Brazil e-commerce logistics market continues to depend on the Southeast because of its dense base of retailers, consumers, and logistics assets. The region’s tight warehouse market increases the value of facilities close to the Greater São Paulo and Greater Rio de Janeiro areas. DHL Supply Chain has used its fulfillment network in Cajamar, Jandira, Brasília, Serra, and Extrema as a base for national service, while planning new sites in Fortaleza and Porto Alegre. Delivery services are becoming faster as inventory is placed nearer to dense urban demand.
Northeast Brazil is projected to register a 10.65% CAGR through 2032. The Brazil e-commerce logistics market is gaining a broader operating base as the region moves from a redistribution destination toward a more substantial fulfillment location. Pernambuco, Bahia, and Ceará are attracting investment because they combine rising online demand with access to important regional population centers. Mercado Libre’s Simões Filho facility in Bahia is expected to create 6,500 direct and indirect jobs, showing the scale of current investment. Shopee opened a distribution center in the Recife metropolitan area in November 2026 as part of 4 new national sites that added 2.4 million packages of daily processing capacity. Amazon has extended its center network to serve more cities, while local operators are improving collection and line-haul coverage. Compliance with road transport and facility rules remains important, but the larger issue is building dependable regional capacity before demand outpaces local infrastructure.
The South is gaining logistics capacity because of its industrial base and relatively high-income cities. ID Logistics and Amazon opened a 20,000 m² fulfillment center in São José dos Pinhais, Paraná, in September 2026, with nearly 600 employees. The Central-West is becoming a redistribution location around the Federal District, as shown by CEVA’s Santa Maria facility. The North has the most difficult operating environment because distance and limited road coverage raise transport costs. The National Logistics Plan 2050 identifies modal integration as a policy priority, including waterways that could improve access in underserved corridors. Amazon’s expansion to more than 50 cities in the North indicates that national platforms are reaching areas once excluded from conventional delivery networks.
Competitive Landscape
Market Concentration
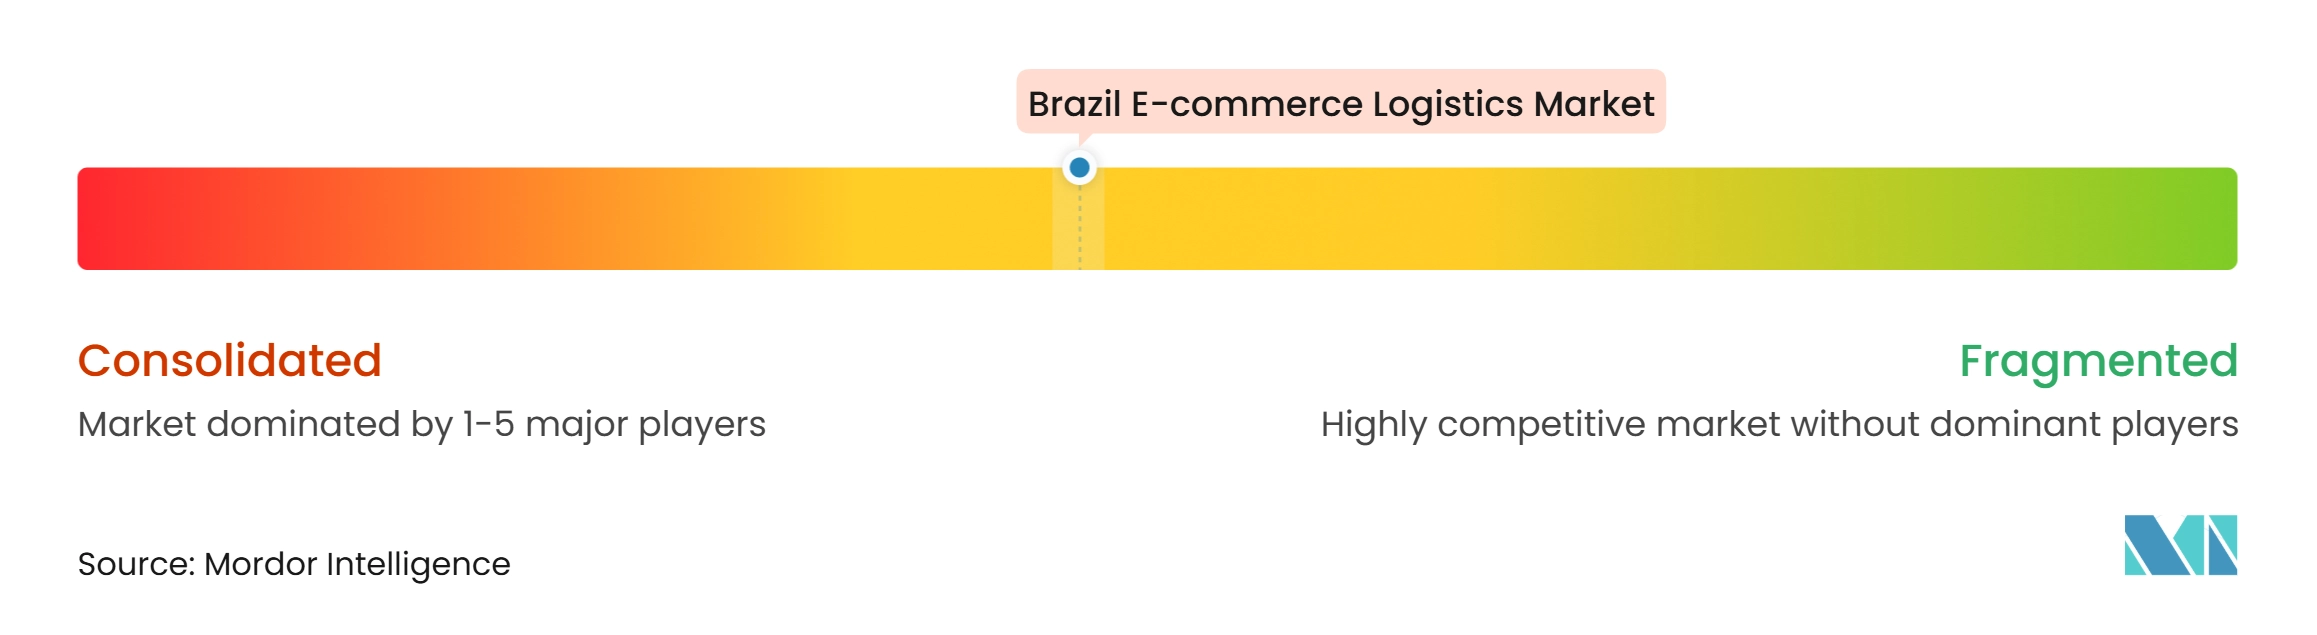
The Brazil e-commerce logistics market is moderately consolidated. Mercado Libre, Amazon, and Shopee manage significant parts of their own fulfillment and delivery activities. Their networks combine proprietary assets with contracts for third-party management and specialized services. Amazon has more than 300 logistics centers across the country, which supports broad service coverage and fast delivery options. Shopee has also expanded its national fulfillment footprint through new distribution centers and first- and last-mile locations.
Growth opportunities remain in cross-border compliance, delivery density outside Tier 1 cities, and value-added fulfillment. Loggi’s 1,700 pickup points in 194 cities demonstrate the value of local collection coverage for smaller sellers. Technology investment also matters as providers use automation and data systems to improve picking, sorting, and route design. Mercado Libre deployed 125 robotics units at a São Paulo fulfillment center in 2025, processing up to 105,000 items per day and reducing multi-order processing time by 25%.
FedEx ended domestic parcel delivery operations in Brazil in February 2026 but continued to invest in international and supply-chain facilities, which limits its role in the core domestic last-mile segment. Competition is likely to remain strongest where operators can combine dense physical networks, compliant systems, and consistent delivery performance.
Brazil E-commerce Logistics Industry Leaders
-
Empresa Brasileira de Correios e Telégrafos (Correios)
-
Loggi
-
Total Express
-
DHL Group
-
CMA CGM Group (CEVA Logistics)
- *Disclaimer: Major Players sorted in no particular order
Brazil E-commerce Logistics Market Companies Covered in this Report
- MercadoLibre Inc. (Mercado Envios)
- Empresa Brasileira de Correios e Telégrafos (Correios)
- Amazon Brasil (Amazon Logistics)
- Shopee Brasil (SPX Express)
- Magazine Luiza SA (Magalog)
- Loggi
- Total Express
- Jadlog Logística SA
- J&T Express Brazil
- DHL Group
- CMA CGM Group (CEVA Logistics)
- ID Logistics Group
- Braspress Transportes Urgentes
- BBM Logística SA
- Azul SA (Azul Cargo Express)
- GOL Linhas Aéreas SA (GOLLOG)
- FedEx Corp.
- United Parcel Service Inc.
- Penske Logistics LLC
- FM Logistic
Recent Industry Developments in Brazil E-commerce Logistics Market
- November 2026: Shopee opened 4 new distribution centers in Recife metropolitan area, Rio de Janeiro, Espírito Santo, and Blumenau, adding 2.4 million daily package-processing capacity and bringing its total to 30 DCs and 200+ first/last-mile hubs nationwide.
- October 2026: MercadoLibre confirmed it will close 2026 with 72 large-scale logistics centers in Brazil, up 39% from 2025, including 30 fulfillment centers, 3.3 million m² of logistics space, and 8,000+ delivery vehicles.
- September 2026: MercadoLibre launched "Envios Agora," a 60-minute proximity delivery service for eligible items up to 15 kg, first deployed for select sellers in São Paulo, complementing existing same-day and next-day options and expanding the fastest-delivery tier beyond food and beverages.
- September 2026: ID Logistics and Amazon inaugurated Brazil's first Amazon fulfillment center in Paraná, São José dos Pinhais, 20,000 m² and nearly 600 employees, extending same-day delivery availability to Paraná state consumers.
Brazil E-commerce Logistics Market Report Scope
Segmentation Overview
| Transportation | Road |
| Rail | |
| Air | |
| Sea | |
| Warehousing and Fulfillment | |
| Value-Added Services (Labeling, Packaging, Kitting) |
| B2C |
| B2B |
| C2C |
| Domestic |
| Cross-Border / International |
| Same-Day (Less than 24 Hours) |
| Next-Day (24-48 Hours) |
| Standard (3-5 Days) |
| Others (More than 5 Days) |
| Food and Beverages |
| Personal and Household Care |
| Fashion and Lifestyle (Accessories, Apparel, Footwear) |
| Furniture and Home Products |
| Consumer Electronics and Household Appliances |
| Healthcare and Pharmacy |
| Other Products |
| Tier 1 Cities |
| Tier 2 Cities |
| Tier 3 Cities and Below |
| North |
| Northeast |
| Central-West |
| Southeast |
| South |
| By Service | Transportation | Road |
| Rail | ||
| Air | ||
| Sea | ||
| Warehousing and Fulfillment | ||
| Value-Added Services (Labeling, Packaging, Kitting) | ||
| By Business Model | B2C | |
| B2B | ||
| C2C | ||
| By Destination | Domestic | |
| Cross-Border / International | ||
| By Delivery Speed | Same-Day (Less than 24 Hours) | |
| Next-Day (24-48 Hours) | ||
| Standard (3-5 Days) | ||
| Others (More than 5 Days) | ||
| By Product Category | Food and Beverages | |
| Personal and Household Care | ||
| Fashion and Lifestyle (Accessories, Apparel, Footwear) | ||
| Furniture and Home Products | ||
| Consumer Electronics and Household Appliances | ||
| Healthcare and Pharmacy | ||
| Other Products | ||
| By City Tier | Tier 1 Cities | |
| Tier 2 Cities | ||
| Tier 3 Cities and Below | ||
| By Region | North | |
| Northeast | ||
| Central-West | ||
| Southeast | ||
| South |
Key Questions Answered in the Report
What is the projected value of Brazil e-commerce logistics by 2032?
It is projected to reach USD 14.18 billion by 2032, from USD 9.26 billion in 2027, at an 8.90% CAGR.
Which service accounts for the largest share of e-commerce logistics activity in Brazil?
Transportation leads with 71.32% of revenue in 2026, reflecting the scale of domestic parcel movement and road-based freight.
Which delivery speed is growing the fastest in Brazil?
Same-day delivery is forecast to register a 10.28% CAGR through 2032 as platforms add local inventory and dense urban delivery capacity.
Why is Northeast Brazil important for logistics operators?
Northeast Brazil is forecast to register a 10.65% CAGR through 2032, supported by new fulfillment sites and rising regional order volumes.
How does Pix affect online order fulfillment?
Instant confirmation can reduce the delay between payment and warehouse release, helping retailers process time-sensitive orders more quickly.
What are the main barriers to efficient e-commerce delivery in Brazil?
Road dependence, dispersed destinations, high last-mile costs, warehouse constraints, and cross-border compliance requirements raise operating complexity.