
Bio Hydrogen Market Size and Share
Market Overview
| Study Period | 2021 - 2031 |
|---|---|
| Market Size (2026) | USD 86.34 Million |
| Market Size (2031) | USD 120.25 Million |
| Growth Rate (2026 - 2031) | 6.85 % |
| Fastest Growing Market | Asia-Pacific |
| Largest Market | Asia-Pacific |
| Market Concentration | Low |
Major Players *Disclaimer: Major Players sorted in no particular order Image © Mordor Intelligence. Reuse requires attribution under CC BY 4.0. | |
Bio Hydrogen Market Analysis by Mordor Intelligence
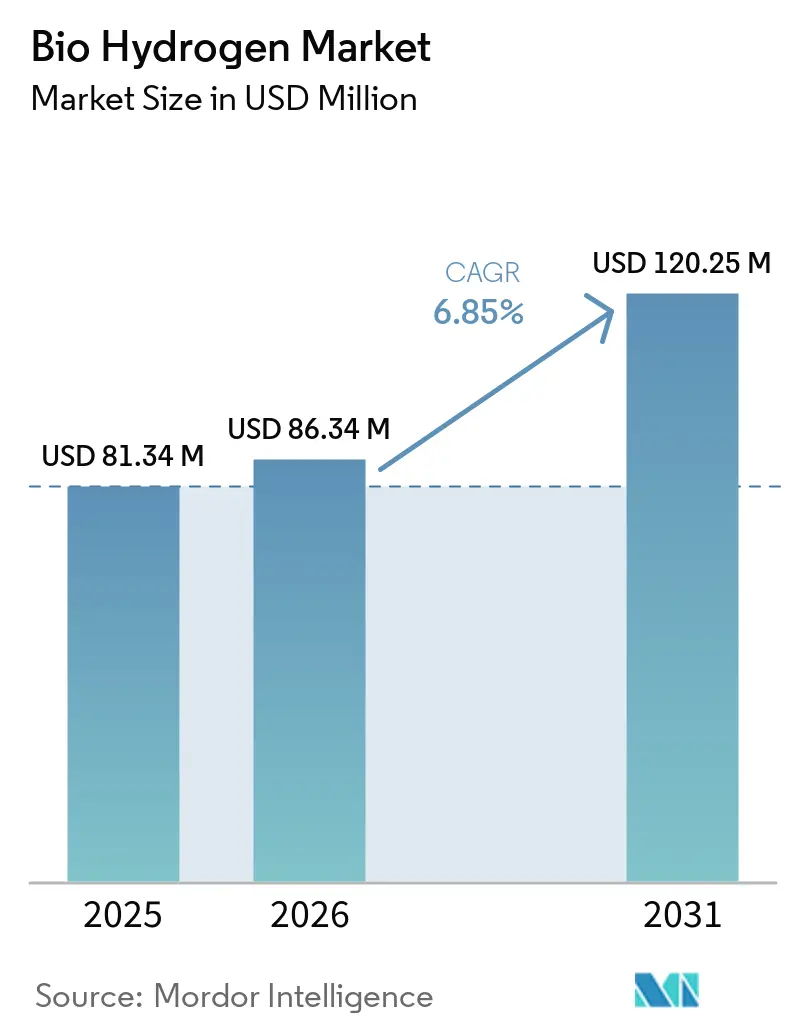
The bio hydrogen market size was estimated at USD 81.34 million in 2025 and is estimated to grow from USD 86.34 million in 2026 to USD 120.25 million by 2031, at a CAGR of 6.85% during the forecast period (2026-2031). The bio hydrogen market is supported by decarbonization requirements in sectors where direct electrification is difficult. Agricultural residues, food waste, and wastewater provide a feedstock base that links waste management with hydrogen production. Producers can use gasification, dark fermentation, and photofermentation, although their commercial readiness varies. Carbon capture can strengthen the value of biogenic hydrogen by supporting negative-emissions claims and access to certification programs. Public funding, tax credits, and procurement rules are increasing the relevance of the bio hydrogen market to established energy and industrial supply chains.
Key Report Takeaways
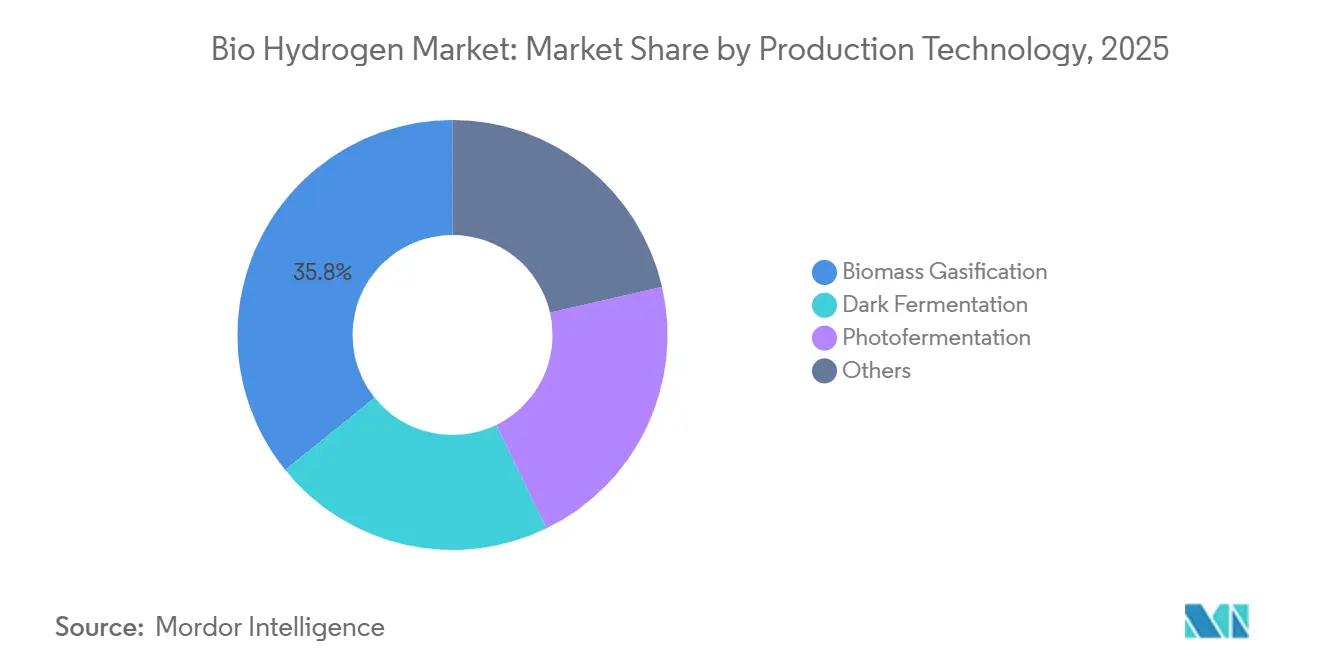
- By production technology, biomass gasification held 35.80% of the bio hydrogen market share in 2025 and is projected to grow at a CAGR of 7.35% through 2031.
- By feedstock, agricultural residues accounted for 38.12% of the bio hydrogen market share in 2025, while food and organic waste are projected to grow at a CAGR of 7.52% through 2031.
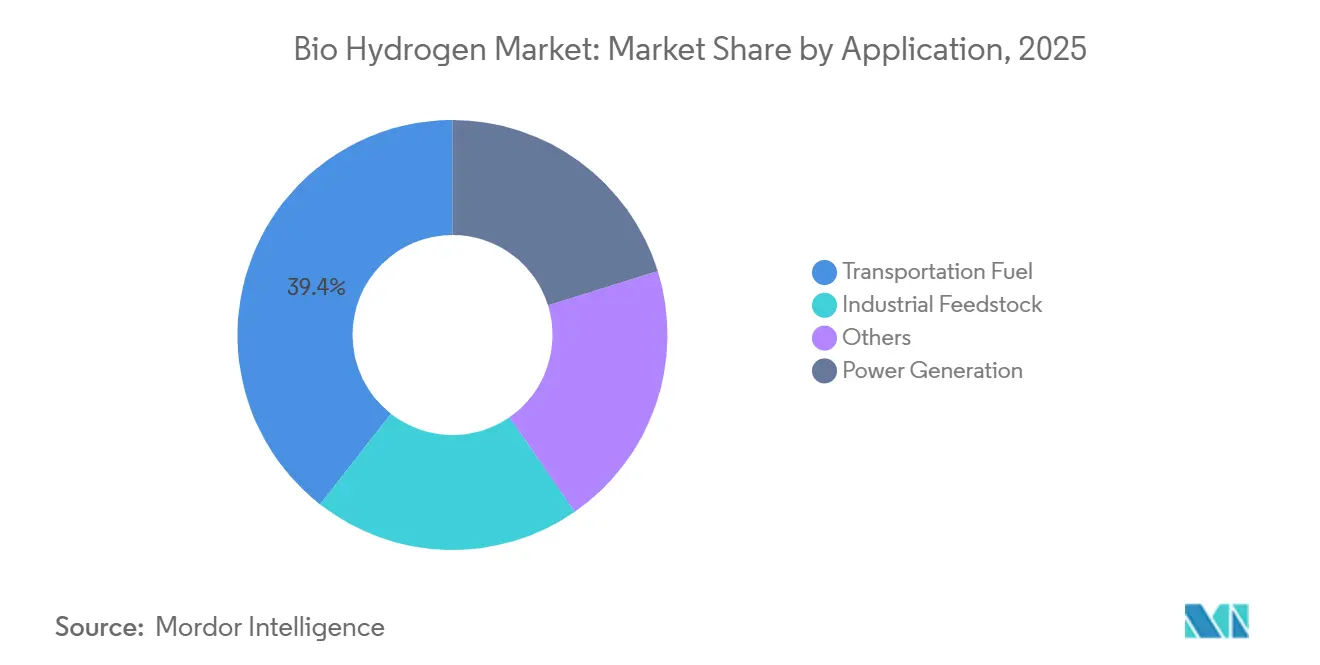
- By application, transportation fuel represented 39.44% of the bio hydrogen market size in 2025, while power generation is projected to grow at a CAGR of 8.06% through 2031.
- By geography, Asia-Pacific held 29.71% of the bio hydrogen market share in 2025 and is projected to expand at the highest regional CAGR of 7.29% through 2031.
Note: Market size and forecast figures in this report are generated using Mordor Intelligence’s proprietary estimation framework, updated with the latest available data and insights as of January 2026.
Market Trends and Insights
Drivers Impact Analysis of Bio Hydrogen Market*
| Drivers | (~) % Impact on CAGR Forecast | Geographic Relevance | Impact Timeline |
|---|---|---|---|
| Decarbonization of Hard-to-Abate Hydrogen Demand | +1.8% | Global; near-term gains in the EU, Japan, South Korea | Medium term (2–4 years) |
| Waste-Stream Valorization and Circular Hydrogen Production | +1.5% | APAC core (China, India); spillover to the EU and South America | Medium term (2–4 years) |
| Policy Incentives and Hydrogen Certification Demand | +1.6% | EU, North America, Japan | Short to medium term (≤ 4 years) |
| Fuel-Cell and Low-Carbon Fuel Adoption | +1.2% | China, Germany, the US, Japan, South Korea | Medium term (2–4 years) |
| Integrated Bio hydrogen with Carbon Capture and Co-Products | +0.6% | UK, EU, US, Australia | Long term (≥ 4 years) |
| Source: Mordor Intelligence | |||
Decarbonization of Hard-to-Abate Hydrogen Demand
The biohydrogen market benefits from pressure on steel, refining, cement, and ammonia producers to obtain verifiable low-carbon hydrogen. These sectors cannot fully rely on direct electrification, making the origin and emissions profile of hydrogen more commercially important. By early June 2026, 13 European Union member states had completed the transposition of the Renewable Energy Directive for transport. The resulting framework created demand for more than 575 kilotons per annum (ktpa) of low-emission hydrogen with documented sustainability attributes [1]. Biomass gasification paired with carbon capture can meet negative-emissions requirements under CertifHy and support compliance with hydrogen quality standards under the ISO 19880 series. A UK assessment identified biomass gasification with carbon capture and storage as the most commercially advanced Hydrogen Bioenergy with Carbon Capture and Storage (H₂BECCS) route, while hybrid gasification and solid oxide fuel cell systems achieved efficiencies of up to 55%.
Carbon capture changes the role of biogenic hydrogen within the biohydrogen market by enabling a certified negative-emissions product. This feature is relevant where buyers require documented sustainability attributes rather than only lower operational emissions. It also helps differentiate biogenic pathways from hydrogen produced through electrolysis when grid emissions remain material. The resulting premium is tied to traceability across feedstock collection, conversion, capture, and delivery. Developers therefore need to treat certification systems as part of project design rather than as an administrative step after production begins. This requirement favors projects that can document both the origin of the biomass and the emissions associated with each conversion stage.
Waste-Stream Valorization and Circular Hydrogen Production
Waste conversion supports the biohydrogen market by turning a disposal obligation into a potential production input. In May 2024, China reported annual agricultural, forestry, and urban organic waste output exceeding 3.5 billion tons. The reported utilization rate was below 14%, resulting in a substantial feedstock surplus for projects capable of collecting and processing these materials. Waste handlers can reduce disposal costs and exposure to landfill, while hydrogen producers can obtain feedstocks at low or negative cost. This structure can improve project economics in ways that a single growth rate does not capture. It also connects the biohydrogen market with circular economy policies and local waste-management obligations.
Food waste, municipal organic material, and agricultural residues differ in moisture content, contaminants, and handling requirements. These differences influence which biological or thermochemical route is appropriate at each site. Project economics improve when a single site can manage waste, produce hydrogen, and meet environmental obligations. Such projects require reliable collection systems and clear agreements with waste owners. Site-level projects can combine avoided waste-tipping fees with hydrogen sales and environmental compliance. This model is relevant where waste owners, municipalities, and hydrogen buyers can coordinate long-term contracts.
Policy Incentives and Hydrogen Certification Demand
The biohydrogen market is shaped by auctions, tax credits, and certification systems that reduce uncertainty for developers and investors. Italy's program, approved by the European Commission in March 2026 under state-aid rules, provides for auctions of up to EUR 400 million (USD 462 million) per year through 2029, with 15-year commitments totaling EUR 6 billion (USD 6.93 billion). These mechanisms improve revenue visibility for qualifying hydrogen pathways and increase the importance of documenting lifecycle emissions and feedstock provenance. Auction design may reward projects that can demonstrate credible delivery schedules and compliance with sustainability requirements.
The U.S. Internal Revenue Service finalized the Section 45V clean hydrogen production credit regulations in January 2025. The maximum credit was USD 3.185 per kg for projects meeting the relevant lifecycle emissions conditions. A 2025 analysis found that waste-stream dark fermentation with carbon sequestration could achieve lifecycle emissions of minus 8.6 kg CO₂-eq per kg H₂. Article 27 of the Renewable Energy Directive and related delegated acts recognize biogenic hydrogen routes. Such requirements can convert policy support into durable demand where buyers need a certified supply. The biohydrogen market, therefore, depends on both financial support and consistent application of emissions and traceability rules.
Fuel-Cell and Low-Carbon Fuel Adoption
Transportation fuel remained the largest application in the biohydrogen market, as fuel cell fleets and low-carbon procurement rules created demand for hydrogen with documented characteristics. The United States had 855 fuel cell electric buses by July 2025, representing a 49% year-over-year increase. California planned to deploy more than 2,600 fuel cell electric buses by 2040 under its Innovative Clean Transit regulation. Fleet operators can generate longer-term demand because vehicle procurement is often tied to public decarbonization commitments. Biogenic supply is relevant where procurement requirements specify sustainability documentation. The growth of fleet demand still depends on reliable fueling, storage, and distribution systems.
China had 11,300 fuel cell trucks at the end of 2024, accounting for nearly 95% of global fuel cell commercial vehicle deployments. Japan and South Korea also use policy frameworks to support hydrogen applications in transport and stationary power. The FuelEU Maritime and ReFuelEU Aviation rules underscore the importance of documented fuel attributes for relevant buyers in Europe. The biohydrogen market can meet this demand when projects provide reliable documentation of quality and sustainability. Fuel cells are not the only source of future demand, as industrial users also require replacements for conventional hydrogen. Transport procurement, however, provides a visible route from policy commitments to hydrogen offtake.
Restraints Impact Analysis of Bio Hydrogen Market*
| Restraints | (~) % Impact on CAGR Forecast | Geographic Relevance | Impact Timeline |
|---|---|---|---|
| High Unit Production Cost and Low Hydrogen Yield | -0.9% | Global; most acute in North America and the EU | Short to medium term (≤ 4 years) |
| Immature Storage, Distribution, and Offtake Infrastructure | -0.6% | APAC emerging markets, South America, MEA | Medium term (2–4 years) |
| Feedstock Contaminant Variability and Biological Process Inhibition | -0.4% | Global; concentrated in mixed industrial-agricultural waste regions | Long term (≥ 4 years) |
| Source: Mordor Intelligence | |||
High Unit Production Cost and Low Hydrogen Yield
Production cost remains the most immediate restraint on the bio hydrogen market, especially for biological conversion pathways. Variable feedstock composition can limit yields and prevent the scale benefits available to large electrolysis and steam methane reforming facilities. A 2025 techno-economic analysis found that dark fermentation integrated with microbial electrolysis cells produced hydrogen at USD 17-30 per kg at a current density of 20 A/m². Raising current density to 100 A/m² reduced the modeled cost to USD 4-6.9 per kg. Higher current density also raises materials durability concerns that remain unresolved in commercial operation. Incentives can narrow the gap, but they do not eliminate technical and financial risks in unsupported locations.
Feedstock contaminants pose another limitation, as mixed organic material can inhibit biological processes and complicate plant operations. Agricultural and industrial waste streams may require sorting, pretreatment, or process controls before conversion. These requirements can raise capital and operating costs at smaller distributed sites. Technology selection must account for moisture content, chemical composition, and supply consistency. Carbon-credit or waste-fee revenue can improve the economics, but neither revenue stream removes the need for stable hydrogen yields. The bio hydrogen market will need operating models that manage feedstock quality as carefully as they manage hydrogen output.
Immature Storage, Distribution, and Offtake Infrastructure
The bio hydrogen market faces a supply and demand imbalance that stems from limited hydrogen logistics rather than a lack of announced production. In the Asia-Pacific region, contract awards fell from 54 in 2024 to 27 in 2025. At the same time, 221 projects outside China remained in the pipeline, with a combined capital expenditure of USD 240 billion. The project backlog indicates that transport, storage, and buyer arrangements can delay investment decisions. Small and dispersed bio hydrogen sites often lack access to centralized pipeline systems, and their delivery costs can therefore exceed those of larger projects located near industrial demand centers.
Offtaker availability is a recurring concern for project developers. The UK Hydrogen Bioenergy with Carbon Capture and Storage (H₂BECCS) assessment noted that reliable long-term offtake arrangements are important for financing and commercial development. Without these contracts, lenders may apply higher risk premiums, and developers may postpone construction. Distribution infrastructure must also meet purity, safety, and reliability requirements. This raises the importance of local demand clusters, including wastewater plants, industrial facilities, and fleet depots. The bio hydrogen market is likely to progress more quickly where feedstock supply and end-use demand are in close proximity.
*Our forecasts treat driver/restraint impacts as directional, not additive. The impact forecasts reflect baseline growth, mix effects, and variable interactions.
Bio Hydrogen Market Segment Analysis
By Production Technology:
Biomass Gasification Extends Dual Lead in Share and GrowthBiomass gasification held 35.80% of the bio hydrogen market share in 2025 and recorded the highest projected CAGR of 7.35% through 2031. This dual position reflects its established role and continued growth potential. Gasification can process solid lignocellulosic materials available across agricultural and forestry supply chains. It also aligns with carbon capture systems that can improve emissions performance. IEA Bioenergy Task 33 identified gasification as the pathway with the highest confidence in H₂BECCS deployment projections through 2050. The assessment cited established global commercial operations, alongside the carbon-capture layer.

By Feedstock:
Agricultural Residues Dominate While Food and Organic Waste AccelerateAgricultural residues accounted for 38.12% of the bio hydrogen market share in 2025. Their position reflects wide availability, geographic dispersion, and compatibility with gasification systems that process solid lignocellulosic material. Lower moisture content can improve handling compared with several competing feedstocks. A 2026 life-cycle assessment found that rice-straw gasification and dark fermentation in Thailand produced global warming potentials of 14.2-14.6 kg CO₂-eq per kg H₂. This represented a 55-60% reduction relative to fossil hydrogen, at 30-35 kg CO₂-eq per kg H₂. These results support sustainability claims for agricultural-residue pathways.
China published the T/CNMN 153-2026 standard on the utilization of agricultural waste in July 2026. The standard introduced traceability requirements that can favor operators with established digital supply-chain monitoring. Food and organic waste were projected to grow at a CAGR of 7.52% through 2031. Avoided waste-tipping fees and hydrogen revenue support this growth potential. Integrated dark fermentation and microbial electrolysis systems processing food waste achieved yields of up to 1,608.6 ± 266.2 mL H₂ per gram of chemical oxygen demand consumed. These systems also achieved a chemical oxygen demand removal efficiency of 78.5 ± 5.7%. Wastewater and sewage sludge remain relevant, as zero-gap microbial electrolysis cells using real anaerobic digester effluent sustained 32 ± 6 L/L/day over 30 days.
By Application:
Transportation Fuel Leads and Power Generation Advances FastestTransportation fuel represented 39.44% of the bio hydrogen market size in 2025. Fleet decarbonization mandates and growth in fuel cell vehicle adoption support its leading position. Public fleet purchases can create contracted demand for hydrogen, particularly where operators must meet emissions targets. The United States had 855 fuel cell electric buses by July 2025, indicating continued deployment. China had 11,300 fuel cell trucks at the end of 2024, underscoring regional transport demand. Certified biogenic supply can attract attention where buyers require fuel sustainability documentation.
Power generation was projected to record the highest application CAGR, at 8.06%, through 2031. Japan had selected 6 projects under its contracts-for-difference program by late May 2026. These awards covered nearly 130 kilotons per annum (ktpa) of annual low-emissions hydrogen support for stationary applications. Japan and South Korea remain central to policy-backed hydrogen power deployment. Industrial feedstock use in refining, ammonia, and chemicals is the third application segment. The Global Hydrogen Review 2025 stated that demand in these sectors was still almost entirely met by conventional hydrogen. This presents a substitution opportunity for certified bio hydrogen as voluntary commitments and regulatory thresholds become more stringent.
Geography Analysis
APAC Bio Hydrogen Market
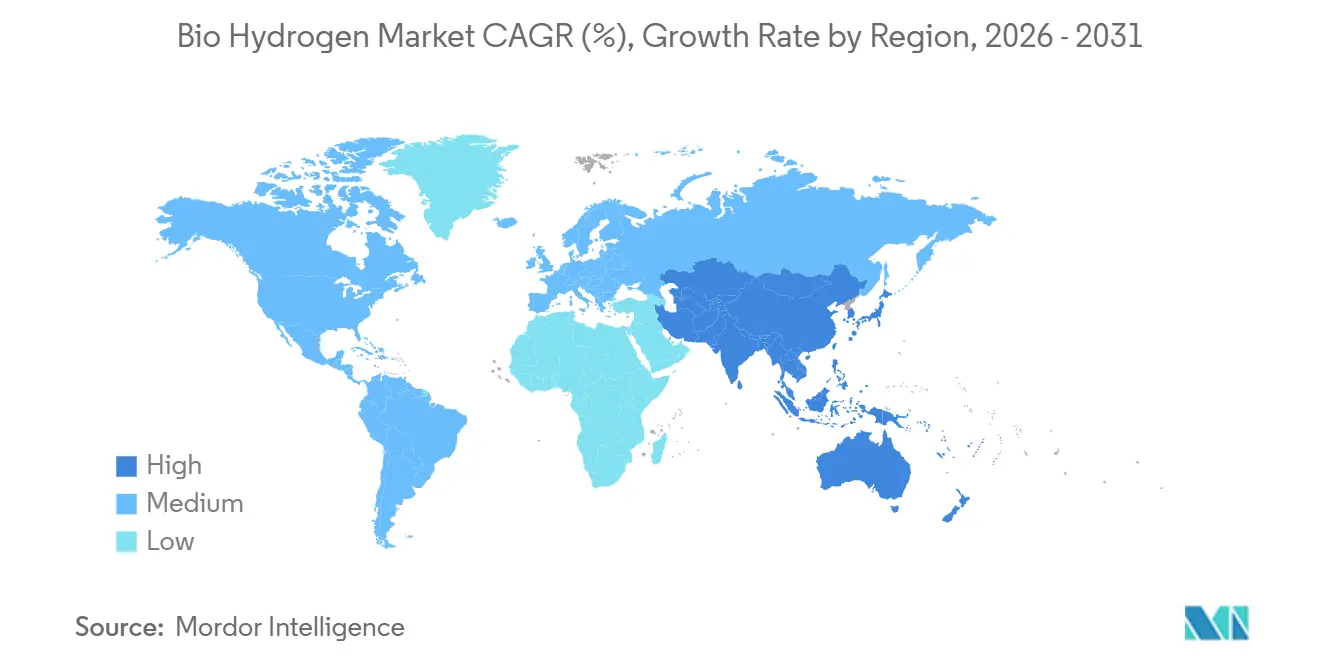
Asia-Pacific held 29.71% of the bio hydrogen market share in 2025 and was projected to record the highest regional CAGR of 7.29% through 2031. The region benefits from extensive biomass availability, government commitments, and expanding fuel cell deployment. China's 15th Five-Year Plan identifies biogenic hydrogen as a strategic priority. A March 2026 notice from the Ministry of Industry and Information Technology, the Ministry of Finance, and the National Development and Reform Commission directed city-cluster investments toward diverse hydrogen end uses, specifically supporting bio hydrogen from agricultural and organic waste streams. India had 60 active hydrogen projects with an estimated combined investment of USD 105 billion, while early ammonia offtake agreements helped developers secure buyers.
APAC, North America and Europe Bio Hydrogen Market
Japan had issued contracts for difference supporting nearly 130 ktpa of low-emission hydrogen by late May 2026. South Korea is positioning itself as a bio hydrogen import hub for biomass-rich ASEAN economies. Thailand and Indonesia present a supporting case, as rice-straw pathways showed a 55-60% reduction in warming potential compared to fossil hydrogen. North America and Europe held the second- and third-largest regional shares, respectively. In the United States, Section 45V can support qualifying projects with verified lifecycle-emissions performance. Europe's policy influence is also channeled through hydrogen auction mechanisms and sustainability rules.
EMEA and South America Bio Hydrogen Market
The European Hydrogen Bank's third auction awarded more than EUR 1 billion (USD 1.16 billion) to 9 projects across 7 European Economic Area countries, representing nearly 1.1 GW of capacity[2]. South America, the Middle-East, and Africa remain earlier-stage regions within the bio hydrogen market. Brazil can leverage its ethanol infrastructure for on-site reforming, avoiding greenfield gasification investment. Saudi Arabia's Vision 2030 program is driving upstream hydrogen investment that could incorporate biogenic feedstocks as waste frameworks develop. Regulatory differences and infrastructure shortages constrain near-term progress in the Middle-East and Africa, although future export corridors and EU certification requirements could create a longer-term role for these regions.
Competitive Landscape
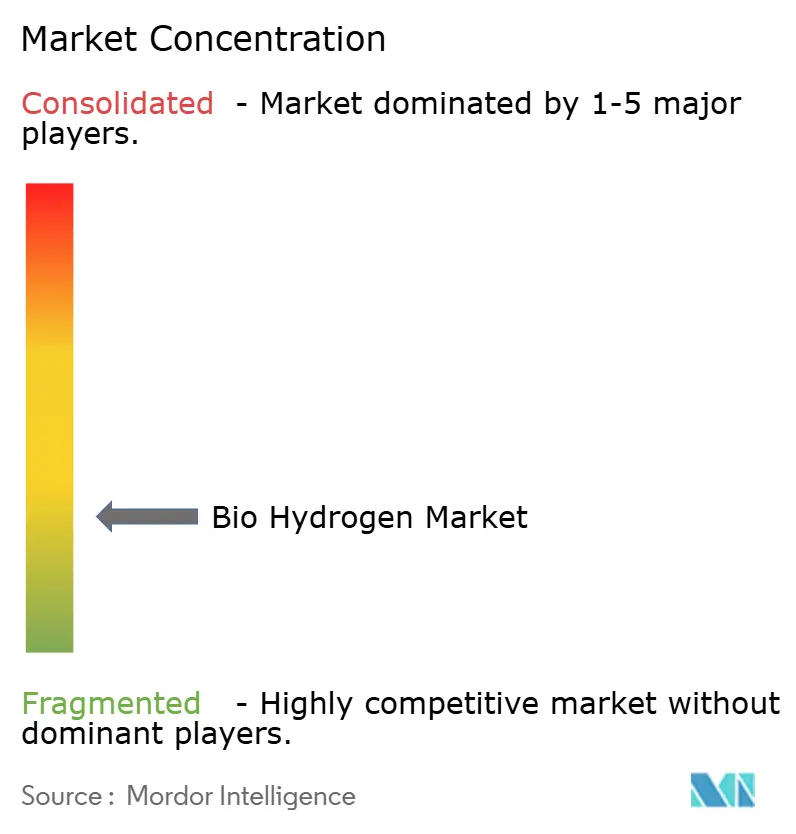
The biohydrogen market is fragmented, as no single company holds a dominant position across feedstock procurement and final hydrogen delivery. Industrial gas companies such as Air Liquide and Linde have downstream capabilities in distribution, purification, and compression, which can provide integration advantages for projects requiring certified delivery. However, major capital deployment by these companies remains more concentrated in electrolytic hydrogen. Air Liquide made a final investment decision in July 2025 to invest more than EUR 500 million (USD 582 million) in the 200 MW ELYgator electrolyzer at the Port of Rotterdam. This leaves room for specialist developers to advance distributed waste-to-hydrogen gasification and fermentation projects.
Energy utilities are pursuing projects that combine renewable hydrogen with biogenic carbon streams. In June 2026, ENGIE and European Energy entered into a cooperation agreement for a project in Denmark with up to 150 MW of electrolyzer capacity, with ENGIE reserving marketing rights for more than 20,000 tons of renewable hydrogen per year. In the same month, Shell licensed its XTL process to ENGIE for the KerEAUzen e-SAF project, which uses biogenic carbon dioxide and green hydrogen to produce sustainable aviation fuel. These developments indicate that biogenic carbon can be monetized in products that are not evaluated solely on a per-hydrogen-unit cost basis.
In July 2026, Messer acquired a 30% equity stake in four Lhyfe production sites in France and Germany under a 10-year renewable hydrogen supply contract. This agreement illustrates a model in which gas distributors take production equity rather than build every site themselves. Research activity in multi-stage dark fermentation and microbial electrolysis systems is concentrated among biotechnology groups in the European Union (EU), Japan, and China. Compliance with CertifHy, ISO 14687 hydrogen purity requirements, and the Renewable Energy Directive delegated acts can create barriers to entry, benefiting producers that establish certification and traceability systems early.
Bio Hydrogen Industry Leaders
-
Air Liquide
-
Linde PLC
-
Air Products and Chemicals, Inc.
-
Shell plc
-
Exxon Mobil Corporation
- *Disclaimer: Major Players sorted in no particular order
Bio Hydrogen Market Companies Covered in this Report
- Air Liquide
- Air Products and Chemicals, Inc.
- Ballard Power Systems
- Cummins Inc.
- Enapter AG
- ENGIE
- Exxon Mobil Corporation
- ITM Power plc
- Linde PLC
- McPhy Energy
- Nel ASA
- Plug Power Inc.
- Shell plc
- Siemens Energy
- Sunfire SE
Recent Industry Developments in Bio Hydrogen Market
- July 2026: Lhyfe and Messer signed a strategic industrial and financial partnership in which Messer acquired a 30% equity stake in four of Lhyfe's renewable hydrogen production sites in France and Germany, accompanied by a 10-year renewable hydrogen supply contract. The deal established one of Europe's long-term, large-scale renewable hydrogen distribution agreements and signals accelerating vertical integration in the European renewable hydrogen value chain.
- June 2026: ENGIE and European Energy entered a cooperation agreement for a large-scale renewable hydrogen project in Denmark with up to 150 MW of electrolyzer capacity, targeting commercial operation around 2030. ENGIE reserved marketing rights for more than 20,000 tons of renewable hydrogen per year.
Global Bio Hydrogen Market Report Scope
Bio hydrogen is a clean hydrogen gas produced from biological sources, such as organic waste, biomass, or water. Living microorganisms, including bacteria and microalgae, produce it without the use of fossil fuels. It serves as a renewable and clean energy alternative.
The bio hydrogen market is segmented by production technology, feedstock, application, and geography. By production technology, the market is segmented into biomass gasification, dark fermentation, photofermentation, and others. By feedstock, the market is segmented into agricultural residues, food and organic waste, wastewater and sewage sludge, and others. By application, the market is segmented into transportation fuel, power generation, industrial feedstock, and others. The report also covers market size and forecasts for bio hydrogen across 16 countries in major regions. The market sizes and forecasts are provided in terms of value (USD).
Segmentation Overview
| Biomass Gasification |
| Dark Fermentation |
| Photofermentation |
| Others |
| Agricultural Residues |
| Food and Organic Waste |
| Wastewater and Sewage Sludge |
| Others |
| Transportation Fuel |
| Power Generation |
| Industrial Feedstock |
| Others |
| Asia-Pacific | China |
| India | |
| Japan | |
| South Korea | |
| ASEAN Countries | |
| Rest of Asia-Pacific | |
| North America | United States |
| Canada | |
| Mexico | |
| Europe | Germany |
| United Kingdom | |
| France | |
| Italy | |
| NORDIC Countries | |
| Russia | |
| Rest of Europe | |
| South America | Brazil |
| Argentina | |
| Rest of South America | |
| Middle-East and Africa | Saudi Arabia |
| South Africa | |
| Rest of Middle-East and Africa |
| By Production Technology | Biomass Gasification | |
| Dark Fermentation | ||
| Photofermentation | ||
| Others | ||
| By Feedstock | Agricultural Residues | |
| Food and Organic Waste | ||
| Wastewater and Sewage Sludge | ||
| Others | ||
| By Application | Transportation Fuel | |
| Power Generation | ||
| Industrial Feedstock | ||
| Others | ||
| By Geography | Asia-Pacific | China |
| India | ||
| Japan | ||
| South Korea | ||
| ASEAN Countries | ||
| Rest of Asia-Pacific | ||
| North America | United States | |
| Canada | ||
| Mexico | ||
| Europe | Germany | |
| United Kingdom | ||
| France | ||
| Italy | ||
| NORDIC Countries | ||
| Russia | ||
| Rest of Europe | ||
| South America | Brazil | |
| Argentina | ||
| Rest of South America | ||
| Middle-East and Africa | Saudi Arabia | |
| South Africa | ||
| Rest of Middle-East and Africa | ||
Key Questions Answered in the Report
What is current market size of Bio Hydrogen Market?
The bio hydrogen market size was estimated at USD 81.34 million in 2025 and is estimated to grow from USD 86.34 million in 2026 to USD 120.25 million by 2031, at a CAGR of 6.85% during the forecast period (2026-2031).
Which production technology leads to bio hydrogen deployment?
Biomass gasification led with a 35.80% share in 2025 and recorded the highest projected CAGR of 7.35% through 2031.
Which feedstock has the strongest growth outlook?
Food and organic waste were projected to grow at a 7.52% CAGR through 2031, supported by avoided waste-tipping fees and hydrogen revenue.
What is the main application for bio hydrogen?
Transportation fuel held a 39.44% share in 2025, supported by fuel cell fleet deployment and decarbonization mandates.