Market Overview
| Study Period | 2019 - 2030 |
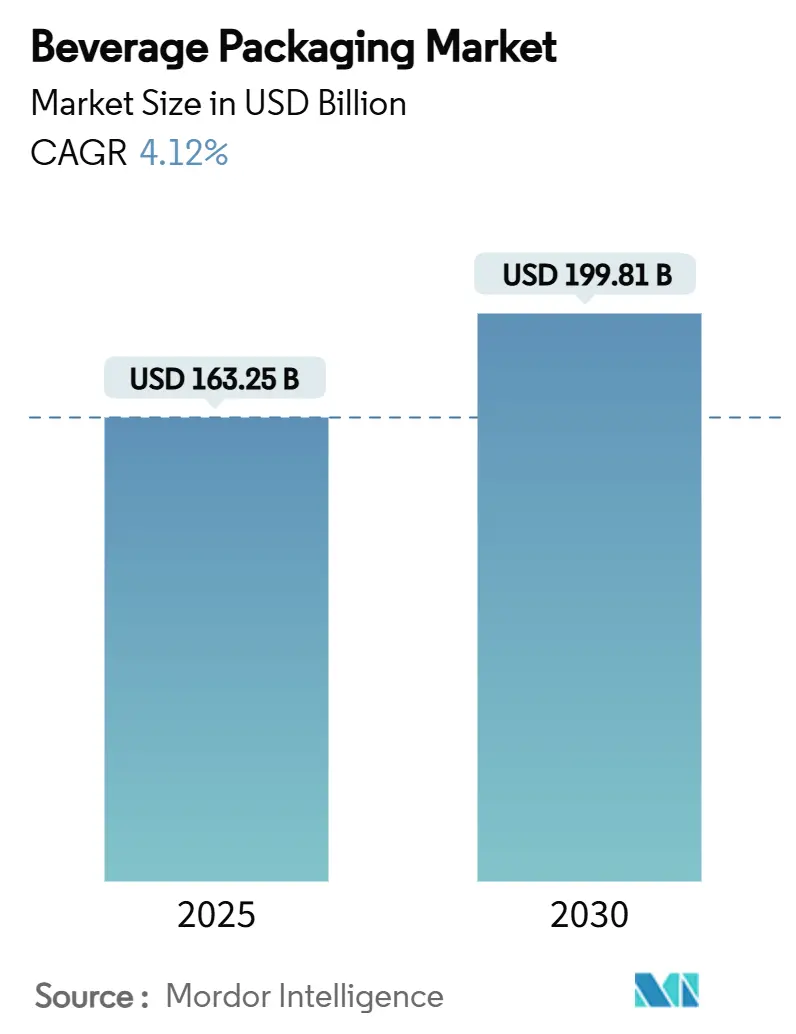
| Market Size (2025) | USD 163.25 Billion |
| Market Size (2030) | USD 199.81 Billion |
| Growth Rate (2025 - 2030) | 4.12% CAGR |
| Fastest Growing Market | Asia Pacific |
| Largest Market | North America |
| Market Concentration | Medium |
Major Players*Disclaimer: Major Players sorted in no particular order Image © Mordor Intelligence. Reuse requires attribution under CC BY 4.0. |
|
Beverage Packaging Market Analysis by Mordor Intelligence
The beverage packaging market was valued at USD 163.25 billion in 2025 and is forecast to expand at a 4.12% CAGR, reaching USD 199.81 billion by 2030. Growth is propelled by converging global regulations that standardize recycled-content thresholds, while premium ready-to-drink launches and a wave of aluminum-can capacity additions provide parallel demand engines. Packaging suppliers able to navigate recycled-material mandates, cost inflation for virgin resin, and shifting consumer preferences toward low-impact formats are capturing share. Strategic investments in closed-loop recycling, digital watermarking, and e-commerce-ready multipacks are differentiating leaders from laggards. Consolidation—exemplified by the pending Amcor-Berry Global merger—continues to reshape the competitive baseline, creating scale benefits for firms with multi-format portfolios.
Key Report Takeaways
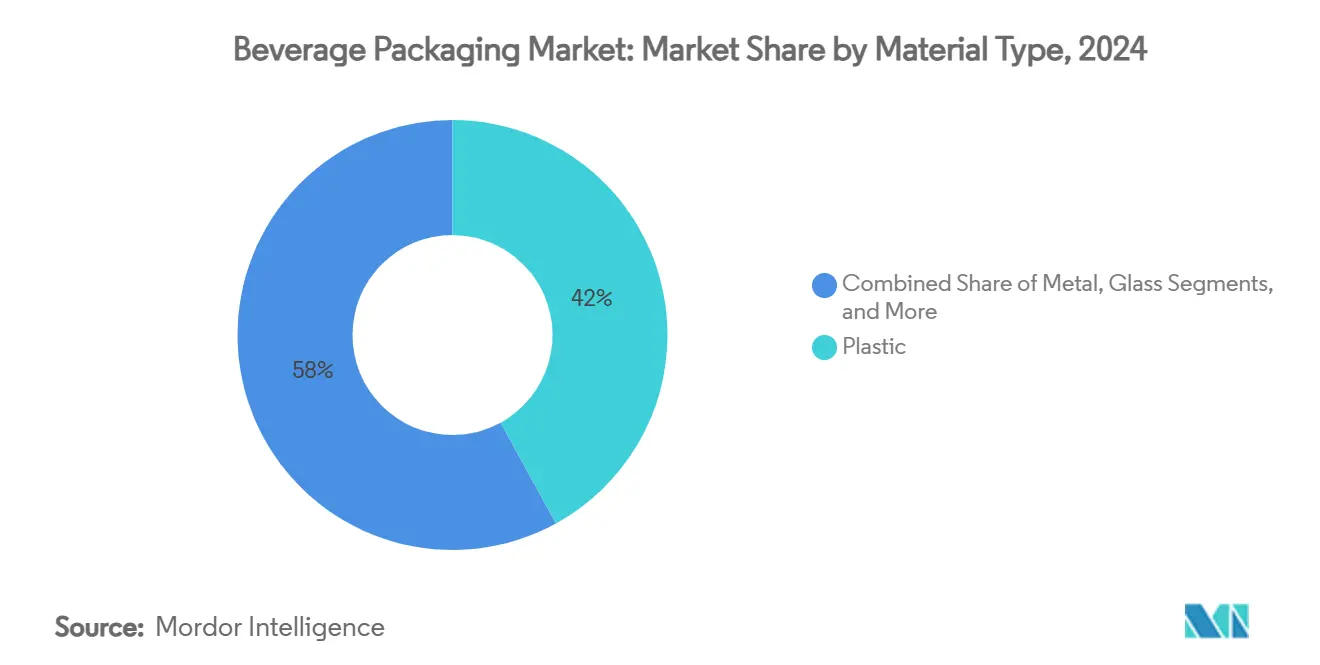
- By material type, plastic maintained 42% revenue share in 2024, while paperboard is projected to post a 6.65% CAGR through 2030.
- By product type, bottles led with 38% share in 2024; pouches are forecast to grow at a 7.23% CAGR to 2030.
- By packaging format, cold-fill/carbonated solutions contributed 40% of 2024 revenue; aseptic formats are expected to advance at a 7.36% CAGR through 2030.
- By beverage type, carbonated drinks held 31% of 2024 revenue, whereas plant-based drinks are on track for an 8.04% CAGR to 2030.
- By geography, North America commanded 27% of 2024 revenue; Asia-Pacific is projected to expand at a 5.61% CAGR to 2030.
Global Beverage Packaging Market Trends and Insights
Drivers Impact Analysis
| Driver | (~) % Impact on CAGR Forecast | Geographic Relevance | Impact Timeline |
|---|---|---|---|
| Premiumisation in ready-to-drink (RTD) beverages | +0.8% | Global, with concentration in North America & Europe | Medium term (2-4 years) |
| Surge in aluminium-can capacity expansions | +0.6% | Global, led by North America and Asia-Pacific | Short term (≤ 2 years) |
| PET lightweighting and tethered-cap regulations | +0.4% | Europe primary, spillover to North America and Asia-Pacific | Medium term (2-4 years) |
| Growth of e-commerce multipacks (mainly alcohol) | +0.3% | North America & Europe core, expanding to Asia-Pacific | Long term (≥ 4 years) |
| Rise of digital watermarks for circularity | +0.2% | Europe leading, North America following | Long term (≥ 4 years) |
| Beverage concentrates and "soda-at-home" ecosystems | +0.1% | North America primary, selective global adoption | Medium term (2-4 years) |
Source: Mordor Intelligence
Understand The Key Trends Shaping This Market
Download PDF
Premiumisation in Ready-to-Drink Beverages
Premium RTD launches are prompting brands to upgrade from commoditized plastics to glass and sleek aluminum, enabling higher shelf price points while still meeting recycled-content requirements. In the United Kingdom, a spirits sector worth GBP 16.8 billion (USD 21.2 billion) in 2024 recorded more than 50 new distilleries during 2023, and RTD spirits are projected to expand 16.2% per year to 2030.[1]Formes de Luxe, “What to Expect from the UK Spirits Market?” formesdeluxe.com Glass suppliers are capitalizing on premium cues, with 92% of US consumers associating glass with quality and infinite recyclability.[2]Beverage Industry, “Sustainability Drives Demand for Aluminum Packaging,” bevindustry.com Brand owners are pairing high-clarity containers with smart closures and QR-coded labels that unlock provenance data, loyalty rewards, and authenticated recycling instructions. The beverage packaging market benefits as premium SKUs carry higher packaging spend per liter, offsetting volume softness in mainstream carbonates.
Surge in Aluminium-Can Capacity Expansions
Aluminum’s infinite recyclability and closed-loop recovery rates above 70% have spurred a global capacity race. Ball Corporation added a Florida line and broke ground on an Oregon plant in 2024.[3]Ball Corporation, “Investor Newsroom,” ball.com Novelis is building a 600,000-tonne rolling mill in Alabama under long-term supply agreements with Ardagh to accommodate forecast 4% annual can-sheet demand growth through 2031. The beverage packaging market therefore sees integrated metal suppliers gaining cost leverage and sustainability messaging advantages, pressuring plastics in beer and sparkling water.
PET Lightweighting and Tethered-Cap Regulations
EU rules effective July 2024 require tethered closures on single-use PET bottles; converting to the GME 30.40 neck format removes 1.5 g of resin per bottle and saves 39,000 t of plastic annually. Brand owners racing to comply also capture logistics savings and cut Scope 3 emissions. EU PPWR targets of 25% rPET by 2025 and 30% by 2030 further accelerate adoption of chemical recycling and depolymerization start-ups. Origin Materials plans commercial deployment of tethered PET caps in Q4 2024, opening a new aftermarket for closure systems optimized for carbonation retention.
Growth of E-commerce Multipacks
Direct-to-consumer channels amplify demand for sturdy yet lightweight secondary packs that protect cans and glass during last-mile delivery. Converters are replacing shrink-film with molded-pulp carriers and corrugated designs containing 30% post-consumer fiber. Digital presses enable SKU-level artwork changes, supporting limited-edition drops that drive social-media engagement. These shifts reward paperboard mills and specialty pack printers inside the beverage packaging market, while penalizing flexible film suppliers tied to volatile resin costs.
Restraints Impact Analysis
| Restraint | (~) % Impact on CAGR Forecast | Geographic Relevance | Impact Timeline |
|---|---|---|---|
| Volatile virgin-resin prices | -0.7% | Global, with acute impact in Asia-Pacific and Europe | Short term (≤ 2 years) |
| Supply bottlenecks for recycled PET flakes | -0.5% | Europe and North America primary, expanding globally | Medium term (2-4 years) |
| Anti-single-use plastics policy acceleration | -0.3% | Australia, Europe leading, global expansion expected | Long term (≥ 4 years) |
| Investor ESG scrutiny curbing cap-ex in glass | -0.2% | Global, with concentration in developed markets | Medium term (2-4 years) |
Source: Mordor Intelligence
Volatile Virgin-Resin Prices
Crude oil swings and refinery outages pushed PTA and MEG costs higher in early 2025, forcing polyester bottle-chip producers in China and Europe to idle capacity to re-balance inventories. Packaging converters on spot resin contracts saw margin compression, encouraging forward contracts or integration into mechanical recycling. The beverage packaging market therefore tilts toward suppliers holding equity stakes in recycle-ready feedstock, shielding customers from volatility.
Supply Bottlenecks for Recycled PET Flakes
Europe generated 1.9 million t of rPET in 2022, sufficient for only 60% of targeted collection, and food-grade flake premiums reached 30% over virgin PET. India’s April 2025 mandate for 30% rPET in beverage bottles intensified global shortages; just five approved plants meet 15% of local demand. Producers with chemical recycling pilots and offtake agreements secure advantageous pricing, while traditional converters risk order backlogs.
Segment Analysis
By Material Type: Transition From Plastics to Renewable Substrates
Plastic retained 42% of 2024 revenue, underlining entrenched supply chains and cost advantages. Yet recycled-content directives and deposit-return expansion are challenging PET’s dominance. The beverage packaging market size for plastic is projected to advance only at the overall 4.12% CAGR, tempering its share despite ongoing lightweighting and chemical-recycling projects. Paperboard’s 6.65% CAGR—highest among materials—and metal’s comeback via aluminum cans illustrate regulatory pull and consumer push toward renewable or infinitely recyclable substrates. Graphic Packaging International’s launch of Boardio paperboard canisters and EnviroClip carriers targets carbonated soft drink multipacks once controlled by shrink-film. Integrated mills leverage domestic fiber supply and 75% recycling rates, cushioning them against virgin-resin volatility.
The beverage packaging industry is also witnessing glass repositioned as a prestige material notwithstanding higher logistics emissions. O-I Glass committed USD 150 million to modernize its Alloa, UK plant with hybrid furnaces and lightweight bottles, aiming for a 25% CO₂ cut by 2030. Aluminum enjoys a closed-loop rate above 70%, and Novelis’ forthcoming mill signals confidence in long-term demand. Collectively, these shifts suggest a diversified material mix by 2030, with plastics losing points of beverage packaging market share even as absolute tonnage rises in line with population growth.
Note: Segment shares of all individual segments available upon report purchase
By Product Type: Bottles Hold Court as Pouches Accelerate
Bottles accounted for 38% of 2024 revenue thanks to versatility across carbonates, water, dairy alternates, and alcohol. The beverage packaging market size attributed to bottles is projected to grow modestly at 3.7% to 2030 amid format diversification. Tethered-cap compliance and advanced barrier coatings (e.g., plasma or silicon oxide) are unlocking incremental weight savings. However, pouches are set to capture outsized gains via a 7.23% CAGR, reflecting 60-80% lower material weight per liter and suitability for e-commerce.
Multipack wine and cocktail pouches withstand drop tests, reduce shipping costs, and utilize mono-material laminates increasingly accepted in curbside programs. Cartons continue to service aseptic dairy, juice, and now plant-based lattes, propelled by Tetra Pak’s UHT filling lines with energy cuts of 25%. Cans sustain relevance through craft beer, energy drinks, and sparkling water, and their rapid chilling characteristics underpin brand loyalty. Beer kegs remain a niche at under 3% of volume, but stainless-steel re-use cycles of 25+ years align with zero-waste narratives.
By Packaging Format: Cold-Fill Dominance Meets Aseptic Innovation
Cold-fill and carbonated processes delivered 40% of 2024 revenue, benefiting from established PET bottling lines and low thermal stress that preserves flavor compounds. Nonetheless, retailer push for ambient-shelf offerings is steering investment toward aseptic technology projected to expand 7.36% annually. The beverage packaging market size associated with aseptic cartons and PET bottles will reach USD 48 billion by 2030 as developing economies prioritize shelf-stable nutrition solutions in areas with limited cold chains.
Hot-fill PET endures in acidic juices and teas but faces energy penalties versus aseptic. Retortable pouches win in functional broths and sports gels, though their market remains under 5% of beverage units. Shelf-stable ambient versus chilled distribution decisions increasingly hinge on retailers’ ESG metrics and electricity costs. Medium-term, a hybrid model is likely, with smart sensors monitoring temperature excursions and triggering dynamic inventory routing.

Note: Segment shares of all individual segments available upon report purchase
By Beverage Type: From Carbonates to Plant-Based Diversification
Carbonated soft drinks generated 31% of 2024 turnover and anchor high-volume PET and can demand, yet sugar taxes and wellness trends limit growth to below the beverage packaging market average. Reformulation into zero-sugar SKUs and functional additives partly offsets volume flatness in mature economies.
Plant-based drinks will post an 8.04% CAGR, quadrupling revenue share by 2030. Oat, almond, and pea beverages require oxygen barriers and light protection, driving adoption of multi-layer cartons and amber glass. The beverage packaging industry is adapting by standardizing cap liners for aseptic plant formulations and engineering adhesives compatible with fiber-based spouts. Bottled water remains stable amid microplastic scrutiny, driving opportunities for rPET and aluminum. Alcoholic ready-to-drink cocktails embrace slim cans and embossed glass to capture premium positioning. Energy drinks leverage tall sleek cans with matte finishes and peel-and-seal reclosable tabs, fostering incremental unit pricing.
Geography Analysis
North America captured 27% of 2024 revenue due to to high per-capita beverage intake and premiumization headroom. Crown Holdings registered 5% North American volume growth in 2024, boosted by new Virginia and Nevada can lines. Yet state-level legislation on tethered caps and expanded-producer-responsibility fees creates compliance complexity that favors diversified multinationals. Canada’s harmonized rPET targets to 2030 incent regional reclamation infrastructure, further bolstering circular-ready suppliers within the beverage packaging market. Competitive pressures arise from Asia-Pacific imports of lightweight bottles, challenging domestic converters on cost.
Asia-Pacific is forecast to post a 5.61% CAGR through 2030, underpinned by urbanization and rising disposable incomes. China recorded 2.7% output growth in beverages across the first ten months of 2023 while beer production jumped 22%. India’s rPET mandate at 30% from April 2025 introduces both demand for recycled feedstock and punitive taxes for non-compliance. Multinationals with in-house recycling (e.g., Coca-Cola’s PETValue facility in the Philippines) gain a foothold, whereas small converters face input scarcity. Japanese processors focus on “ready-to-eat” and healthy beverages, encouraging aseptic pouch uptake for portable nutrition.
Europe commands stringent regulatory leadership with the PPWR effective February 2025 mandating all packaging be recyclable by 2028 and 30% rPET in PET bottles by 2030. The beverage packaging market in the bloc therefore pivots toward design-for-recycling protocols such as monomaterial sleeves and water-based inks. Supply-demand imbalances in food-grade rPET keep premiums elevated, encouraging partnerships between fillers and recyclers. Glass capacity rationalization amid ESG constraints tightens supply for regional wine and premium spirits, supporting value retention. Flexible paper-based solutions gain traction as retailers commit to plastic reduction roadmaps across member states.

Competitive Landscape
The beverage packaging market exhibits moderate consolidation, with the top ten participants controlling roughly 55% of global revenue. Cross-material players such as Amcor, Ball, Crown, and Tetra Pak leverage scale, technology breadth, and long-standing relationships with brand owners. Material specialists including O-I Glass and Novelis defend niches via technical process leadership and closed-loop service models.
Strategic moves center on acquiring capabilities that accelerate circularity and geographic reach. Amcor’s all-stock merger with Berry Global, cleared in April 2025, unites 400 plants across 140 countries and promises USD 650 million in annual synergies, largely from resin procurement and footprint optimization. Sonoco’s USD 3.9 billion purchase of Eviosys positions the firm as the largest global metal food and aerosol can supplier, creating cross-selling opportunities into beverages. Ball’s 2024 purchase of European can maker Alucan expands its continental footprint amid rising demand for sustainable aluminum formats.
Innovation pipelines differentiate leaders. PepsiCo’s patent for ingredient-chamber cans points to customizable beverage systems that may displace post-mix fountains in esports arenas. Tetra Pak’s digital-engagement platform connects QR-coded cartons to consumer recycling guides and loyalty apps. Digital watermark pilots in partnership with Digimarc allow brand owners to track individual packs’ end-of-life destination, a credential increasingly valued by investors. Collectively, these moves tighten switching costs for beverage companies and raise the barrier to entry for newcomers lacking integrated material and data capabilities.
Beverage Packaging Industry Leaders
-
O-I Glass Inc.
-
Tetra Laval International SA
-
Ball Corporation
-
Ardagh Group S.A.
-
Amcor plc
- *Disclaimer: Major Players sorted in no particular order

Need More Details on Market Players and Competitors?
Download PDF
Recent Industry Developments
- April 2025: Amcor and Berry Global received European Commission approval for their USD 8.43 billion merger, unlocking scale in flexibles, closures, and specialty cartons and positioning the combined entity to negotiate rPET supply on favorable terms.
- February 2025: Crown Holdings reported 17% year-on-year growth in global beverage-can income, attributing margin uplift to its new Nevada and Virginia facilities that improve proximity to craft breweries.
- February 2025: The EU Packaging and Packaging Waste Regulation entered into force, setting a global compliance benchmark and prompting multinational fillers to accelerate design-for-recycling rollouts.
- January 2025: TricorBraun acquired Euroglas and Glaspack to deepen its presence in the DACH region, enabling localized supply of premium spirits bottles and reducing lead times for craft distillers.
Global Beverage Packaging Market Report Scope
Beverage manufacturers are focusing on offering a better product with easy-to-handle, eco-friendly packaging that keeps the product fresh for a long time. Packaging innovation is becoming a norm for beverage companies with smaller package sizes, situational package types, and multi-packs. Different kinds of products are packed using various materials depending on the beverages.
The beverage packaging market is segmented by material type (plastic, metal, glass, and paperboard), product type (bottles, cans, pouches, cartons, and beer kegs), application (carbonated drinks, alcoholic beverages, bottled water, milk, fruit and vegetable juices, energy drinks, plant-based drinks, and other applications), and geography. The market sizes and forecasts are provided in terms of value (USD) for all the above segments.
| By Material Type | Plastic | ||
| Metal | |||
| Glass | |||
| Paperboard | |||
| By Product Type | Bottles | ||
| Cans | |||
| Pouches | |||
| Cartons | |||
| Beer Kegs | |||
| By Packaging Format | Aseptic | ||
| Hot-Fill | |||
| Cold-Fill/Carbonated | |||
| Retortable | |||
| Shelf-Stable Ambient | |||
| Chilled Distribution | |||
| By Beverage Type | Carbonated Drinks | ||
| Alcoholic Beverages | |||
| Bottled Water | |||
| Milk | |||
| Fruit and Vegetable Juices | |||
| Energy Drinks | |||
| Plant-based Drinks | |||
| Other Beverage Types | |||
| By Geography | North America | United States | |
| Canada | |||
| Mexico | |||
| Europe | United Kingdom | ||
| Germany | |||
| France | |||
| Italy | |||
| Spain | |||
| Austria | |||
| Poland | |||
| Russia | |||
| Rest of Europe | |||
| Asia-Pacific | China | ||
| India | |||
| Japan | |||
| Australia | |||
| Rest of Asia-Pacific | |||
| South America | Brazil | ||
| Argentina | |||
| Rest of South America | |||
| Middle East | Saudi Arabia | ||
| United Arab Emirates | |||
| Turkey | |||
| Rest of Middle East | |||
| Africa | South Africa | ||
| Rest of Africa | |||
By Material Type
| Plastic |
| Metal |
| Glass |
| Paperboard |
By Product Type
| Bottles |
| Cans |
| Pouches |
| Cartons |
| Beer Kegs |
By Packaging Format
| Aseptic |
| Hot-Fill |
| Cold-Fill/Carbonated |
| Retortable |
| Shelf-Stable Ambient |
| Chilled Distribution |
By Beverage Type
| Carbonated Drinks |
| Alcoholic Beverages |
| Bottled Water |
| Milk |
| Fruit and Vegetable Juices |
| Energy Drinks |
| Plant-based Drinks |
| Other Beverage Types |
By Geography
| North America | United States |
| Canada | |
| Mexico | |
| Europe | United Kingdom |
| Germany | |
| France | |
| Italy | |
| Spain | |
| Austria | |
| Poland | |
| Russia | |
| Rest of Europe | |
| Asia-Pacific | China |
| India | |
| Japan | |
| Australia | |
| Rest of Asia-Pacific | |
| South America | Brazil |
| Argentina | |
| Rest of South America | |
| Middle East | Saudi Arabia |
| United Arab Emirates | |
| Turkey | |
| Rest of Middle East | |
| Africa | South Africa |
| Rest of Africa |
Need A Different Region or Segment?
Customize Now
Key Questions Answered in the Report
What is the current size of the beverage packaging market?
The beverage packaging market was valued at USD 163.25 billion in 2025 and is projected to reach USD 199.81 billion by 2030.
Which material segment is growing fastest?
Paperboard leads growth with a projected 6.65% CAGR through 2030 as brands shift toward renewable and easily recyclable substrates.
Why are aluminum cans gaining share?
Aluminum offers closed-loop recyclability rates above 70% and benefits from large capacity additions by Ball and Novelis, making it a favored alternative to single-use plastics.
How will EU regulations affect global packaging choices?
The EU PPWR requires all packaging to be recyclable by 2028 and sets rPET content thresholds, influencing global brand specifications and accelerating design-for-recycling adoption.
Which region is expected to deliver the highest growth?
Asia-Pacific is forecast to expand at a 5.61% CAGR to 2030, supported by urbanization, rising incomes, and aggressive sustainability mandates such as India’s 30% rPET requirement.
What strategic moves dominate the competitive landscape?
Mergers like Amcor-Berry and Sonoco-Eviosys, alongside capacity investments in aluminum and glass decarbonization, illustrate a pivot toward scale, circularity, and premiumization.
Page last updated on: July 8, 2025

