
AR Marketing Services Market Size and Share
Market Overview
| Study Period | 2020 - 2031 |
|---|---|
| Market Size (2026) | USD 6.31 Billion |
| Market Size (2031) | USD 12.95 Billion |
| Growth Rate (2026 - 2031) | 15.49 % |
| Fastest Growing Market | Asia-Pacific |
| Largest Market | North America |
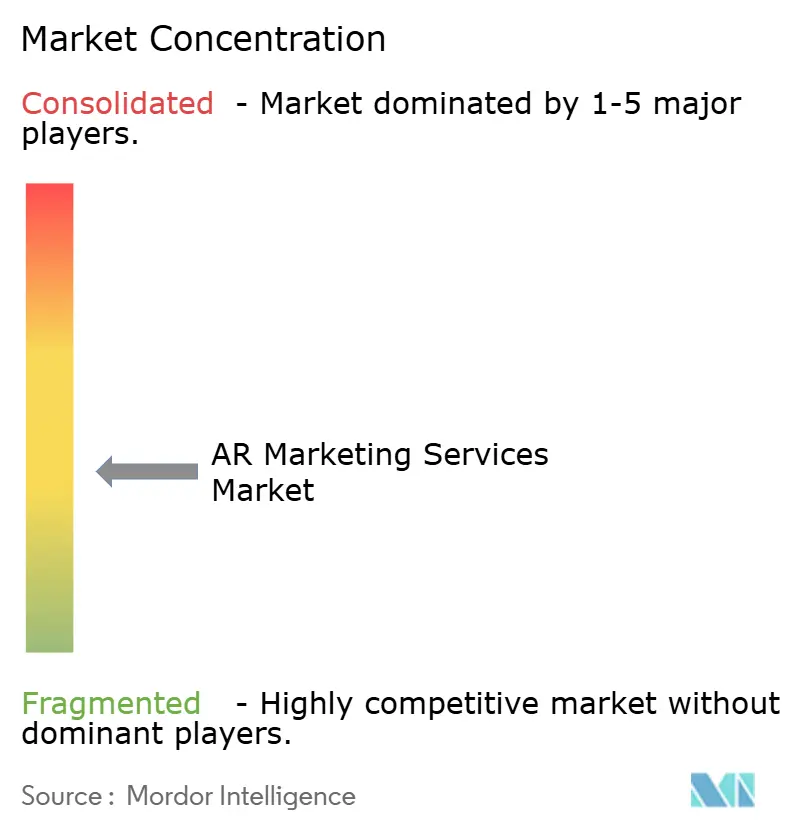
| Market Concentration | Medium |
Major Players *Disclaimer: Major Players sorted in no particular order Image © Mordor Intelligence. Reuse requires attribution under CC BY 4.0. | |
AR Marketing Services Market Analysis by Mordor Intelligence
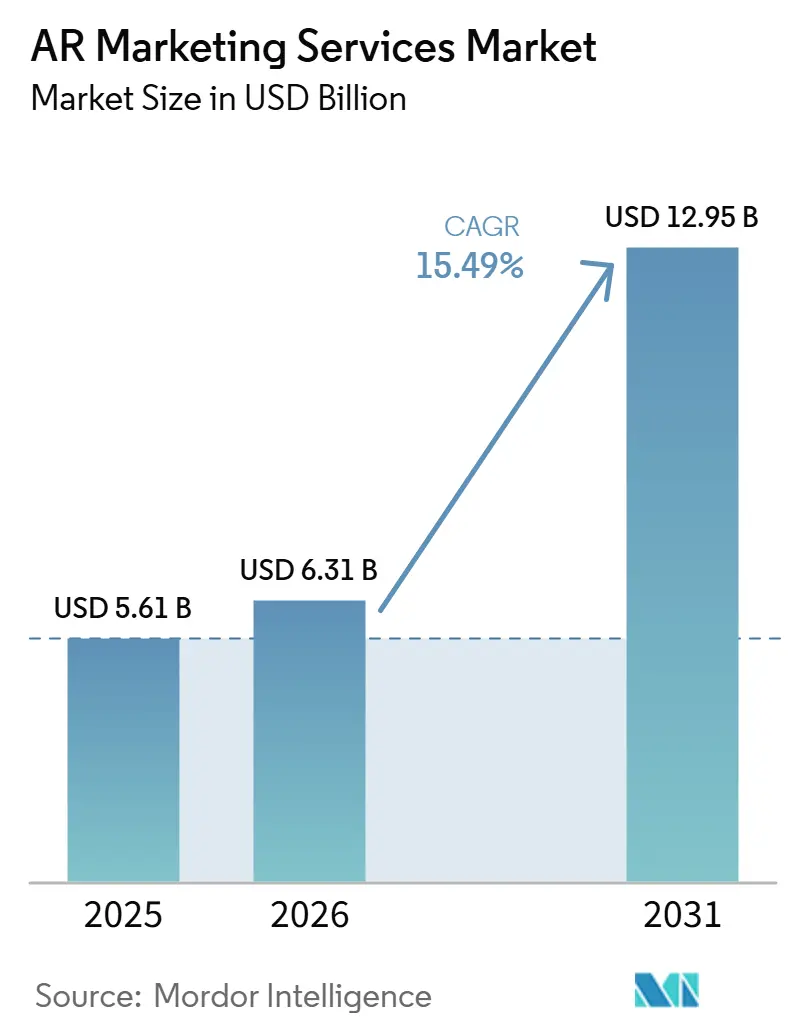
The AR marketing services market size is expected to increase from USD 5.61 billion in 2025 to USD 6.31 billion in 2026 and reach USD 12.95 billion by 2031, growing at a CAGR of 15.49% over 2026-2031. Mobile augmented reality use and compatible smartphone hardware are expanding the audience available to brands. Generative AI is reducing the time and cost required to create 3D campaign assets. Retailers and consumer-goods companies are directing more marketing spending toward interactive commerce formats that can be measured. Platform consolidation has increased the value of providers that can deploy campaigns across social platforms, websites, packaging, and other physical touchpoints.
Key Report Takeaways
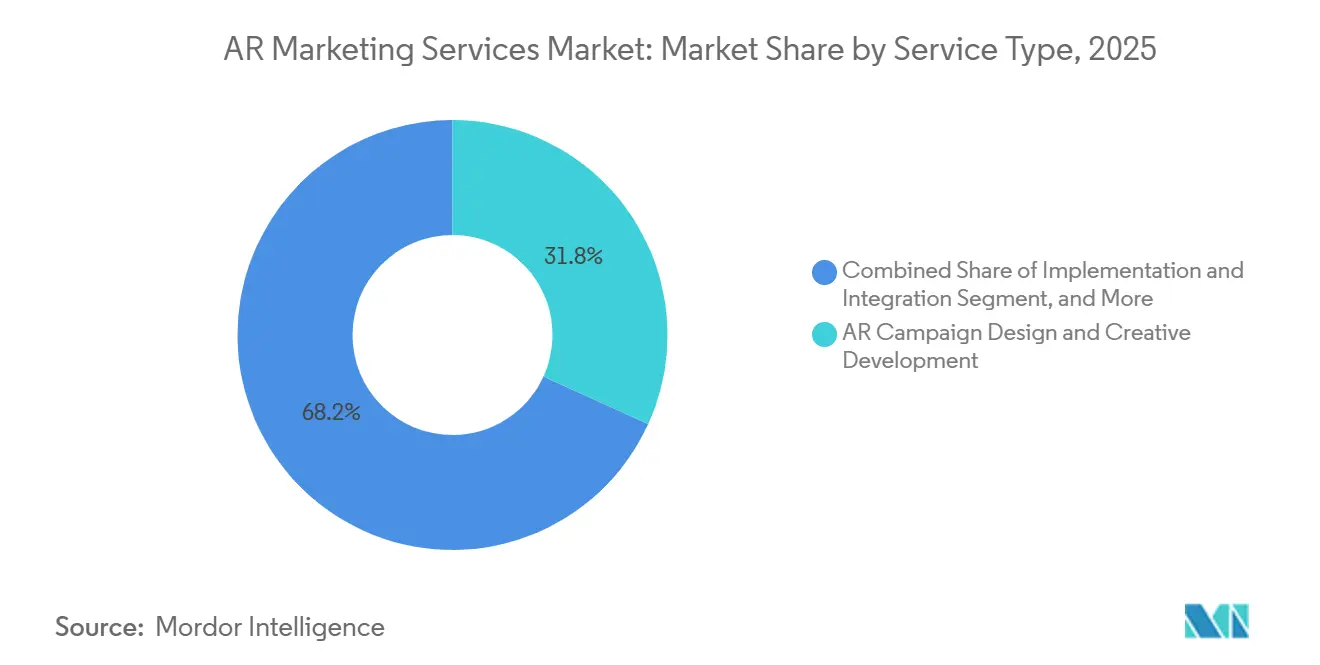
- By service type, AR Campaign Design and Creative Development held 31.80% of the AR marketing services market share in 2025, while Virtual Try-on and Product Visualization Services is projected to expand at a 15.78% CAGR through 2031.
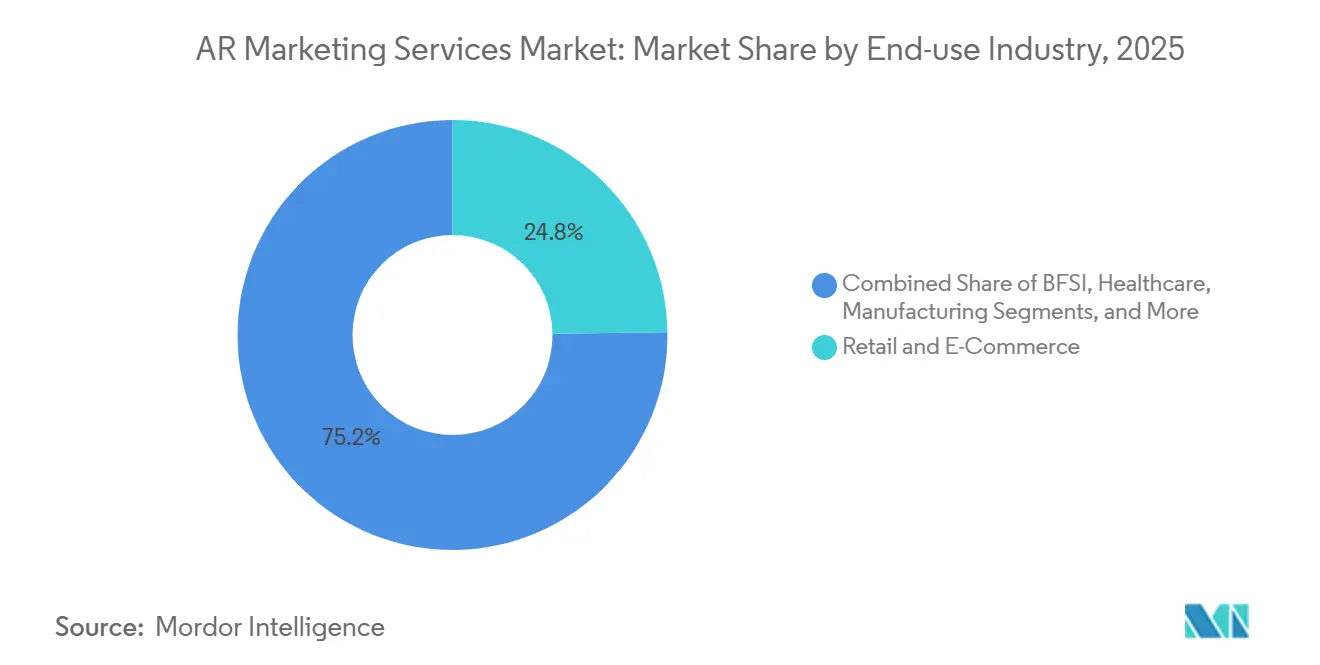
- By end-use industry, Retail and E-Commerce accounted for 24.80% of the AR marketing services market size in 2025, while Healthcare and Life Sciences is expected to advance at a 16.34% CAGR through 2031.
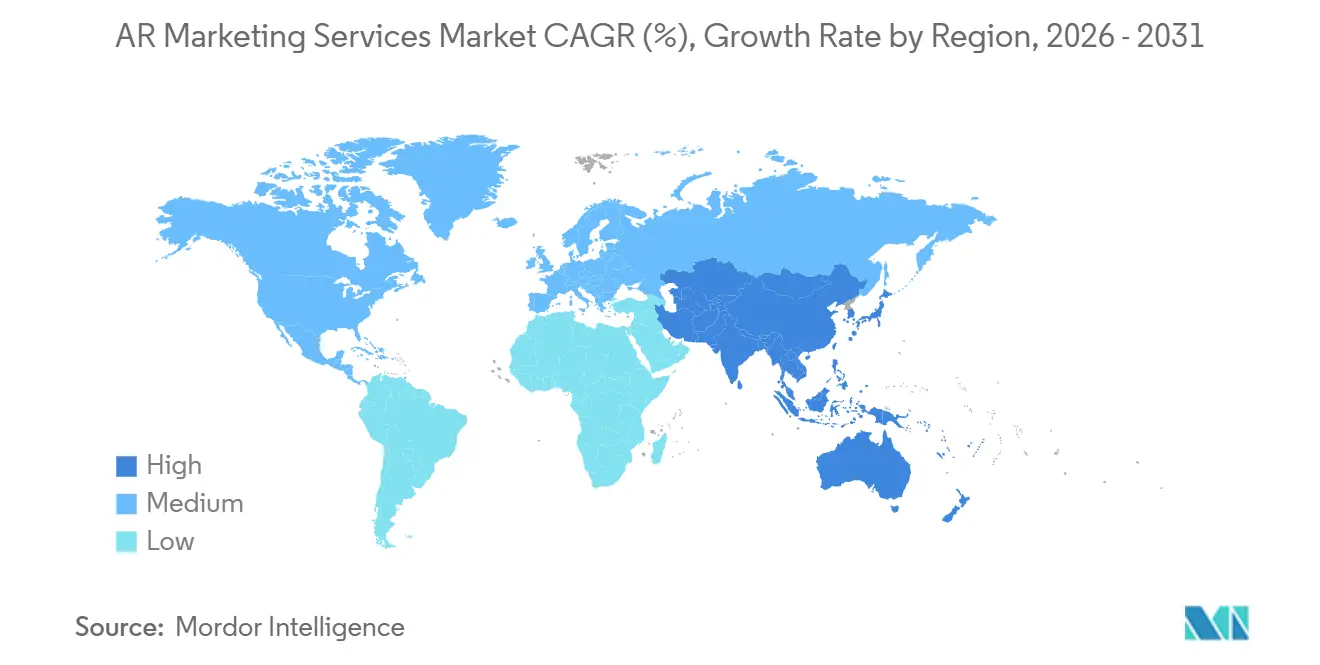
- By geography, North America held 39.80% of the AR marketing services market share in 2025, while Asia-Pacific is forecast to expand at a 16.11% CAGR through 2031.
Note: Market size and forecast figures in this report are generated using Mordor Intelligence’s proprietary estimation framework, updated with the latest available data and insights as of January 2026.
Market Trends and Insights
Drivers Impact Analysis of AR Marketing Services Market*
| Driver | (~) % Impact on CAGR Forecast | Geographic Relevance | Impact Timeline |
|---|---|---|---|
| Rising Mobile AR Reach and Smartphone Capability | +3.5% | Global, with concentrated lift in North America, Europe, and Asia-Pacific core | Short term (≤ 2 years) |
| Measured Conversion Lift From Virtual Try-On and 3D Commerce Media | +3.0% | North America and Europe, with spillover to Asia-Pacific and the Middle East | Short term (≤ 2 years) |
| Social Platforms Scaling Branded Effects and Shoppable AR Formats | +2.5% | Global, strongest in North America, East Asia, and Southeast Asia | Short term (≤ 2 years) |
| Retailers and Brand Owners Expanding Experiential Commerce Budgets | +2.0% | North America and Western Europe, with emerging demand in Asia-Pacific and the Middle East | Medium term (2-4 years) |
| App-Less WebAR Turning Packaging, Out-of-Home, and Broadcast Media Into Interactive Funnels | +1.5% | Global, with early gains in Brazil, India, and Southeast Asia | Medium term (2-4 years) |
| Generative AI Shrinking 3D Asset Production Time and Campaign Iteration Costs | +1.2% | Global, with adoption led by North America and Western Europe | Long term (≥ 4 years) |
| Source: Mordor Intelligence | |||
Rising Mobile AR Reach and Smartphone Capability
Mobile AR users reached 1.067 billion in 2025 and were forecast to reach 1.106 billion in 2026. ARKit and ARCore are available on a wide base of consumer smartphones, reducing the device-level barrier that previously limited AR campaign distribution.[1] Snap stated that a large base of Snapchat users engaged with AR daily, while a broad developer community had created an extensive range of Lenses. Newer smartphone chips support real-time body and object tracking through on-device neural processing. This lowers rendering demands per impression and supports the use of persistent AR commerce placements rather than isolated tests. AR marketing services market providers can therefore manage ongoing lens libraries, reporting, and creative updates for brands.
Measured Conversion Lift From Virtual Try-On and 3D Commerce Media
Virtual try-on provides a clearer commercial case when it improves shopping engagement and reduces product returns. The original draft reported stronger add-to-cart activity for sessions with a try-on feature than for sessions without one. It also reported that digital fitting tools reduced returns across apparel brands. The same material noted stronger engagement among luxury shoppers who used virtual try-on tools. These results are moving specialized providers toward high-fidelity programs for premium brands. The AR marketing services market can benefit when these projects increase the value of creative and technical assignments.
Social Platforms Scaling Branded Effects and Shoppable AR Formats
Snap reported that AR Lens submissions increased significantly year over year in a recent quarter. The company also reported higher click-through rates for sponsored Snaps and increased conversion volume during the quarter. Google has positioned Lens as a shopping discovery platform and expanded Shopping Ads into Lens results. Snap Lens Studio and TikTok Effect House continue to compete for branded content volume and developer participation. These tools can lower production barriers while increasing the supply of paid AR placements. Providers with developer relationships across multiple platforms are better positioned to secure budgets targeting reach across more than one channel.
Retailers and Brand Owners Expanding Experiential Commerce Budgets
Global experiential marketing spending reached a significant level in 2025 and was expected to continue increasing in 2026, according to the supplied material. Retailers and consumer-goods brands are using interactive formats to connect physical touchpoints with measurable digital activity. AR can link store visits, packaging scans, and out-of-home placements with trackable product exploration. This helps brand teams pursue engagement goals while giving finance teams clearer measures of activity. Large seasonal budgets also encourage brands to secure AR production capacity earlier in the year. Retainer-based creative and campaign management services may help providers reduce the seasonality of project revenue.
Restraints Impact Analysis of AR Marketing Services Market*
| Restraint | (~) % Impact on CAGR Forecast | Geographic Relevance | Impact Timeline |
|---|---|---|---|
| High Creative Production and Cross-Platform Deployment Costs | -1.5% | Global, most acute in South America, the Middle East, and Africa where campaign budgets are smaller | Medium term (2-4 years) |
| Biometric Data, Consent, and Privacy Compliance Complexity | -1.2% | North America and Europe, with spillover to Asia-Pacific through national frameworks | Medium term (2-4 years) |
| Meta Spark Shutdown Reducing Instagram and Facebook Third-Party AR Inventory | -0.8% | Global, with concentrated impact where Instagram is the main social commerce surface | Short term (≤ 2 years) |
| Browser and Measurement Fragmentation Depressing Scalable Media Buying Confidence | -0.6% | Global, particularly for programmatic buyers in North America and Europe | Long term (≥ 4 years) |
| Source: Mordor Intelligence | |||
High Creative Production and Cross-Platform Deployment Costs
Full-fidelity three-dimensional work still requires modeling, rendering optimization, and testing across iOS, Android, and web environments. The original draft indicated that the cost of an AR creative execution can vary significantly depending on its scope and complexity. This cost can exclude small and mid-sized advertisers from sophisticated programs. NVIDIA described examples in which AI and 3D workflows reduced asset-production time and costs for global brands.[2] These efficiencies are most available to companies with structured product catalogs and established 3D asset libraries. Separate optimization requirements for Lens Studio, Effect House, and WebAR can still multiply costs for campaigns that need cross-platform delivery.
Biometric Data, Consent, and Privacy Compliance Complexity
Virtual try-on and face-based AR can process face geometry, creating obligations under biometric and privacy rules. The supplied material highlighted Illinois BIPA, GDPR Article 9, and an expanding set of U.S. state privacy laws. The Seventh Circuit revived a BIPA class action related to Amazon’s virtual try-on feature in 2025. This case indicates that consent, retention controls, and disclosure procedures affect the design of AR services. Meta’s January 2025 decision to end third-party branded AR effects also removed a major distribution layer from Facebook and Instagram.[3] Providers that support on-device processing and clear data controls can be better positioned in procurement reviews.
*Our forecasts treat driver/restraint impacts as directional, not additive. The impact forecasts reflect baseline growth, mix effects, and variable interactions.
AR Marketing Services Market Segment Analysis
By Service Type:
Creative Production Anchors Budgets and Try-On Accelerates AdoptionAR Campaign Design and Creative Development held 31.80% of the AR marketing services market size in 2025. The service includes 3D asset creation, filter and lens design, and interactive overlay programming. It remains central because brands may purchase strategic advice periodically but need creative materials on a continuing basis. The segment connects directly with social lens programs, WebAR packaging activations, and other campaign formats. Virtual Try-on and Product Visualization Services is forecast to expand at a CAGR of 15.78% from 2026 to 2031. The segment’s progression reflects the conversion and return-management case described for retail programs.
Social AR Filters and Lens Development has a mature role but are becoming more important as a shoppable commerce channel. Snap’s developer base gives brands access to a broad supply of commissioned lens work. Campaign Management and Analytics is advancing as agencies incorporate lens engagement, dwell time, and try-on-to-purchase measures into media plans. AR Strategy and Consulting remains smaller but can carry higher margins at the planning stage of larger deployments. Other services include spatial audio, AR cloud hosting, and mixed-reality production. These services are attracting attention from entertainment and live-event clients seeking persistent experiences in physical venues.

By End-Use Industry:
Retail Commands Scale and Healthcare Leads PaceRetail and E-Commerce accounted for 24.80% of the AR marketing services market share in 2025. Virtual try-on, 3D product visualization, and shoppable social AR provide this segment with an identifiable return on investment case. Beauty and cosmetics brands were early adopters of try-on functions. Apparel and footwear adoption followed as body-tracking systems improved. Furniture and home-goods companies are using visualization to help customers evaluate products before purchase. Healthcare and Life Sciences are expected to advance at a CAGR of 16.34% between 2026 and 2031.
Healthcare demand has 2 main forms: digital detailing for healthcare professionals and AR-enabled education for patients. Pharmaceutical teams can use WebAR for 3D mechanism-of-action visualizations and interactive product catalogs. Medical-device and consumer health brands can apply similar formats to education and compliance activities. Automotive, travel, real estate, media, gaming, BFSI, telecommunications, technology, and education also contribute to demand. Automotive brands use AR to help customers visualize configurations at home, while property firms use it for walkthroughs and project visualization. The AR marketing services industry also serves experiential programs in hospitality, gaming, and consumer communications.
Geography Analysis
North America AR Marketing Services Market
North America held 39.80% of the AR marketing services market size in 2025. The region has a large concentration of AR-focused social platforms, advanced brand marketing teams, and specialized agencies. The United States represented 46% of global experiential marketing spending in 2025 in the supplied research. This spending base supports the use of immersive campaign formats among major advertisers. Canada and Mexico contribute through multinational deployments, although they remain followers rather than leaders in AR campaign innovation.
APAC AR Marketing Services Market
Asia-Pacific is projected to advance at a CAGR of 16.11% from 2026 to 2031. China uses AR within super-app commerce environments, including WeChat mini-programs and Taobao Live. These settings combine try-on and 3D visualization with local commerce workflows. India’s mobile-first consumer base and developing advertising ecosystem support the regional opportunity. South Korea’s connectivity and beauty-focused consumer culture support demand for social AR lens campaigns.
EMEA and South America AR Marketing Services Market
Europe is the second-largest regional contributor to the AR marketing services market. Germany, the United Kingdom, and France combine retail digitization with demand for GDPR-conscious on-device AR design. South America is emerging, with Brazil using AR as an alternative to costly physical retail activations. The Middle East is led by Saudi Arabia and the UAE, where brand modernization supports high-production AR out-of-home programs. Africa remains at an earlier stage, with South Africa, Egypt, and Nigeria serving as key points of adoption. Telecommunications and consumer-goods applications are among the principal sources of demand in these countries.
Competitive Landscape
The AR marketing services market is fragmented in service delivery but more concentrated at the platform level. Snap, Google, and Meta control leading distribution surfaces and continue to expand their first-party AR commerce tools. Snap entered a multiyear agreement with Qualcomm Technologies to support future Specs products with Snapdragon systems-on-chip. The agreement indicates that Snap intends to extend AR experiences from smartphones into wearable devices. Meta’s withdrawal of third-party-branded AR effects increased the importance of alternative social and web-based delivery channels. The AR marketing services market, therefore, favors firms that can serve multiple platforms without relying on one distribution owner.
Specialist agencies and WebAR platforms can provide consistent work across Snap, TikTok, websites, and packaging. Infinite Reality acquired Zappar, bringing Zappar’s WebAR platform, no-code 3D tools, and brand relationships into its wider offering. Niantic Spatial became an independent company with substantial capital and retained a large repository of geolocated images from its gaming history. Its visual positioning capabilities can support location-specific brand programs. These moves show that infrastructure, platform reach, and cross-channel execution remain important competitive assets.
The supplied research identified measurement for mid-market brands as an important opening. Brands with modest AR budgets may lack standardized attribution tools that work across platforms. Providers that make multi-platform measurement more accessible can compete with agencies that offer analytics as bespoke consulting work. Healthcare execution is another opening because pharmaceutical clients need accurate educational and detailing materials. This requirement can create a barrier for generalist creative agencies.
AR Marketing Services Industry Leaders
-
Snap Inc.
-
Google LLC
-
Meta Platforms, Inc.
-
Perfect Corp.
-
Niantic, Inc.
- *Disclaimer: Major Players sorted in no particular order
AR Marketing Services Market Companies Covered in this Report
- Snap Inc.
- Google LLC
- Meta Platforms, Inc.
- Niantic, Inc.
- Perfect Corp.
- Zappar Ltd.
- Banuba Limited
- Aryel S.r.l.
- Groove Jones, LLC
- Rock Paper Reality
- PLAYAR
- INDE
- YORD Studio
- CamOn
- MVP Interactive
- Worldwide XR
- TouchTry
- Fibbl
Recent Industry Developments in AR Marketing Services Market
- July 2026: Perfect Corp. entered a definitive going-private merger agreement at USD 2.00 per share, in a deal led by founder Alice H. Chang, removing the company from public markets and concentrating IP control over its AI/AR virtual try-on platform serving beauty, fashion, and jewelry brands globally.
- June 2026: Snap unveiled its consumer Specs AR glasses at the Augmented World Expo, priced at USD 2,195, powered by Qualcomm Snapdragon systems-on-chips under a multiyear agreement, and supported by a developer ecosystem that recorded a 28% year-over-year increase in Lens submissions for the Specs platform.
- June 2026: Google announced intelligent eyewear partnerships with Samsung, Gentle Monster, and Warby Parker at Google I/O 2026, introducing audio-first glasses with Gemini-powered assistance launching in fall 2026 and display glasses following, creating a new ambient AR advertising surface adjacent to Search and Lens.
- April 2026: WPP expanded its collaboration with Google by integrating Google Earth AI into WPP Open, enabling location-aware, AI-driven immersive marketing experiences for brands.
Global AR Marketing Services Market Report Scope
AR Marketing Services Market refers to agencies, technology providers, and specialist firms that design, develop, deploy, and manage augmented reality experiences for marketing and advertising campaigns. These services overlay digital content such as 3D models, animations, information, and interactive effects onto real-world environments through smartphones, tablets, wearables, or AR glasses.
The AR Marketing Services Market Report is Segmented by Service Type (Campaign Design, Virtual Try-on, Social AR Filters, Analytics, AR Strategy, and Other Service Types), End-use Industry (Retail, Automotive, Media/Gaming, Travel, Real Estate, Healthcare, Education, BFSI, Telecom, and Other End-use Industries), and Geography (North America, South America, Europe, Asia-Pacific, Middle East, and Africa). The Market Forecasts are Provided in Terms of Value (USD).
Segmentation Overview
| AR Strategy and Consulting |
| AR Campaign Design and Creative Development |
| Social AR Filters and Lens Development |
| Virtual Try-on and Product Visualization Services |
| Campaign Management and Analytics |
| Other Service Types |
| Retail and E-Commerce |
| Automotive |
| Media, Entertainment and Gaming |
| Travel, Tourism and Hospitality |
| Real Estate and Construction |
| Healthcare and Life Sciences |
| Education and Training Services |
| BFSI |
| Telecommunications and Technology |
| Other End-use Industries |
| North America | United States |
| Canada | |
| Mexico | |
| South America | Brazil |
| Argentina | |
| Rest of South America | |
| Europe | Germany |
| United Kingdom | |
| France | |
| Italy | |
| Spain | |
| Russia | |
| Rest of Europe | |
| Asia-Pacific | China |
| Japan | |
| India | |
| South Korea | |
| Australia and New Zealand | |
| Rest of Asia-Pacific | |
| Middle East | Saudi Arabia |
| United Arab Emirates | |
| Turkey | |
| Rest of Middle East | |
| Africa | South Africa |
| Egypt | |
| Nigeria | |
| Rest of Africa |
| By Service Type | AR Strategy and Consulting | |
| AR Campaign Design and Creative Development | ||
| Social AR Filters and Lens Development | ||
| Virtual Try-on and Product Visualization Services | ||
| Campaign Management and Analytics | ||
| Other Service Types | ||
| By End-use Industry | Retail and E-Commerce | |
| Automotive | ||
| Media, Entertainment and Gaming | ||
| Travel, Tourism and Hospitality | ||
| Real Estate and Construction | ||
| Healthcare and Life Sciences | ||
| Education and Training Services | ||
| BFSI | ||
| Telecommunications and Technology | ||
| Other End-use Industries | ||
| By Geography | North America | United States |
| Canada | ||
| Mexico | ||
| South America | Brazil | |
| Argentina | ||
| Rest of South America | ||
| Europe | Germany | |
| United Kingdom | ||
| France | ||
| Italy | ||
| Spain | ||
| Russia | ||
| Rest of Europe | ||
| Asia-Pacific | China | |
| Japan | ||
| India | ||
| South Korea | ||
| Australia and New Zealand | ||
| Rest of Asia-Pacific | ||
| Middle East | Saudi Arabia | |
| United Arab Emirates | ||
| Turkey | ||
| Rest of Middle East | ||
| Africa | South Africa | |
| Egypt | ||
| Nigeria | ||
| Rest of Africa | ||
Key Questions Answered in the Report
What is the size of the AR marketing services market?
It was valued at USD 5.60 billion in 2025 and is forecast to reach USD 12.95 billion by 2031 at a 15.49% CAGR.
Which service type leads AR marketing services?
AR Campaign Design and Creative Development led with a 31.80% share in 2025.
Which end-use sector has the largest demand for AR marketing services?
Retail and E-Commerce held a 24.80% share in 2025, supported by virtual try-on, 3D visualization, and shoppable social formats.
Which end-use sector is expected to expand fastest?
Healthcare and Life Sciences is projected to advance at a 16.34% CAGR between 2026 and 2031.
Which region leads AR marketing service demand?
North America held 39.80% of demand in 2025, supported by established social platforms and advanced brand marketing capabilities.
Why do brands use virtual try-on tools?
They can support product discovery, conversion, return management, and interactive customer engagement in retail programs.