
Residential Routers Market Size and Share
Market Overview
| Study Period | 2020 - 2031 |
|---|---|
| Market Size (2026) | USD 14.58 Billion |
| Market Size (2031) | USD 22.62 Billion |
| Growth Rate (2026 - 2031) | 9.18% CAGR |
| Fastest Growing Market | Asia-Pacific |
| Largest Market | North America |
| Market Concentration | Medium |
Major Players *Disclaimer: Major Players sorted in no particular order Image © Mordor Intelligence. Reuse requires attribution under CC BY 4.0. | |
Residential Routers Market Analysis by Mordor Intelligence
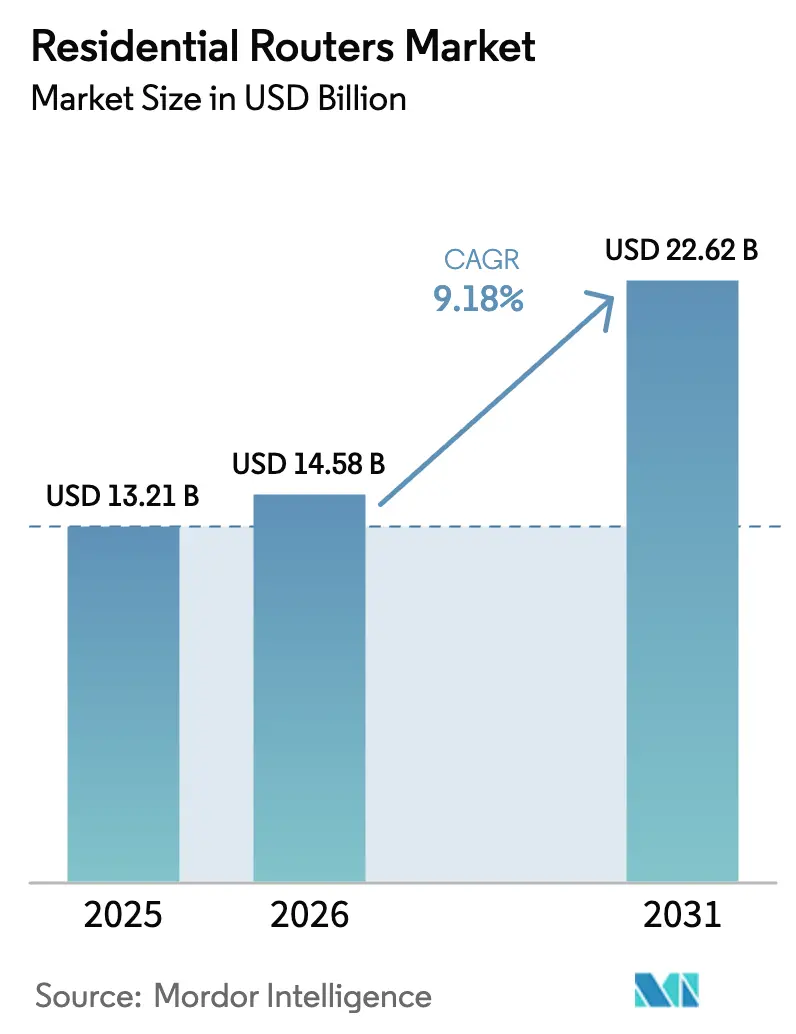
The residential routers market size was valued at USD 13.21 billion in 2025, USD 14.58 billion in 2026, and is projected to attain USD 22.62 billion by 2031, translating into a 9.18% CAGR during the 2026-2031 period. Growing household demand for multi-gig connectivity, ISP fiber roll-outs that bundle Wi-Fi 7 gateways, and the steady replacement of Wi-Fi 5 hardware underpin this upward trajectory. Wireless connectivity continues to absorb spending because tri-band routers help alleviate congestion caused by remote work, multi-stream entertainment, and smart-home devices. ISPs monetize the shift by embedding AI-driven optimization and cybersecurity services in subscription bundles, a model that redirects value from retail shelf space to managed Wi-Fi fees. Competitive advantage is increasingly hinging on chipset allocation agreements and cloud-based network-management platforms, rather than cosmetic hardware upgrades. Energy-efficiency mandates in the European Union and North America further accelerate refresh cycles by setting power-consumption ceilings that legacy routers cannot meet.
Key Report Takeaways
- By connectivity type, wireless commanded 78.46% residential routers market share in 2025, while the same segment is forecast to grow at a 10.17% CAGR through 2031.
- By Wi-Fi standard generation, Wi-Fi 6 and 6E led with 47.82% share in 2025; Wi-Fi 7 is projected to expand at a 10.88% CAGR through 2031.
- By product form factor, mesh Wi-Fi systems accounted for 45.65% of the residential routers market size in 2025 and are advancing at a 9.46% CAGR through 2031.
- By distribution channel, ISP-bundled and leased gateways held 61.37% of 2025 revenue; the channel is expected to post a 9.79% CAGR through 2031.
- By end-user household type, single-family homes captured 55.43% share in 2025, while multi-dwelling units are growing the fastest at a 10.02% CAGR through 2031.
- By geography, North America led with 41.58% share in 2025, whereas Asia-Pacific is projected to grow at a 10.62% CAGR through 2031.
Note: Market size and forecast figures in this report are generated using Mordor Intelligence’s proprietary estimation framework, updated with the latest available data and insights as of January 2026.
Global Residential Routers Market Trends and Insights
Drivers Impact Analysis*
| Driver | (~)% Impact on CAGR Forecast | Geographic Relevance | Impact Timeline |
|---|---|---|---|
| Proliferation of smart-home and IoT devices | +2.1% | Global, with concentration in North America and Europe | Medium term (2-4 years) |
| Surging global IP traffic and high-speed broadband uptake | +2.4% | Global, led by Asia-Pacific fiber deployments | Long term (≥ 4 years) |
| Migration to Wi-Fi 6/6E/7 standards fueling replacement cycles | +1.8% | North America and Europe early adopters, Asia-Pacific volume growth | Short term (≤ 2 years) |
| ISP fiber roll-outs bundling Wi-Fi 7 gateways at scale | +1.6% | North America and Europe mature markets, Asia-Pacific emerging | Medium term (2-4 years) |
| AI-driven managed-Wi-Fi subscriptions boosting premium router demand | +0.9% | North America and Europe, gradual Asia-Pacific uptake | Long term (≥ 4 years) |
| Energy-efficiency mandates prompting low-power router upgrades | +0.4% | Europe and North America regulatory compliance zones | Medium term (2-4 years) |
| Source: Mordor Intelligence | |||
Proliferation of Smart-Home and IoT Devices
Connected-device density climbed to 17 units per household in North America and 12 in Europe by 2025. This saturation forces legacy routers, originally designed for fewer than 10 concurrent links, into obsolescence. Households facing latency during simultaneous 4K streaming, smart-thermostat polling, and security-camera uploads now view tri-band or mesh systems as utilities rather than luxuries. ISPs exploit the pain point by bundling Wi-Fi 6E and Wi-Fi 7 gateways with new fiber installations, locking subscribers into managed Wi-Fi ecosystems at USD 10-15 per month. Matter interoperability has become baseline, compelling manufacturers to embed Thread border-router functionality that fragments competition between platform-centric entrants and traditional hardware brands.
Surging Global IP Traffic and High-Speed Broadband Uptake
Global IP traffic reached 4.8 zettabytes in 2024 and will exceed 7.5 zettabytes by 2028. Fiber penetration surpassed 52% in China and 48% in South Korea during 2025, creating pull for routers with 2.5 Gbps or 10 Gbps WAN ports. North American cable operators responded by integrating Wi-Fi 7 radios into DOCSIS 4.0 gateways, shifting profit pools from hardware to recurring managed-service fees. In India, BharatNet extended backbone capacity to 250,000 villages, but the absence of firmware-update infrastructure in sub-USD 25 routers leaves rural users exposed to botnets. These dynamics polarize the residential routers market between ISP-controlled gateways and premium enthusiast gear.
Migration to Wi-Fi 6/6E/7 Standards Fueling Replacement Cycles
Wi-Fi 7 routers entered volume shipment in late 2024 as Qualcomm, Broadcom, and MediaTek ramped 802.11be chipsets.[1]Qualcomm Newsroom. “Chipmakers Ramp 802.11be Silicon Production.” qualcomm.com/news ISPs accelerate adoption by offering no-cost gateway swaps to long-term subscribers, bypassing consumer price sensitivity and embedding Wi-Fi 7 two years ahead of client-device saturation. Regulatory approval for 6 GHz spectrum varies, the United States and Europe authorized usage in 2020 and 2021, while India waited until 2024, fragmenting inventory strategies. The lag creates a two-speed resident router market where ISP-bundled upgrades outpace retail sales, concentrating revenue with vertically integrated suppliers.
ISP Fiber Roll-Outs Bundling Wi-Fi 7 Gateways at Scale
Tier-1 ISPs such as AT&T, Spectrum, and BeFibre standardized on Wi-Fi 7 gateways for gigabit customers in 2025. By procuring chipsets in bulk, operators undercut retail pricing by USD 50-100 and secure allocation priority during shortages. Remote firmware updates and cloud diagnostics slash on-site service calls by 30%, allowing operators to recoup subsidies within 18 months. Stand-alone router vendors counter by targeting gamers and open-source enthusiasts, but that niche represents less than 15% of annual unit volume.
Restraints Impact Analysis*
| Restraint | (~)% Impact on CAGR Forecast | Geographic Relevance | Impact Timeline |
|---|---|---|---|
| Escalating cybersecurity and privacy risks | -1.2% | Global, acute in North America and Europe due to regulatory scrutiny | Short term (≤ 2 years) |
| Price sensitivity in emerging markets | -0.8% | Asia-Pacific (India, Southeast Asia), Africa, South America | Medium term (2-4 years) |
| User skill gaps causing feature under-utilization, delaying upgrades | -0.5% | Global, more pronounced in emerging markets and aging demographics | Long term (≥ 4 years) |
| Chipset supply-chain volatility creating product shortages and price spikes | -0.6% | Global, with acute impact on Tier-2 and Tier-3 OEMs | Short term (≤ 2 years) |
| Source: Mordor Intelligence | |||
Escalating Cybersecurity and Privacy Risks
Routers represented 75% of successful IoT botnet compromises in 2024. The EU Cyber Resilience Act now mandates five-year security-update commitments, adding USD 3-5 to bill of materials and squeezing low-margin brands.[2]European Commission Digital Strategy. “EU Cyber Resilience Act Sets Security-Update Rules.” digital-strategy.ec.europa.eu In the United States, a voluntary FCC cybersecurity label remains underused because most consumers cannot interpret technical badges. Privacy advocacy intensified after revelations that some ISP gateways harvest browsing metadata for ad targeting, pressuring operators to adopt opt-in frameworks. As households wait for regulatory clarity, upgrade cycles slow and OEMs divert budgets from feature innovation to compliance.
Price Sensitivity in Emerging Markets
In India, 68% of router purchases in 2025 were below USD 30, a range dominated by unbranded Wi-Fi 4 devices that lack WPA3 encryption. Import tariffs between 15% and 25% in sub-Saharan Africa inflate retail prices and keep fixed-line adoption urban-centric. Brazilian router prices climbed 15%-25% because of logistics and currency volatility. OEMs respond with stripped-down SKUs, but these cost-downs erode brand perception and cannibalize higher-margin lines, limiting revenue expansion even as unit shipments rise.
*Our forecasts treat driver/restraint impacts as directional, not additive. The impact forecasts reflect baseline growth, mix effects, and variable interactions.
Segment Analysis
By Connectivity Type: Wireless Dominance Anchored by Multi-Device Households
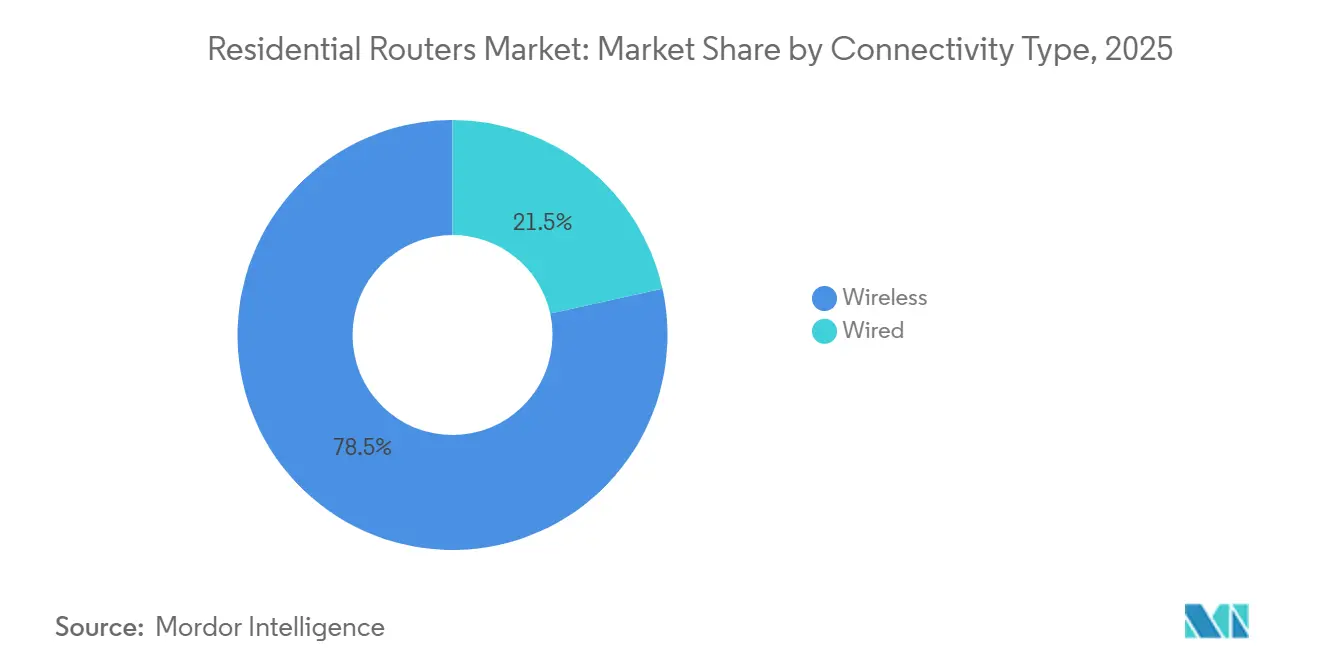
Wireless routers held 78.46% residential routers market share in 2025 and are set to grow at a 10.17% CAGR, reflecting their ability to manage simultaneous streams and remote-work loads. Households that host three or more concurrent video sessions favor tri-band units over wired alternatives that require costly structured cabling. ISPs accelerate wireless adoption by bundling mesh-capable gateways that erase dead zones, moving the residential routers market toward subscription models. The wired segment persists in latency-sensitive niches such as high-frequency trading, yet its contraction will continue as Wi-Fi 7 delivers near-wired performance.
Mesh ecosystems and AI-assisted roaming now define the wireless value proposition. The EU Radio Equipment Directive’s standardization on USB-C chargers lowers e-waste objections and shortens router replacement deliberations. Markets like Germany and Japan, which integrate Ethernet jacks in every room, still end sessions on Wi-Fi endpoints for flexibility. The residential routers market will therefore remain decisively wireless as IoT density rises.


By Wi-Fi Standard Generation: Wi-Fi 7 Ascent Driven by ISP Pre-Deployment
Wi-Fi 6 and 6E accounted for 47.82% of shipments in 2025, yet Wi-Fi 7 is poised for the fastest growth at 10.88% CAGR. Multi-link operation aggregates 2.4 GHz, 5 GHz, and 6 GHz bands to deliver deterministic latency for cloud gaming and augmented reality. ISPs distribute 802.11be gateways during service activation, cutting the adoption lag that historically separates new standards from mass uptake. China’s restriction of 6 GHz to indoor use forces dual-SKU strategies, but volume pricing will normalize by 2027.
Enthusiast-grade Wi-Fi 7 routers priced above USD 400 serve as brand halo products and constitute less than 8% of unit volume. As client devices arrive, the performance gulf will motivate replacements of Wi-Fi 5 units, further propelling the residential routers market size.
By Product Form Factor: Mesh Systems Capitalize on Whole-Home Coverage
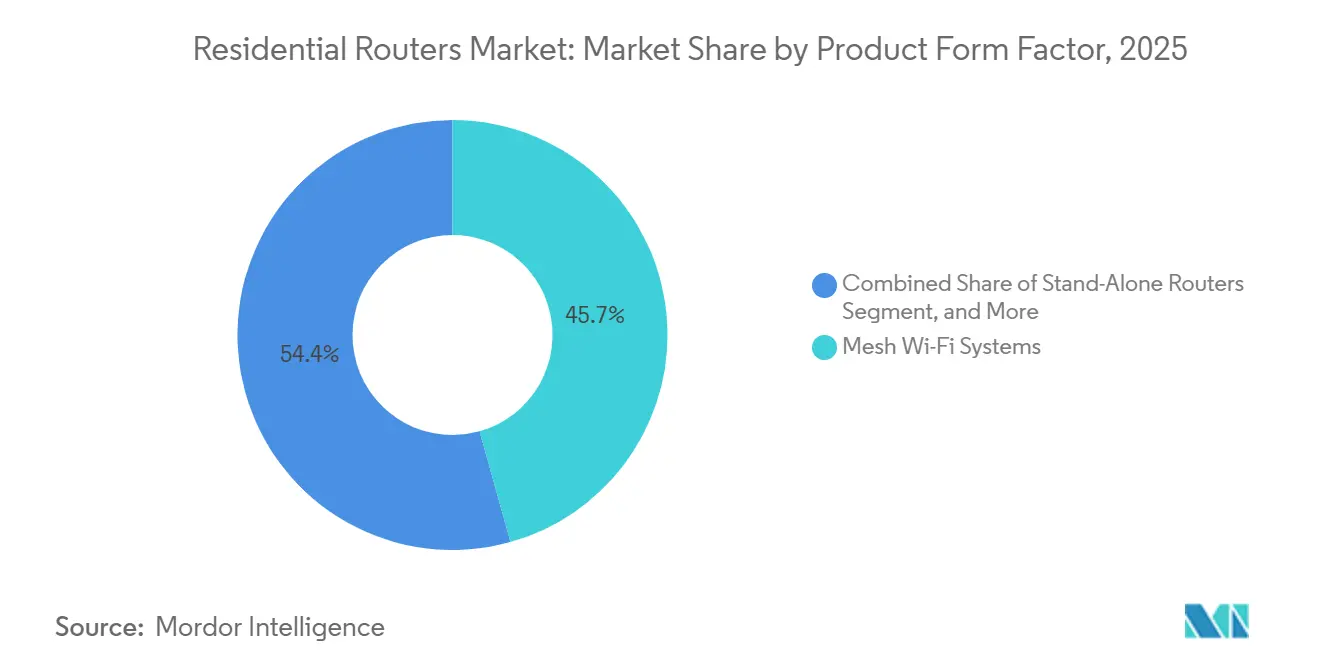
Mesh systems captured 45.65% of 2025 revenue and will sustain a 9.46% CAGR through 2031 as multi-story homes and thick-wall construction challenge single-unit coverage. Plug-and-play satellite nodes appeal to non-technical users looking for seamless roaming. ISPs upsell mesh extenders at USD 50–80, a profitable addition that also cuts support calls. Stand-alone routers survive in small apartments but face gross margins below 15%, driving vendors to pivot toward subscription services.
Modem-router gateways dominate ISP deployments because integrated designs trim power and simplify customer education. 5G fixed-wireless gateways bridge last-mile gaps in rural settings, though latency variability confines them to cost-sensitive users. As fiber expands, the residential routers market will coalesce around mesh and gateway hybrids that simplify home networking.

By Distribution Channel: ISP Bundling Reshapes Margin Pools
ISP-bundled and leased gateways generated 61.37% of 2025 revenue and will rise at a 9.79% CAGR. Zero-upfront-cost propositions convert routers into annuity streams through USD 10–15 monthly managed-Wi-Fi fees. Retail in-store sales shrank to 18% as big-box chains reduced SKU counts by 30%. Online direct-to-consumer brands like eero leverage firmware cadence and customer education to offset the absence of physical shelf space.
The leased-router model also accelerates hardware refresh every three to four years, advancing the residential routers market toward recurrent revenue. Power users who insist on open-source firmware continue to buy premium SKUs, yet they represent less than 12% of annual volume.
By End-User Household Type: MDUs Emerge as Fastest-Growing Segment
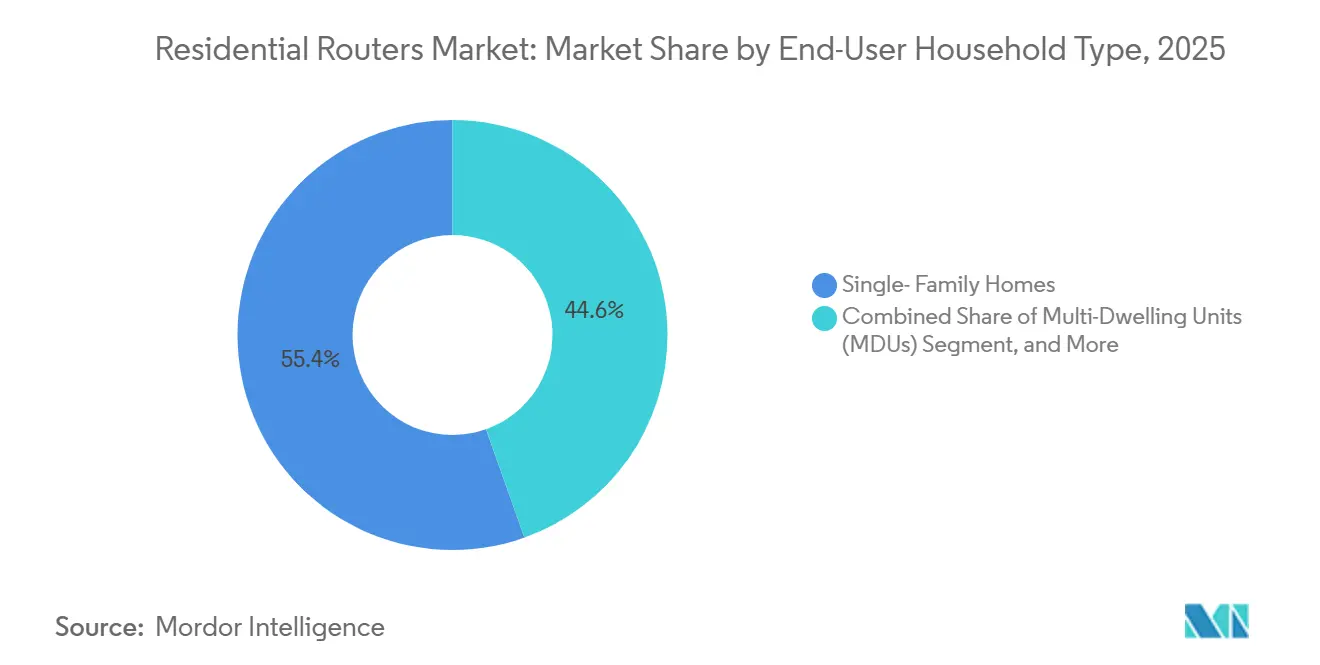
Single-family homes accounted for 55.43% of 2025 demand, but multi-dwelling units are expanding the fastest at a 10.02% CAGR. Property developers now view gigabit Wi-Fi amenities as table stakes, with vacancy penalties of 15-20% for laggards. Bulk service agreements hand procurement to building owners, embedding managed-Wi-Fi fees into rent and elevating mesh and centralized gateway installs.
MDUs require distributed antenna systems to overcome concrete attenuation, lifting per-unit hardware costs by USD 80–120. Small Office/ Home Office (SOHO) users, 12% of demand, pay premiums for dual-WAN failover and VPN throughput. As residential construction plateaus, MDUs will account for an outsized share of incremental residential routers market size growth.
Geography Analysis
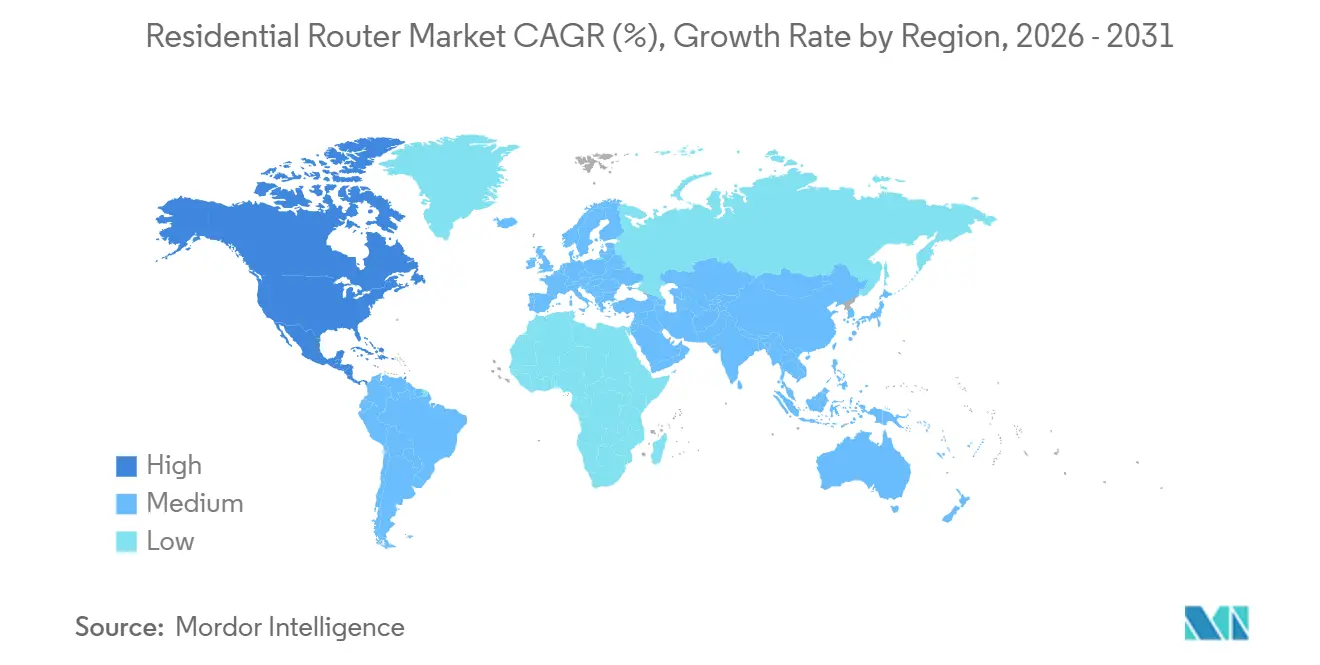
North America generated 41.58% of residential router revenue in 2025, propelled by ISP bundling that embeds Wi-Fi 7 gateways into fiber and cable tiers. Comcast’s xFi platform serves 32 million households and monetizes AI-driven optimization at USD 14 per month. AT&T and Verizon adopted similar tactics, cutting truck-roll costs by 28% through remote diagnostics. Average selling prices remain high at USD 140-200 for mesh systems. Regulatory moves such as the FCC cybersecurity label add compliance overhead without visibly shifting consumer choices.
Asia-Pacific is forecast to deliver the fastest regional expansion at a 10.62% CAGR through 2031. China’s 580 million fiber households require multi-gig routers, while India’s BharatNet backbone highlights security gaps in low-cost hardware. ASEAN nations remain price sensitive, with 72% of routers priced below USD 35. Japan and South Korea lead Wi-Fi 7 adoption as operators bundle 10 Gbps services.
Europe held 22% of global revenue in 2025, shaped by the EU Cyber Resilience Act and Ecodesign mandates that favor brands with established certification pipelines. BeFibre and EE priced AI-powered Wi-Fi 7 tiers at USD 15 per month, trimming churn by 18%. Germany’s structured wiring norms slow mesh proliferation, yet fiber penetration reached 48% in 2025, creating latent demand for multi-gig routers. South America, the Middle East, and Africa combined for 18% of revenue, constrained by import tariffs and currency volatility.[3]African Development Bank. “Tariff Barriers in Networking Equipment.” afdb.org

Regulatory Landscape
Regulation for residential routers is tightening around two themes: cybersecurity-by-design and supply-chain national security. In the European Union, the Radio Equipment Directive (Directive 2014/53/EU) cybersecurity requirements for certain internet-connected radio equipment became applicable in August 2025, supported by Commission Implementing Decision (EU) 2025/138 and harmonized standards such as the EN 18031-1:2024 to EN 18031-3:2024 series. Alongside the EU Cyber Resilience Act direction referenced in the report context (including multi-year security-update expectations), these measures raise the level of compliance testing, documentation, and firmware-support obligations for OEMs selling into Europe.
In the United States, policy actions in 2026 affected equipment authorization and lifecycle support for consumer routers produced outside the country. In March 2026, the FCC added foreign-produced consumer-grade routers to its Covered List, constraining new authorizations; in May 2026, it extended a waiver allowing software and firmware updates for existing covered routers until January 1, 2029, to preserve security patching continuity. NIST guidance, including NIST IR 8425A, continues to inform baseline router security recommendations cited by buyers and channel partners, reinforcing expectations around secure configuration, update mechanisms, and vulnerability response processes.
Value Chain Analysis
The residential router value chain begins with Wi-Fi and gateway silicon (notably Broadcom, Qualcomm, and MediaTek) and supporting RF front-end components, then moves through ODM/OEM design, certification, and high-volume assembly before flowing into ISP procurement and retail or e-commerce distribution. Chip fabrication concentration, including reliance on leading foundry capacity, and specialized RF components for Wi-Fi 7 (filters and front-end modules) create material lead-time sensitivity. That dynamic increases the importance of allocation agreements and multi-sourcing strategies for high-run gateway programs.
Downstream, ISPs capture a large share of demand capture and shape refresh cadence through bundled and leased gateways, which represented 61.37% of 2025 revenue in the report context. This shifts bargaining power toward operators that can standardize CPE models and run remote provisioning and diagnostics. Channel dynamics are increasingly software-led, with cloud management, remote firmware updates, and subscription security features layered over hardware, while regulatory events such as the FCC Covered List action in March 2026 push procurement teams to adjust approved-vendor lists and manufacturing footprints for US-bound SKUs.
Competitive Landscape
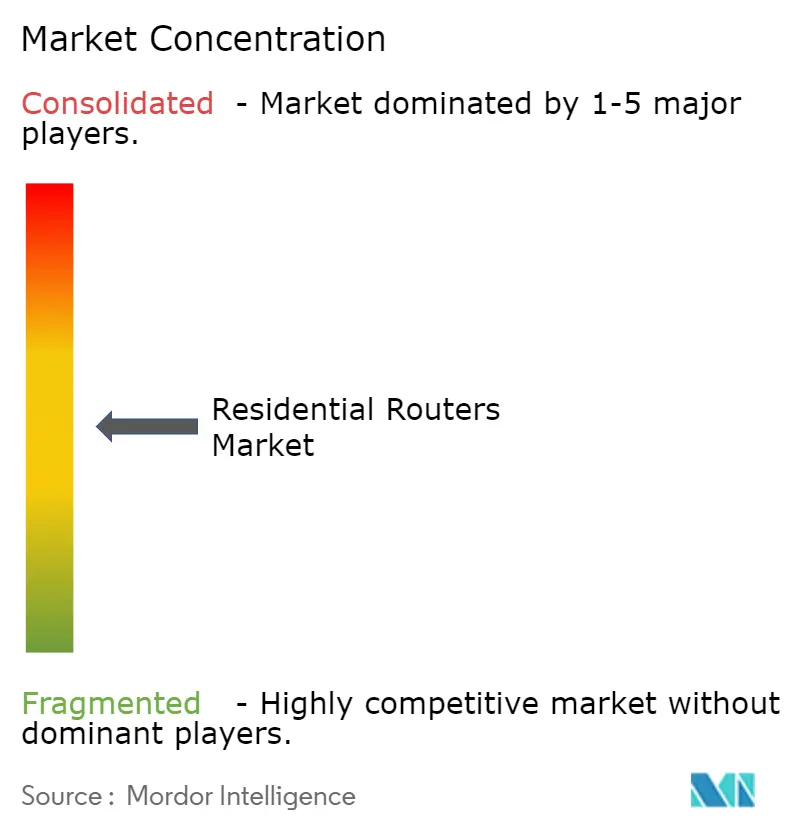
The residential routers market is moderately concentrated. The top five vendors, including Netgear, TP-Link, ASUS, D-Link, and Xiaomi, held about 48% of 2025 revenue. ISP-branded gateways from Cisco, CommScope, and Nokia dominate bundled channels, shading retail exposure. Vendors that secure multi-year chipset contracts with Qualcomm and Broadcom gain first-mover status in Wi-Fi 7 deployments, an advantage for vertically integrated players such as Huawei. White-space persists in MDU bulk deals where price ceilings hover below USD 60 per unit.
Technology differentiation increasingly revolves around cloud-based network optimization rather than hardware specifications. Qualcomm's Networking Pro Series chipsets enable real-time device prioritization and predictive channel switching, features that ISPs embed into tiered service plans priced at USD 10 to USD 18 per month.
Patent filings in 2024 and 2025 concentrated on multi-link operation (MLO) algorithms and AI-driven interference mitigation, signaling a shift toward software-defined networking architectures that commoditize hardware and elevate platform lock-in as the primary competitive moat. Smaller contenders such as Ubiquiti and Synology target enthusiast segments with open-source firmware compatibility and prosumer NAS integration, but these niches represent less than 10 percent of unit volume and face margin pressure as ISP-bundled alternatives incorporate similar features at zero upfront cost
Residential Routers Industry Leaders
D-Link Corporation
TP-Link Technologies Co. Ltd
NETGEAR Inc.
Belkin International, Inc. (Linksys)
ASUSTeK Computer Inc.
- *Disclaimer: Major Players sorted in no particular order

Market Opportunities and Future Outlook
A key opportunity centers on managed Wi-Fi bundles that turn residential routers into recurring-service endpoints. Comcast monetizes its xFi platform at about USD 14 per month across a base of 32 million households in the report context, and operators such as AT&T have expanded Wi-Fi 7 gateway tiers, including All-Fi Pro pricing cited in the report context. This creates whitespace for OEMs and platform providers that can package cloud optimization, device prioritization, and integrated security in ISP-grade gateways and mesh add-ons, particularly where operators use remote diagnostics to reduce truck rolls and standardize refresh cycles.
Regulatory and standards shifts also open near-term product and supply-chain whitespace. IEEE 802.11be (Wi-Fi 7) standardization, finalized publication in September 2025, provides a stable baseline for multi-link operation and 320 MHz channels, while 6 GHz rules remain regionally fragmented, requiring differentiated SKUs and certification paths. In the US, the March 2026 FCC Covered List action for foreign-produced consumer routers changes market entry conditions for new models and increases the value of compliant supply chains and authorized alternatives. The FCC waiver window for updates through January 1, 2029 highlights the commercial payoff of long-term firmware-support infrastructure. In Europe, the 2025 harmonized cybersecurity standards under the Radio Equipment Directive increase demand for routers with provable security controls and maintained update commitments, favoring vendors that can operationalize compliance across product lines rather than relying on one-off flagship devices.
Recent Industry Developments
- June 2026: NETGEAR launched NETGEAR Align, an AV platform layer that consolidates infrastructure services, with the Align Controller (GB406) slated to ship in August 2026. While it is rooted in pro AV workflows, the platform approach strengthens NETGEAR's software and services stack, which also supports managed networking experiences across its portfolio.
- May 2026: TP-Link announced Archer 8, its first Wi-Fi 8 (IEEE 802.11bn) router platform, positioned around real-world reliability, with launch timing communicated for October 2026. The announcement indicates early platform planning beyond Wi-Fi 7 and supports longer roadmap-driven upgrade programs across both retail and ISP channels.
- January 2026: NETGEAR announced the Nighthawk M7 5G portable WiFi 7 hotspot with an integrated eSIM marketplace. Bringing Wi-Fi 7 into travel and secondary-connection use cases expands addressable demand beyond fixed home gateways and supports attach opportunities through connectivity marketplaces.


Research Methodology Framework and Report Scope
Market Definition and Coverage
The residential routers market covers hardware sold or bundled for home use that connects a broadband input to multiple devices over Wi-Fi or Ethernet, including stand-alone routers and home Wi-Fi systems used to create a local network.
Scope exclusions: We exclude enterprise-grade routing gear, carrier core infrastructure, and standalone networking devices that do not perform a router function (such as unmanaged switches).
Segmentation Overview
- By Connectivity Type
- Wired
- Wireless
- By WiFi Standard Generation
- Wi-Fi 4 (802.11n)
- Wi-Fi 5 (802.11ac)
- Wi-Fi 6 / 6E (802.11ax)
- Wi-Fi 7 (802.11be)
- By Product Form Factor
- Stand-alone Routers
- Mesh Wi-Fi Systems
- Modem- Router Gateways (IADs)
- 5G/ FWA Home Gateways
- By Distribution Channel
- Retail (In-store)
- Online/ E-commerce
- ISP Bundled/ Leased
- Direct-to-Consumer Brands
- By End-User Household Type
- Single- Family Homes
- Multi- Dwelling Units (MDUs)
- Small Office/ Home Office (SOHO)
- By Geography
- North America
- United States
- Canada
- Mexico
- South America
- Brazil
- Argentina
- Rest of South America
- Europe
- Germany
- United Kingdom
- France
- Italy
- Spain
- Rest of Europe
- Asia-Pacific
- China
- Japan
- India
- South Korea
- ASEAN
- Rest of Asia-Pacific
- Middle East
- Saudi Arabia
- United Arab Emirates
- Rest of Middle East
- Africa
- South Africa
- Nigeria
- Rest of Africa
- North America
Data Sources, Market Sizing, and Validation
Desk Research
Desk research starts with building a clean view of the demand pool and the technology transition curve in homes. We used public references such as ITU broadband indicators, OECD broadband portals, FCC communications statistics, and national telecom regulator releases for household connectivity and speed upgrades. For device and standard context, sources such as IEEE 802.11 publications, Wi-Fi Alliance release notes, and relevant peer-reviewed networking papers were reviewed to keep terminology and generation timing consistent.
We also reviewed company filings, investor decks, import and export trade summaries, and reputable press coverage to understand channel shifts like ISP bundles versus retail and online purchases. Where needed, paid subscriptions for company financials and intelligence, patent databases, and an import and export shipment-level database were used to cross-check revenue direction, product-cycle timing, and country-level supply signals. The sources listed here are illustrative only, and many other public references were also used for data collection, validation, and clarification.
Primary Interviews and Surveys
Primary work was used to test real-world pricing and mix, and then to confirm how quickly households are moving from Wi-Fi 5 to Wi-Fi 6, 6E, and early Wi-Fi 7-ready models. We spoke with a spread of router and gateway ecosystem participants, channel voices, and connectivity stakeholders across APAC, EMEA, and the Americas, so the model reflects differences in broadband rollouts, multi-dwelling living, and the ISP equipment replacement cycle.
Distribution of primary research fieldwork respondents
| Company type | Respondent position | Region |
|---|---|---|
| Top tier: 29% | CXOs: 16% | APAC: 48% |
| Mid tier: 52% | Functional/Unit leaders: 24% | EMEA: 33% |
| Smaller Players: 19% | Managers: 60% | Americas: 19% |
Market-Sizing & Forecasting
Market sizing was built using top-down and bottom-up logic, starting from the connected household and broadband base, then translating that into router demand using replacement timing and attach behavior. A top-down demand pool assessment was used first, where broadband household counts, router replacement cycles, ISP CPE refresh patterns, and the share of homes upgrading to mesh were converted into annual unit demand by region. To keep the totals realistic, we then corroborated the outcome with selective bottom-up checks, such as sampled average selling price (ASP) by Wi-Fi generation and form factor, channel mix checks across retail, online, and ISP bundles, and a limited roll-up of supplier and distribution signals where data was available.
Key inputs that moved the model included household broadband penetration, average devices per household (which pushes mesh adoption), the installed base shift across Wi-Fi 5, Wi-Fi 6, and Wi-Fi 6E, and the pricing spread between stand-alone and mesh systems. We also tracked broadband speed tier upgrades, the share of fiber and fixed wireless access gateways entering homes, and regional inflation and FX timing to keep values comparable. Forecasts were generated using scenario analysis supported by simple trend fitting on upgrade indicators, and the final curve was adjusted after primary feedback on how fast ASPs typically normalize after a new standard launch. When bottom-up signals were missing for smaller countries, we used proxy logic based on broadband households and income bands, then rechecked the output against nearby markets with similar ISP structures.
Data Validation & Update Cycle
Validation is done in layers so obvious model drift gets caught early. Our team compares the implied unit demand and ASPs against independent signals like broadband adds, Wi-Fi generation shipment narratives, and channel inventory direction, and then reviews any sharp variance before accepting it. If a number looks out of pattern, we recheck assumptions like mesh share, gateway bundling rates, and currency conversion timing, and we may reconnect with primary sources when the gap cannot be explained.
Each report goes through multi-step analyst reviews, where the market logic, math, and scope boundaries are checked separately. Reports are refreshed annually, and interim updates are made when material events occur (for example, a major standard transition or a demand shock). Before delivery, a fresh pass is performed so clients receive the latest updated view rather than an older stored output.
Mordor Intelligence's Residential Routers Market Sizing Compared With Other Published Estimates
Published numbers for residential routers can look far apart even when everyone uses USD, because the product boundary and the timing choices behind the numbers are not always the same. Differences usually come from what gets counted as a router in the home, whether ISP-provided gateways are included, and how ASPs are updated when a new Wi-Fi generation launches.
For this market, the largest gaps tend to come from refresh cadence and currency timing, because router pricing changes quickly after new Wi-Fi standards move from early adopters to mass retail. Some estimates also blend routers with adjacent home networking devices, or they apply a single global ASP curve even though mesh mix and ISP bundling behave differently by region. In our work, quarterly price checks and FX normalization are used to prevent older pricing from being carried forward, which is a key reason the value curve stays stable across updates, a modeling choice applied by Mordor Intelligence.
Benchmark comparison
| Source | Market Size | Gaps in Research Methodology |
|---|---|---|
| Mordor Intelligence | USD 13.21 B (2025) | |
| Industry Data Portal A | USD 10.58 B (2024) | This figure is published under a broader residential category that combines routers with switches and master controls, and the base year is one year earlier, which can shift value due to ASP drops and FX movement. |
| Global Research Desk B | USD 8.20 B (2024) | The scope appears to stay within router types but tends to use a lower starting value, which can happen when ISP-bundled gateways and mesh system uplift are treated conservatively or when ASP progression is smoothed too heavily after a standard transition. |
Overall, the spread is mainly explained by scope boundaries and timing choices, followed by how quickly ASPs are allowed to move as Wi-Fi 6 and 6E become mainstream. By keeping the variables visible and rechecking assumptions against channel and demand signals, we keep the estimate traceable to practical inputs that can be repeated and updated in the next refresh cycle.


Key Questions Answered in the Report
What growth rate is projected for the residential router market between 2026 and 2031?
The residential router market is forecast to grow at a 9.18% CAGR from 2026 to 2031.
Which connectivity type leads current demand?
Wireless routers dominate, holding 78.46% share in 2025 and expanding with a 10.17% CAGR.
How are ISPs influencing router replacement cycles?
ISPs bundle Wi-Fi 7 gateways with fiber packages and charge USD 10–15 monthly for managed Wi-Fi, shortening refresh intervals to 3–4 years.
Why are mesh systems growing faster than stand-alone routers?
Mesh nodes solve coverage gaps in multi-story homes, leading to a 9.46% CAGR compared with stagnating single-unit sales.
Which region is expected to post the fastest growth?
Asia-Pacific is projected to grow at a 10.62% CAGR through 2031, driven by China’s fiber mandates and India’s rural broadband push.
What is the main cybersecurity concern for residential routers?
Routers account for 75% of successful IoT botnet breaches, prompting new security-update regulations in the European Union and the United States.
Page last updated on:






