
Market Overview
| Study Period | 2020 - 2031 |
|---|---|
| Market Size (2026) | USD 7.05 Billion |
| Market Size (2031) | USD 8.14 Billion |
| Growth Rate (2026 - 2031) | 2.91 % |
| Fastest Growing Market | Asia Pacific |
| Largest Market | Europe |
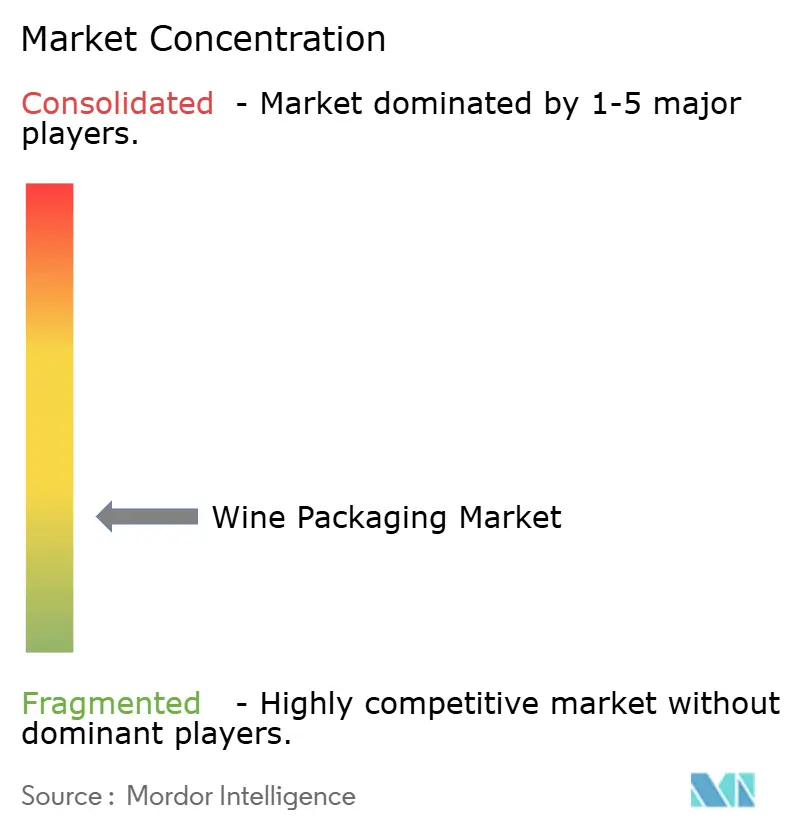
| Market Concentration | Low |
Major Players *Disclaimer: Major Players sorted in no particular order Image © Mordor Intelligence. Reuse requires attribution under CC BY 4.0. | |

Wine Packaging Market Analysis by Mordor Intelligence
The wine packaging market size was valued at USD 6.85 billion in 2025 and estimated to grow from USD 7.05 billion in 2026 to reach USD 8.14 billion by 2031, at a CAGR of 2.91% during the forecast period (2026-2031). Strong glass bottle demand, growing interest in lightweight designs, and the rapid adoption of alternative formats such as cans and bag-in-box options are steering this trajectory. Premiumisation in China, lightweight glass roll-outs in Europe, and direct-to-consumer (DtC) acceleration in North America are reshaping production scale and logistics economics across the wine packaging market. Regulatory pressure-from the European Union’s 100%-recyclable-by-2030 mandate to California’s redemption-value expansion-continues to push suppliers toward circular materials and energy-efficient furnaces, even as glass price volatility persists. Metal packaging’s recyclability appeals to younger, mobile consumers, while bio-based closures gain traction as vineyards certify sustainability practices.
Key Report Takeaways
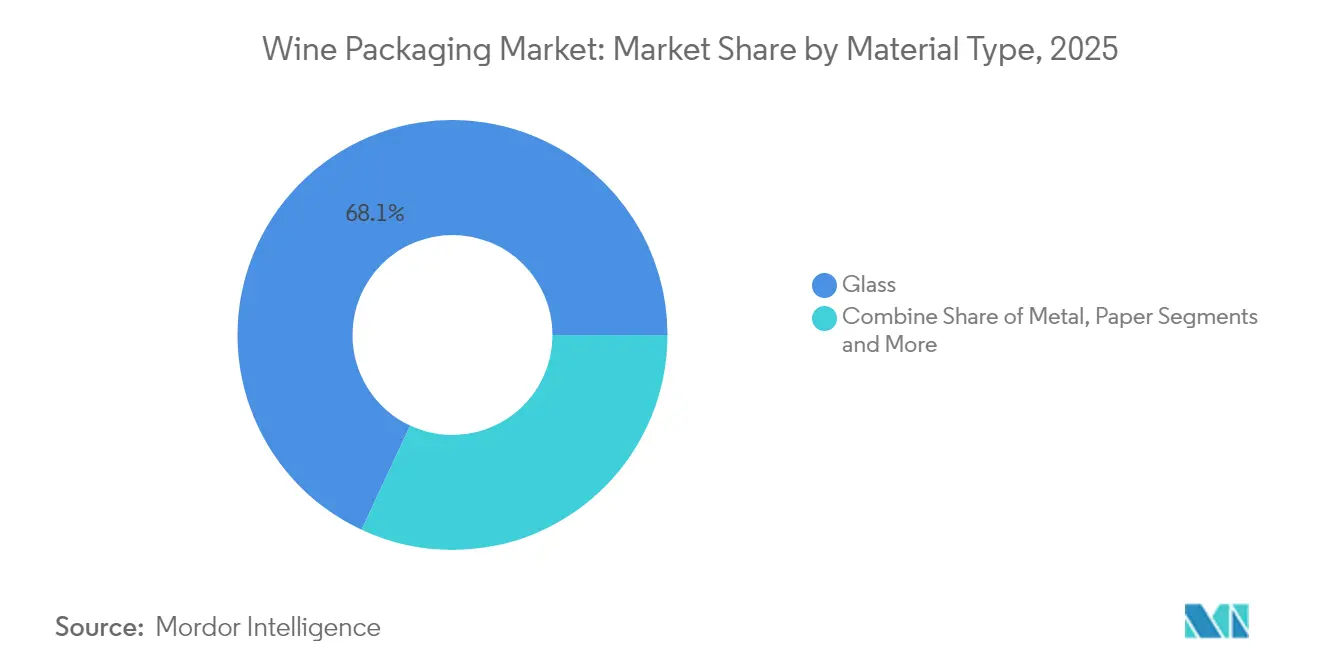
- By material, glass retained 68.05% of the wine packaging market share in 2025; metal is projected to expand at a 5.25% CAGR to 2031.
- By product type, glass bottles led with 68.10% of the revenue in 2025, while the bag-in-box segment is forecasted to grow at a 5.95% CAGR through 2031.
- By closure type, the screw caps segment captured 54.65% share of the wine packaging market size in 2025, and is projected to grow at a CAGR of 5.18% through 2031.
- By wine type, still wines held 70.85% of category volume in 2025; low- and no-alcohol wines are set to record a 4.45% CAGR to 2031.
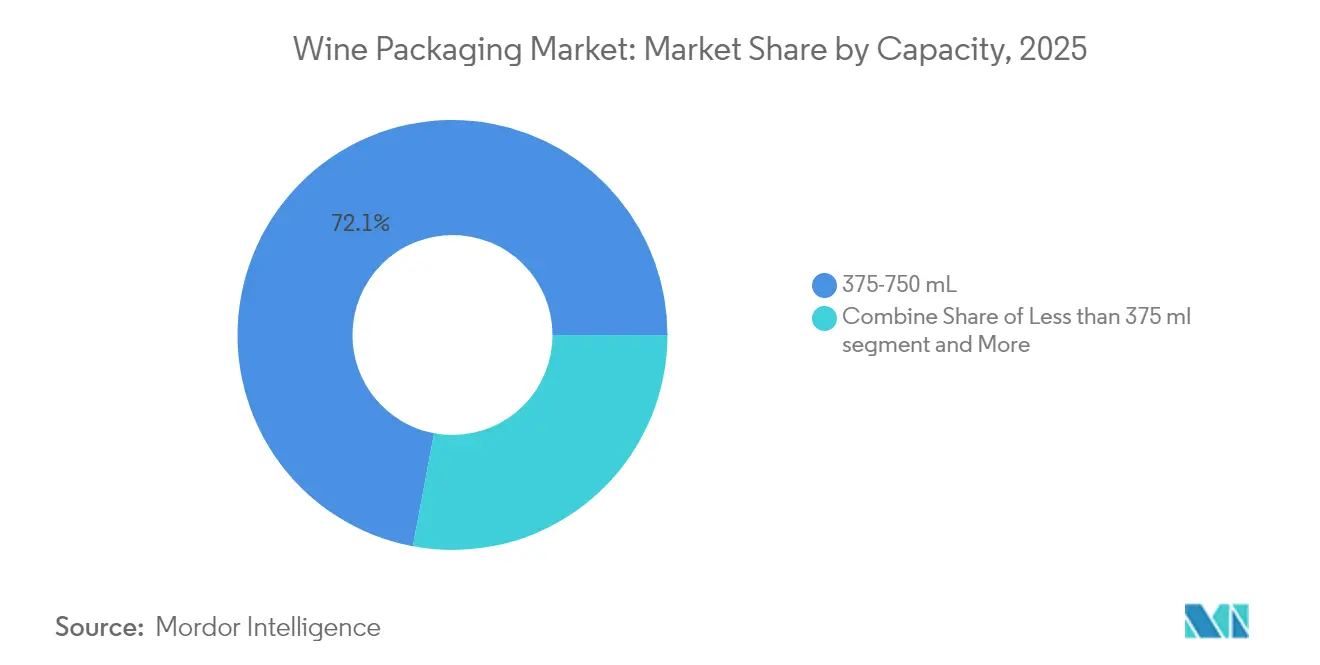
- By capacity, the 375-750 mL segment controlled 72.05% of the wine packaging market share in 2025, while the more than 1,500 mL segment is projected to grow at a CAGR of 3.32% through 2031.
- By distribution channel, the direct sales segment accounted for 69.60% of 2025 revenue and is projected to rise at a 3.12% CAGR to 2031.
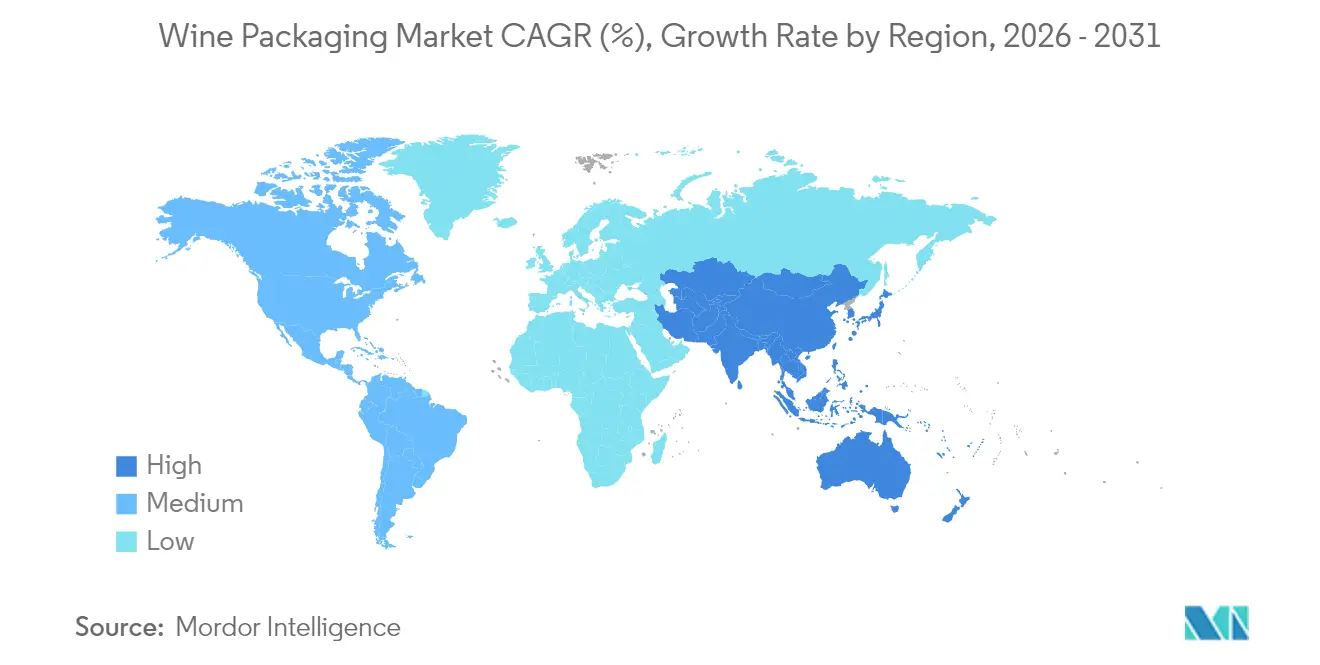
- By geography, Europe led with 49.10% revenue in 2025, while Asia-Pacific is forecasted to grow at a 4.55% CAGR through 2031.
Note: Market size and forecast figures in this report are generated using Mordor Intelligence’s proprietary estimation framework, updated with the latest available data and insights as of 2026.
Market Trends and Insights
Drivers Impact Analysis of Wine Packaging Market*
| Driver | (~) % Impact on CAGR Forecast | Geographic Relevance | Impact Timeline |
|---|---|---|---|
| Premiumisation of wine in China elevating demand for designer bottles | +0.8% | China, wider APAC | Medium term (2-4 years) |
| Lightweight glass bottle adoption by European wineries to cut CO₂ | +0.6% | Europe, North America | Long term (≥ 4 years) |
| Rapid uptake of bag-in-box formats in Nordic e-grocery | +0.4% | Nordics, N. Europe | Short term (≤ 2 years) |
| Rise of DtC channels in the US accelerating ready-to-ship packs | +0.5% | North America | Medium term (2-4 years) |
| Surge in canned and PET single-serve wines for outdoor use in Oceania | +0.3% | Australia, New Zealand | Short term (≤ 2 years) |
| Vineyard sustainability certifications driving bio-based closures | +0.2% | Global premium regions | Long term (≥ 4 years) |
| Source: Mordor Intelligence | |||
Premiumisation of Wine in China Elevating Demand for Designer Bottles
Young urban consumers in China value convenience and affordability yet still associate sophisticated design with quality. Innovations such as Huadong Winery’s keg wine and Franzia’s boxed offerings support casual gatherings without diluting brand equity, lifting premium-styled alternatives within the wine packaging market. [1] Vino Joy, “How Unconventional Wine Packaging Is Winning Over Young Palates in China,” vino-joy.com
Lightweight Glass Bottle Adoption by European Wineries to Cut CO₂
Bourgogne’s carbon-neutral roadmap exposed bottle weight as a critical emissions driver; Verallia’s 300 g Bordeaux Air proves that a lighter bottle can retain tradition while trimming up to 40% of CO₂, propelling broader adoption across the wine packaging market. [2]Meininger's International, “Sweden Bids Farewell to Heavy Bottles,” meiningers-international.com
Rapid Uptake of Bag-in-Box Formats in the Nordics’ E-grocery Channel
Systembolaget’s policies helped bag-in-box capture more than 50% volume in Sweden and Norway, delivering 40% logistics savings and reinforcing environmental credentials that resonate in the wine packaging market.
Rise of DtC Channels in the US Accelerating On-premise Ready-to-Ship Packaging
California’s CRV expansion aligns packaging with recycling targets, rewarding solutions that ship safely and recycle easily, boosting sales through DtC platforms that underpin the wine packaging market.
Restraints Impact Analysis of Wine Packaging Market*
| Restraint | (~) % Impact on CAGR Forecast | Geographic Relevance | Impact Timeline |
|---|---|---|---|
| EU plastic packaging taxes increasing PET cost | -0.4% | Europe, spillover | Short term (≤ 2 years) |
| Recyclate shortages limiting rPET roll-outs | -0.3% | Global, esp. EU & US | Medium term (2-4 years) |
| Higher oxygen transmission risk in alt-closures | -0.2% | Global premium tiers | Long term (≥ 4 years) |
| Soda-ash price volatility inflating glass costs | -0.5% | Global | Short term (≤ 2 years) |
| Source: Mordor Intelligence | |||
EU Plastic Packaging Taxes Increasing Cost of PET Solutions
Mandatory recycled-content quotas and PFAS bans inflate compliance costs, making PET less competitive for premium lines within the wine packaging market.
Global Recyclate Supply Shortages Limiting rPET Wine Bottle Roll-outs
Competition with soft drinks for food-grade rPET escalates prices; wine volumes lack the scale to secure feedstock, constraining sustainable goals across the wine packaging market.
*Our forecasts treat driver/restraint impacts as directional, not additive. The impact forecasts reflect baseline growth, mix effects, and variable interactions.
Wine Packaging Market Segment Analysis
By Material Type:
Glass Dominance Faces Metal InnovationGlass accounted for 68.05% of the wine packaging market in 2025 due to its inert nature and premium perception. Lightweight furnace upgrades and higher cullet ratios help maintain leadership while cutting emissions. Metal’s 5.25% CAGR reflects aluminum’s recyclability and chill-speed advantages, luring outdoor-oriented consumers and shaping future preference across the wine packaging market. Paper bottles from Frugalpac and PET hybrids broaden the material field as regulators push 100% recyclable targets.
Plastic and paper advances test longstanding hierarchies. Frugalpac’s fibre shell uses 77% less plastic and holds an 84% lower carbon footprint than glass, making it an attractive alternative in the wine packaging industry. Glass manufacturers counter by piloting electric furnaces and ultra-light designs. Aluminum bottles leverage resealable tops to extend freshness, while bio-based PET integrates up to 30% rPET yet awaits a greater recyclate supply.



By Product Type:
Bottles Lead While Cans AccelerateTraditional glass and plastic bottles delivered 71.45% of 2025 revenue, an anchor for cellaring and ritual. Still, the bag-in-box segment is growing at a 5.95% CAGR, meeting convenience and regulations within the wine packaging market. Bag-in-box lines achieve scale benefits and hold 56% of Swedish volume, illustrating premium-grade evolution.
PET bottles secure niche roles with a six-month shelf life thanks to ALPLA’s barrier layers, while pouches win festival share. Smart labels that satisfy EU digital mandates surface on bottles and cans alike, enriching traceability and reinforcing the wine packaging market’s omnichannel strategy.
By Closure Type:
Strategic Role of Screw Caps in the MarketPackaging formats utilizing screw caps dominate global wine packaging, accounting for 54.65% in 2025, due to their reliability, cost efficiency, and alignment with consumer preferences. Aluminum screw caps provide excellent oxygen management, consistent sealing, and reduced cork taint risk, appealing to winemakers and consumers. Their lightweight design, compatibility with high-speed bottling lines, and lower transportation costs make them more viable than corks. In regions like Australia, New Zealand, and North America, screw caps are the preferred closure for young and mid-tier wines. Their convenience, ease of opening, and re-sealability suit casual, single-serve, and on-the-go consumption.
Screw caps are also vital as brands focus on quality, sustainability, and growth. Advances in liner technology, such as Saranex and Tin-Saran, allow wineries to customize oxygen ingress for varietals and aging, making them suitable for premium wines. Sustainability goals drive adoption as aluminum screw caps are recyclable and have a lower carbon footprint than corks. The rise of canned wines, PET bottles, and other formats further supports screw caps in packaging innovations. As wine consumption trends shift toward convenience and consistency, especially among younger consumers, packaging formats utilizing screw caps are expected to grow at a CAGR of 5.18% through 2031.
By Wine Type:
Still Wine Dominance Challenged by Low-Alcohol InnovationStill wine carried 70.85% market share in 2025. Health trends push low- and no-alcohol lines to a 4.45% CAGR, demanding lighter, informative packaging in the wine packaging market. Sparkling lines maintain pressure-resistant bottles yet adopt capsule-free necks to save resources.
Fortified and dessert wines embrace smaller glasses to curb oxidation and align with moderation, while low-alcohol labels employ shrink-sleeve graphics to broadcast calorie counts. QR-code disclosures lift transparency and meet upcoming EU e-label rules, tightening convergence between wellness and the wine packaging industry.
By Capacity:
Standard Bottles Dominate While Mini Formats GrowThe 375-750 mL tier delivered 72.05% of 2025 shipments and benefits from global line efficiencies. More than 1,500 mL volumes expand at a 3.32% CAGR, as large formats remain keynote for restaurant service and collector events, yet sustainability pushes them toward bulk-on-tap systems.
Mini bottles, often aluminum or PET, allow luxury producers to preserve price points while attracting trial. Standard bottles undergo 10-15% weight cuts via optimized glass allocation, maintaining strength but lowering freight emissions, reinforcing the wine packaging industry’s decarbonization agenda.
By Distribution Channel:
Direct Sales Lead with Indirect GrowthDirect channels held a 69.60% share in 2025, underpinned by winery clubs and destination tourism that favor custom shipping units in the wine packaging market. Retail and e-commerce platforms fuel indirect growth at 2.05% CAGR, demanding pallet-friendly cases and tamper-proof seals.
Hybrid strategies emerge as wineries meld personalized DtC experiences with broad grocery reach. Packaging capable of automated fulfilment yet delivering a premium unboxing becomes decisive, reflecting omnichannel complexity across the wine packaging industry.
Geography Analysis
Europe and North America Wine Packaging Market
Europe and North America remain the largest revenue contributors. Robust DtC laws and recycling expansion in California integrate 5- and 10-cent deposits that steer the wine packaging market toward curbside-compatible designs. European policies dictate 100% recyclability by 2030, sparking investment in electric furnaces and bag-in-box innovation that lowers freight emissions.
APAC Wine Packaging Market
Asia-Pacific leads growth through 2031. China’s premiumisation mixes designer glass with cost-effective boxes, while Australia grants back lightweight PET and paper bottles, accelerating regional momentum for the wine packaging market. E-grocery convenience intertwines with environmental marketing to convert younger consumers.
MEA and South America Wine Packaging Market
The Middle East and Africa, and South America, provide emerging pathways. Warmer climates lean toward lighter, oxidation-barrier formats, and exporters deploy packaging that meets EU rules while minimizing freight. Domestic producers explore rPET and canning lines to reach new drinkers, illustrating the global spread of the wine packaging industry’s innovations.

Regulatory Landscape
Wine packaging compliance is increasingly shaped by labeling and recyclability requirements that differ across major consuming regions. In the European Union, Regulation (EU) 2026/471 (adopted in February 2026) enables the European Commission to set delegated acts harmonizing how ingredient and nutrition declarations are presented, including provisions that support language-free electronic means for certain use cases, which increases the role of QR codes and digital label governance for wine packaging formats sold cross-border.
In the United States, the Alcohol and Tobacco Tax and Trade Bureau (TTB) continues to set detailed wine labeling requirements (for wine at 7% ABV or more), covering items such as net contents, alcohol content, and sulfite declarations where applicable; in May 2026, TTB updated net contents labeling requirements that specify minimum font heights (2 mm for containers over 187 mL and 1 mm for 187 mL or less). In the United Kingdom, labeling rules remain distinct from EU moves on expanded on-pack disclosures, with no mandate for e-labels, full ingredient lists, or nutrition declarations on wine labels as of 2026, reinforcing the need for either market-specific label variants or a consolidated label strategy that can serve both UK and EU distribution.
Competitive Landscape
Market concentration is fragmented. Owens-Illinois, Verallia, and Ardagh Group dominate glass, yet face aluminum stalwarts such as Ball and disruptive paper pioneers like Frugalpac. Verallia’s 300 g Bordeaux Air bottle reduces emissions 40%, reinforcing incumbency while meeting the wine packaging market’s low-carbon targets.
Start-ups leverage agility: Packamama’s flat PET bottle secures government funding in Australia, and Frugalpac’s US rollout with Target places 256,000 units on shelf, broadening consumer access. TricorBraun’s acquisitions of Euroglas and Glaspack highlight consolidation as distributors seek scale across the wine packaging market.
Technology patents on multilayer pouches, self-aerating bottles and IoT-enabled trackers proliferate, creating new points of differentiation. Partnerships between closure specialists and analytics firms track oxygen ingress in real time, enhancing quality control inside the wine packaging industry.
Wine Packaging Industry Leaders
Owens-Illinois Inc. (O-I)
Verallia SA
Ardagh Group SA
Saverglass SAS
SIG Combibloc Group AG
- *Disclaimer: Major Players sorted in no particular order
Wine Packaging Market Companies Covered in this Report
- Owens-Illinois Inc. (O-I)
- Verallia SA
- Ardagh Group SA
- Saverglass SAS
- Vetropack Holding AG
- BA Glass Group
- Consol Glass Pty Ltd
- Guala Closures Group
- Amorim Cork, S.A.
- Vinventions LLC (Nomacorc)
- Amcor plc
- Ball Corporation
- TricorBraun Inc.
- Tetra Laval International SA
- SIG Combibloc Group AG
- Scholle IPN (Sealed Air)
- Liqui-Box (Sealed Air)
- International Paper Company
- G3 Enterprises Inc.
- Maverick Enterprises Inc.
- Encore Glass Inc.
- Smurfit WestRock
- Crown Holdings, Inc.

Market Opportunities and Future Outlook
Lightweighting and reuse infrastructure are creating whitespace in premium glass and in alternative formats that improve logistics economics for direct and e-commerce channels. Glass suppliers are commercializing sub-400 g designs and reuse pools, including Vetropack releasing a 350 g Rhinewine bottle in April 2026 while supporting a reusable bottle pool scheme in Austria, along with supplier-led lightweight bottle programs already visible across Europe. These efforts align with operational needs to reduce transport emissions and breakage while keeping the design cues that still drive premium wine positioning.
Alternative pack formats are also moving from trial to commercialization in multiple wine regions, creating opportunities for fillers and packaging suppliers that can substantiate shelf-life and line compatibility. In March 2026, Tetra Pak partnered with C4C Packaging to deploy a single-serve aseptic wine format in Australia using Tetra Prisma Aseptic 250 ml Edge cartons with DreamCap 26 Pro, and Stellenbosch Vineyards launched South Africa's first Eco-Flat Wine Bottle (63 g) with Polyoak Packaging, Packamama, and Safripol. Material innovation is extending into next-generation polymers for flat bottles, with Packamama in January 2026 announcing a shift to develop and trial PEF (Releaf) following an Australian government grant, while deposit-return expansion adds another pull-through lever, including Western Australia commencing inclusion of glass wine and spirit bottles in its Container Deposit Scheme in July 2026.
Recent Industry Developments in Wine Packaging Market
- July 2026: The Government of Western Australia commenced inclusion of glass wine and spirit bottles in the state's Container Deposit Scheme (CDS/DRS). This expands the economic incentive to return glass, influencing pack mix decisions toward containers that perform well in collection and sorting systems. Deposit program coverage also raises the value of standardized, high-recovery packaging designs for wineries distributing into the state.
- February 2026: Verallia launched its Selective Line Balance range of eco-designed wine and spirits glass packaging with reduced weight and higher recycled cullet content. The launch reinforces competitive differentiation in premium glass by combining lightweighting with circular-content claims that help brand owners respond to tightening sustainability requirements. It also supports higher-throughput decarbonization strategies at glass suppliers by pushing recycled input and lower mass per bottle into mainstream catalogs.
- April 2024: O-I Packaging Solutions and Revino rolled out a returnable, reusable glass wine bottle system in the US Pacific Northwest, with production scaling to more than 2.4 million bottles. The initiative operationalizes reuse at commercial volume, shifting part of sustainability efforts from single-use lightweighting to multi-trip packaging models. It also creates a template for regional reuse networks that depend on standardized bottle designs, backhaul logistics, and cleaning capacity.


Wine Packaging Market Report Scope and Research Methodology
Market Definition and Coverage
For this methodology, the wine packaging market covers the packaging components used to contain, protect, and sell wine, including primary packs and key closures used at the point of filling and distribution.
Scope exclusions: Secondary transport packaging that is not wine-specific and packaging used for non-wine alcoholic drinks is excluded from this sizing.
Segments Covered in This Report
- By Material Type
- Glass
- Plastic
- Metal
- Paper
- By Product Type
- Glass Bottles
- Plastic Bottles
- Bag-in-Box
- Cans
- Pouches
- Boxes and Other Products
- By Closure Type
- Natural Cork
- Technical/Synthetic Cork
- Screw Caps
- Crown Caps
- Others (T-stoppers, Vino-Lok)
- By Wine Type
- Still Wine
- Sparkling Wine
- Fortified and Dessert Wine
- Low and No-Alcohol Wine
- By Capacity
- Less than 375 mL
- 375-750 mL
- 751-1,500 mL
- More than 1,500 mL
- By Distribution Channel
- Direct Sales
- Indirect Sales
- By Geography
- North America
- United States
- Canada
- Mexico
- Europe
- Germany
- United Kingdom
- France
- Italy
- Spain
- Russia
- Rest of Europe
- Asia-Pacific
- China
- India
- Japan
- South Korea
- Australia and New Zealand
- Rest of Asia-Pacific
- Middle East and Africa
- Middle East
- United Arab Emirates
- Saudi Arabia
- Turkey
- Rest of Middle East
- Africa
- South Africa
- Nigeria
- Egypt
- Rest of Africa
- Middle East
- South America
- Brazil
- Argentina
- Rest of South America
- North America
Data Sources, Market Sizing, and Validation
Desk Research
Desk work starts by mapping the demand pool for wine and then linking it to the packaging formats most used in trade. We referenced public and official sources such as OIV statistics, FAOSTAT, UN Comtrade trade flows, and packaging waste and recycling rules published by regulators (for example, EU packaging policy pages) to anchor volume and material signals.
After that, we reviewed company annual reports, investor presentations, association websites, and reputable press coverage to track packaging mix shifts such as lightweight glass, alternative formats, and closure preference changes. In a few cases, paid subscriptions were used only for company financials and news and financials, and also to cross-check import and export shipment patterns where trade codes allow it. The sources listed here are illustrative, and other public documents were also used to collect data, validate assumptions, and clarify open questions.
Primary Interviews and Surveys
Primary work focused on packaging converters, closure suppliers, wine producers, and distribution side stakeholders, so that model assumptions could be corrected when public data was delayed or too broad. Respondent input also helped confirm pack format shares, typical pricing bands by material, and how contracting terms pass through energy and raw material changes across regions.
Distribution of primary research fieldwork respondents
| Company type | Respondent position | Region |
|---|---|---|
| Top tier: 26% | CXOs: 13% | APAC: 48% |
| Mid tier: 57% | Functional/Unit leaders: 27% | EMEA: 33% |
| Smaller Players: 17% | Managers: 60% | Americas: 19% |
Market-Sizing & Forecasting
The sizing model is built from the top down by reconstructing the wine packaging demand pool from wine production and trade flows, then applying packaging format and closure adoption shares by region and wine type. To keep totals realistic, we corroborated results with selective bottom-up approximations using sampled supplier revenues, channel checks, and price per unit times volume for common packs, and then adjusted for outliers where needed.
Key inputs in the model include wine production volumes, export and import patterns for packaged wine, the mix of packaging formats (for example, bottles versus bag-in-box and cans), closure penetration by category, and average selling price ranges by material and pack size. Where ASPs varied widely, we used a weighted pricing approach by region and format so one premium segment does not over-pull the full market value. For forecasting, we ran scenario analysis because price and mix changes (lightweighting, sustainability shifts, and premiumization) tend to move differently from base wine volumes. When bottom-up signals were missing for smaller formats or when local suppliers were fragmented, we applied conservative gap fills using adjacent regions and validated those assumptions through interviews before including them.
Data Validation & Update Cycle
Checks are run at multiple levels so the market totals align with independent signals, including wine output trends, packaging material throughput indicators, and changes in trade direction. If there are large variances at the region or format level, those areas are reviewed, and assumptions are revisited until the drivers match what respondents report in contracting and procurement.
Before sign-off, the work goes through a second analyst review focused on unit consistency, currency conversion, and whether price movements are being double-counted. The report is refreshed annually, with interim updates when there are material shifts such as major regulatory changes, sudden energy-cost swings, or large packaging mix movements. Right before delivery, a final pass is done so the latest available view is reflected in the published estimate.
Mordor Intelligence's Wine Packaging Market Estimate Compared With Other Published Estimates
Published market sizes for wine packaging often differ because firms do not align on what counts as packaging, which years are treated as the base, and how price is converted into USD across regions. Differences also come from whether the estimate follows production-led demand or assumes faster shifts into alternative formats and premium packs.
In this study, the most common gap drivers were the timing of currency conversion, the way average selling prices are weighted by format and pack size, and how quickly assumptions are refreshed after energy and raw material changes. By updating the price deck and exchange-rate timing as part of the annual refresh and then re-checking it through supplier and buyer validation calls, Mordor Intelligence reduces overstated swings that can show up when older ASPs are carried forward.
Benchmark comparison
| Source | Market Size | Gaps in Research Methodology |
|---|---|---|
| Mordor Intelligence | USD 7.05 B (2026) | |
| Industry Research House A | USD 6.30 B (2025) | Uses an earlier base year and a longer forecast window, and it appears to treat pricing more as a broad material average, which can understate premium bottle and closure mixes in higher value regions. |
| Industry Research House B | USD 9.43 B (2025) | Includes a wider set of packaging components such as capsules in a more aggregated way and may apply higher blended ASPs, which can lift the total when format weighting and currency timing are not tightly aligned. |
The spread in the table is mainly explained by year selection and how pricing and scope are handled, rather than by a single demand indicator. When the scope is kept to clearly defined wine packaging components and the value build is tied back to format mix, volumes, and current pricing checks, the result is easier to reproduce and track over time.


Key Questions Answered in the Report
What is the current size of the wine packaging market?
The wine packaging market size was USD 7.05 billion in 2026 and is forecast to reach USD 8.14 billion by 2031.
Which material dominates global wine packaging?
Glass leads with 68.05% share, thanks to its proven preservation abilities and premium image.
Why are lightweight glass bottles gaining popularity?
They reduce CO₂ emissions by up to 40% while retaining brand aesthetics, aligning with strict EU sustainability rules.
Which packaging format is growing fastest?
Bag-in-box segment is expanding at a 5.95% CAGR, driven by portability and younger consumer appeal.
How are EU regulations shaping packaging choices?
The Packaging and Packaging Waste Regulation requires 100% recyclable solutions by 2030, pushing suppliers toward lighter, recyclable and recycled-content materials.
What role does direct-to-consumer shipping play in packaging design?
DtC growth prioritizes protective, recyclable and brand-focused shipping formats that perform both in transit and at unboxing.
Page last updated on:


 Your data is secure and never sold or shared.


