Web 3.0 Blockchain Market Size and Share
Market Overview
| Study Period | 2020 - 2031 |
|---|---|
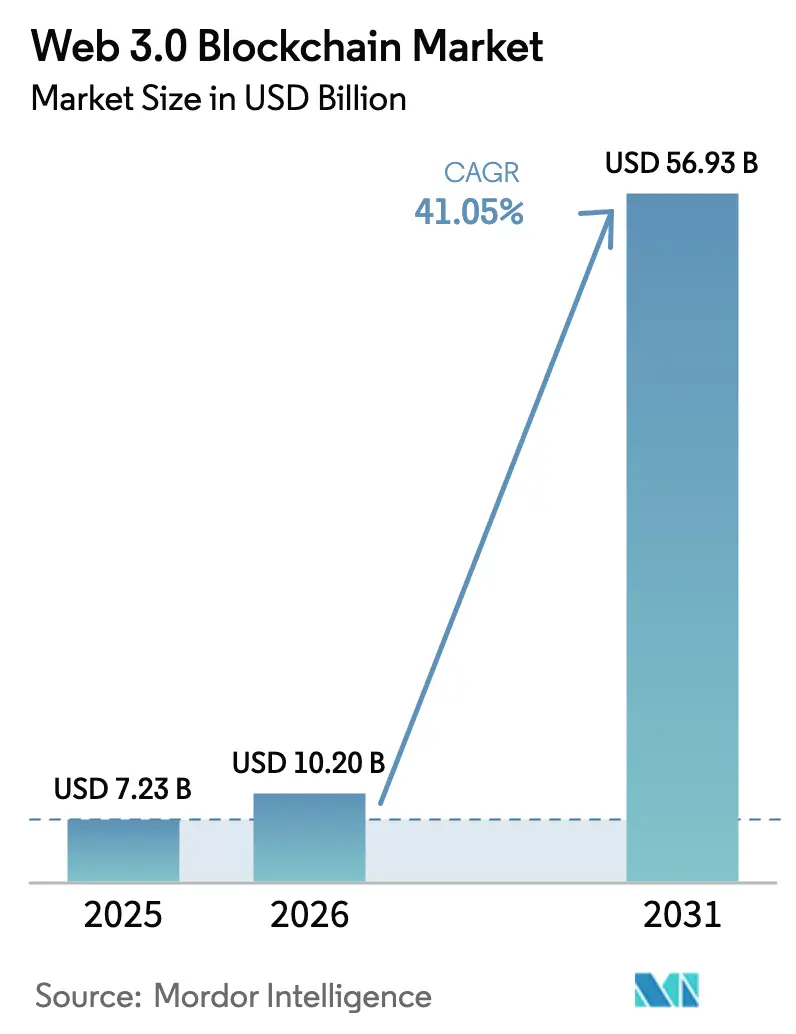
| Market Size (2026) | USD 10.2 Billion |
| Market Size (2031) | USD 56.93 Billion |
| Growth Rate (2026 - 2031) | 41.05% CAGR |
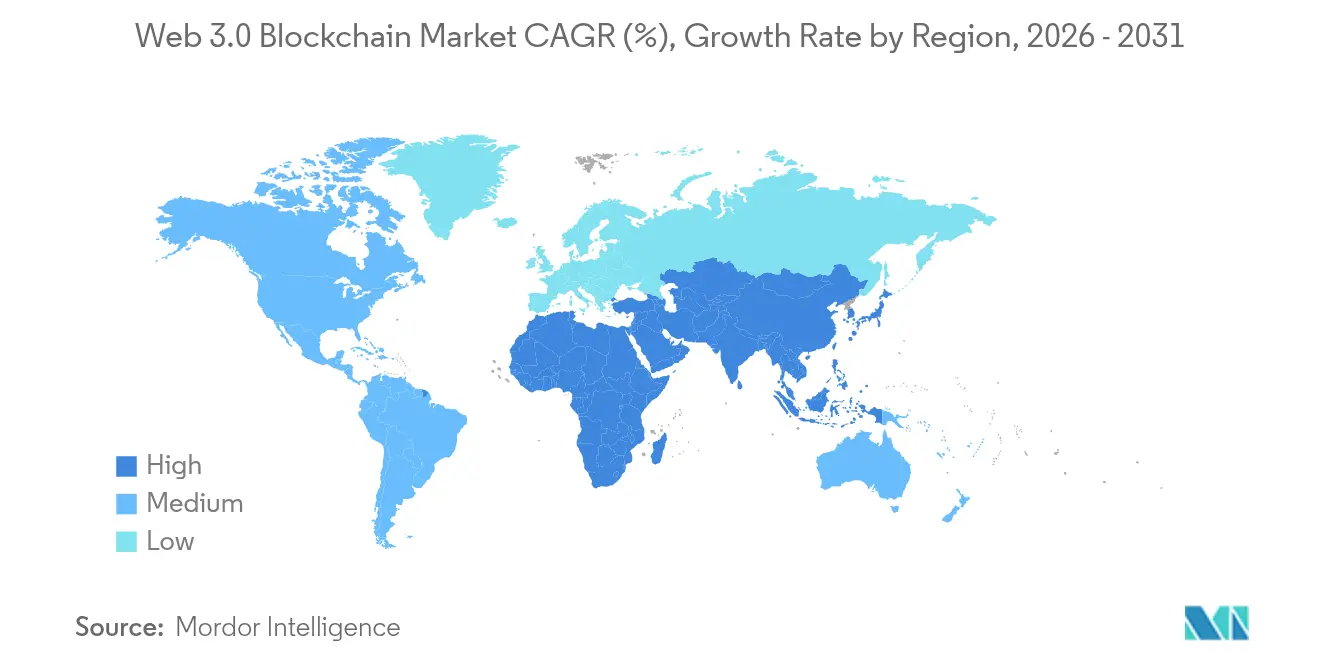
| Fastest Growing Market | Asia Pacific |
| Largest Market | North America |
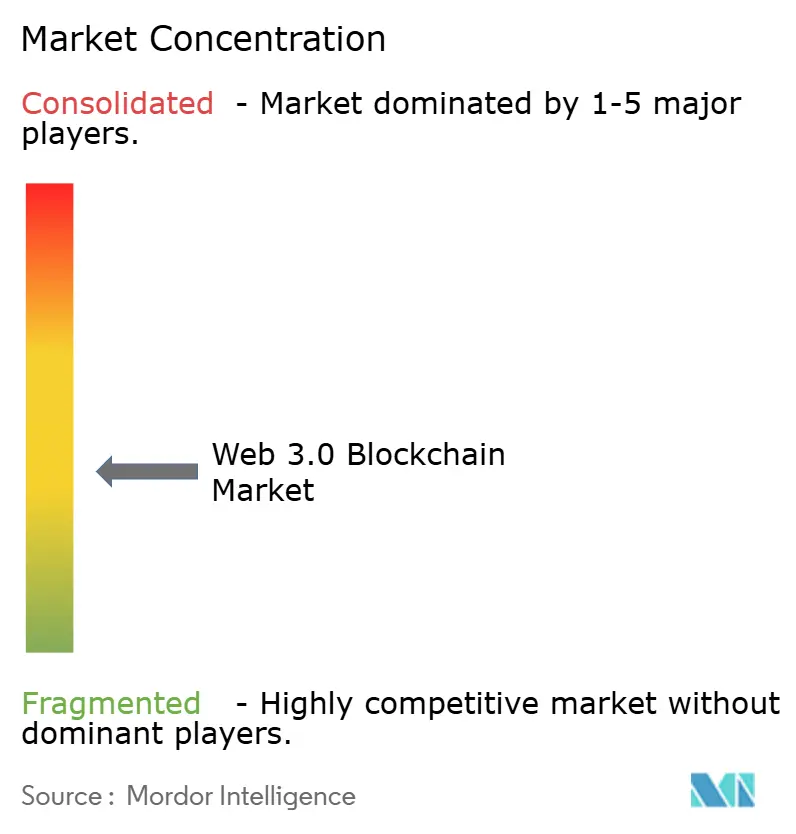
| Market Concentration | Medium |
Major Players *Disclaimer: Major Players sorted in no particular order Image © Mordor Intelligence. Reuse requires attribution under CC BY 4.0. | |
Web 3.0 Blockchain Market Analysis by Mordor Intelligence
Web 3.0 Blockchain Market size in 2026 is estimated at USD 10.2 billion, growing from 2025 value of USD 7.23 billion with 2031 projections showing USD 56.93 billion, growing at 41.05% CAGR over 2026-2031.
This trajectory is rooted in the migration from centralized Web 2.0 architectures to decentralized models that allow verifiable ownership of data and digital assets. Regulatory clarity around stablecoins, soaring institutional interest in decentralized finance (DeFi), and the tokenization of real-world and AI compute assets are reinforcing the appeal of decentralized rails. Large payment networks are entering the ecosystem; Stripe’s USD 1.1 billion acquisition of stable-coin platform Bridge underscores the drive to incorporate programmable money into mainstream financial flows. ESG-driven demand for supply-chain provenance, alongside energy-efficient proof-of-stake protocols, is guiding enterprises toward blockchain-based audit trails. Consistent venture funding has also sustained technology innovation and ecosystem expansion.
Key Report Takeaways
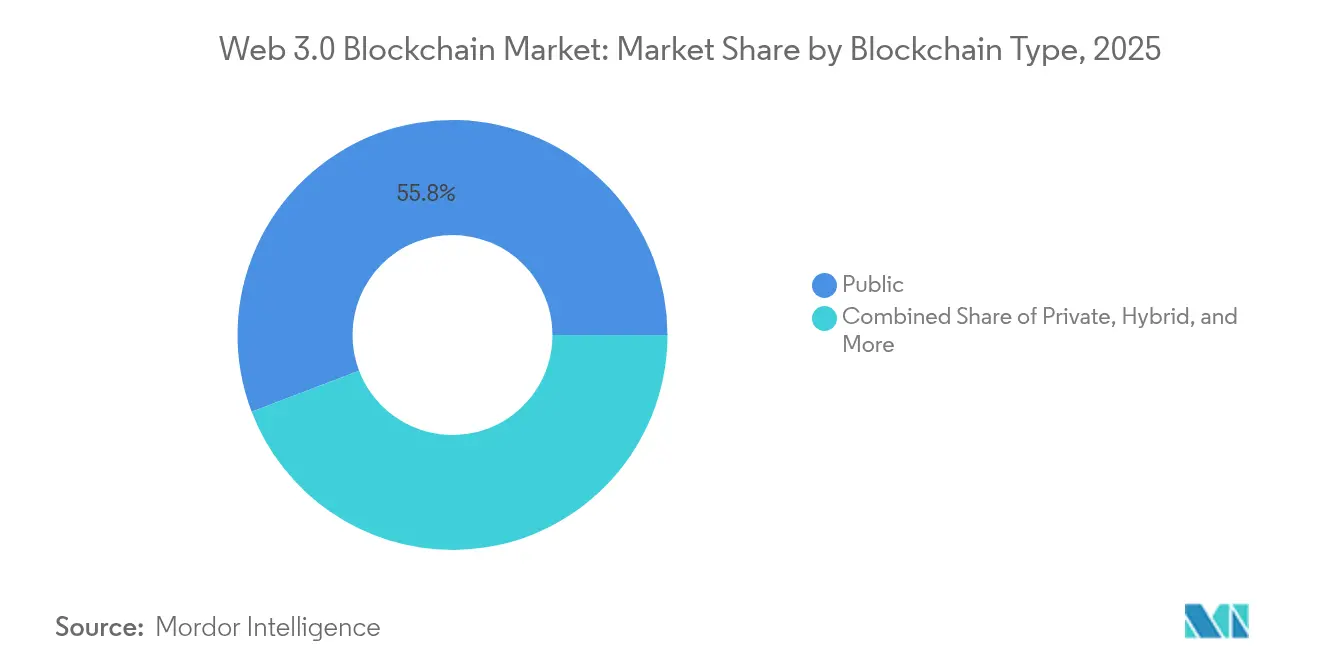
- By blockchain type, public networks led with 55.80% of Web 3.0 blockchain market share in 2025; consortium blockchains are set to grow at a 64.9% CAGR through 2031.
- By application, decentralized finance held 37.20% revenue in 2025, while gaming and metaverse projects the fastest 62.8% CAGR to 2031.
- By end-user industry, BFSI captured 40.90% of Web 3.0 blockchain market size in 2025; retail and e-commerce is poised for a 51.3% CAGR through 2031.
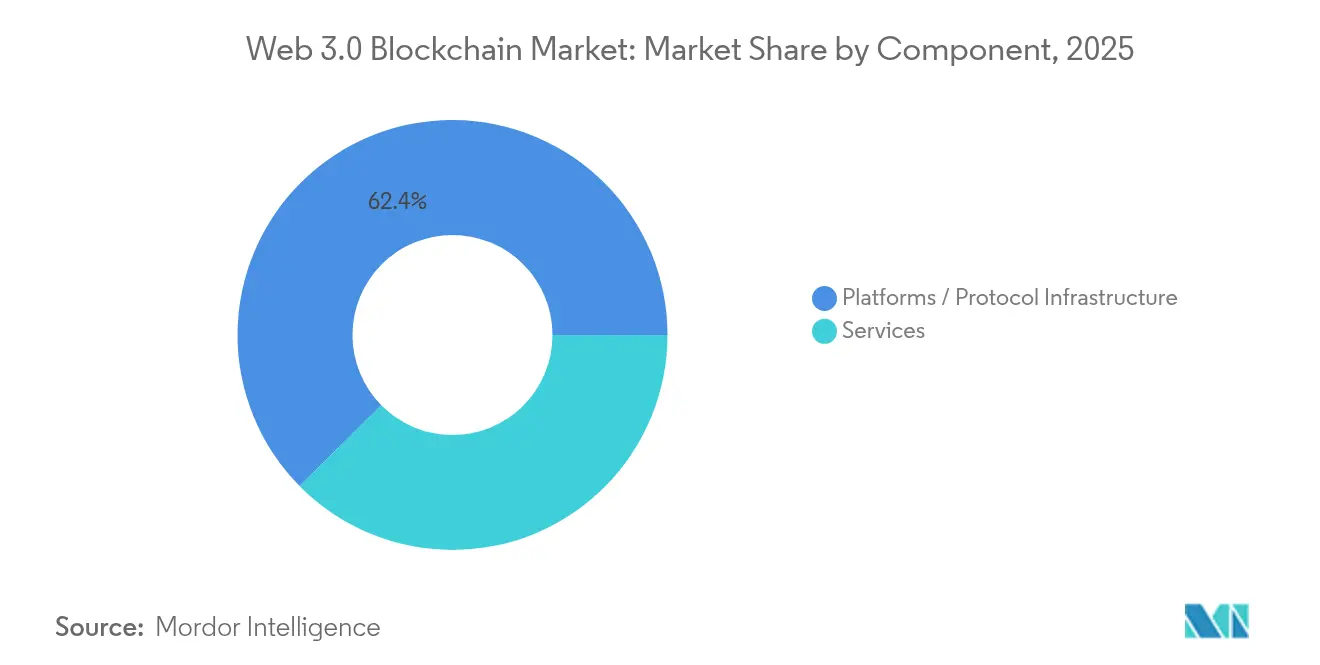
- By component, platform/protocol infrastructure commanded 62.40% share of the Web 3.0 blockchain market size in 2025; services will expand at 55.6% CAGR to 2031.
- By enterprise size, large companies held 60.10% share in 2025, whereas SMEs are forecast to post 52.2% CAGR through 2031.
- By geography, North America accounted for 45.20% Web 3.0 blockchain market share in 2025; the Asia-Pacific region is expected to rise at a 40.9% CAGR to 2031.
Note: Market size and forecast figures in this report are generated using Mordor Intelligence’s proprietary estimation framework, updated with the latest available data and insights as of 2026.
Global Web 3.0 Blockchain Market Trends and Insights
Drivers Impact Analysis*
| Driver | (~) % Impact on CAGR Forecast | Geographic Relevance | Impact Timeline |
|---|---|---|---|
| Rising institutional deployment of DeFi rails | +8.2% | North America, EU | Medium term (2-4 years) |
| Enterprise push for supply-chain provenance and auditability | +6.7% | EU, Asia-Pacific manufacturing hubs | Long term (≥ 4 years) |
| Regulatory clarity for stablecoins in G20 economies | +9.1% | North America, EU, Asia-Pacific | Short term (≤ 2 years) |
| Acceleration of Web3 gaming and metaverse token economies | +5.8% | Asia-Pacific, spill-over to North America | Medium term (2-4 years) |
| Tokenization of AI compute resources | +4.3% | North America, global early adopters | Medium term (2-4 years) |
| Growth of DePIN projects | +7.1% | Global, pronounced in Asia-Pacific | Long term (≥ 4 years) |
| Source: Mordor Intelligence | |||
Rising institutional deployment of DeFi rails
Traditional banks now settle tokenized deposits and securities on public chains to slash reconciliation cycles and enhance transparency. JPMorgan’s first public-chain transaction on Chainlink’s Cross-Chain Interoperability Protocol (CCIP) with Ondo Finance signals the wider shift of treasury desks toward compliant DeFi liquidity. The DTCC’s USD 50 million purchase of Securrency reflects an intention to embed programmable compliance into post-trade workflows. Mastercard’s Multi-Token Network aligns with JPMorgan’s Kinexys to streamline B2B payouts, showcasing how payment rails morph into multichain settlement layers. Growing liquidity, transparent audit trails, and automated compliance rules are pushing institutions to demand high-performance blockchain infrastructure. This momentum will continue to elevate the Web 3.0 blockchain market as custodians and asset managers standardize tokenized processes.
Enterprise push for supply-chain provenance and auditability
Multinationals adopt blockchain to satisfy mandatory ESG disclosures and product authenticity checks. Immutable ledgers give end-to-end visibility into raw-material sourcing, directly supporting circular-economy targets. Smart contracts automate evidence collection for environmental audits, trimming manual inspection costs and reducing fraud. Early pilots in European automotive and Asia-Pacific electronics have demonstrated real-time provenance dashboards that cut recall times and counterfeit exposure. As compliance standards tighten, enterprises are embedding consortium blockchains into manufacturing workflows, which will amplify platform demand across the Web 3.0 blockchain market.
Regulatory clarity for stablecoins in major G20 economies
Hong Kong’s forthcoming licensing regime, the EU’s Markets in Crypto-Assets regulation, and Singapore’s proliferating digital-payment-token licenses have removed key compliance bottlenecks. Harmonized oversight allows financial firms to hold and transact fiat-backed tokens, unlocking cross-border settlement and on-chain collateral applications. The standardization also gives corporates confidence to integrate programmable money into enterprise resource-planning systems. Accelerated onboarding of regulated stablecoins is therefore the single largest catalyst for near-term expansion of the Web 3.0 blockchain market.
Acceleration of Web3 gaming and metaverse token economies
Game publishers leverage non-fungible tokens (NFTs) to offer player-owned assets and secondary trading revenue. FIFA’s collaboration with Mythical Games for FIFA Rivals exemplifies sports franchises monetizing fan engagement via blockchain collectibles [1]FIFA, “FIFA Partners with Mythical Games for FIFA Rivals,” fifa.com. Maplestory’s migration to Avalanche lets users craft in-game items with verifiable scarcity, blending user-generated content with play-to-earn mechanics. The Sandbox raised USD 20 million to fuel creator economies, signalling investor faith in open metaverse models [3]Animoca Brands, “The Sandbox Raises USD 20 Million,” animocabrands.com. Rising active-wallet counts and micro-transaction throughput are expanding high-frequency on-chain activity, underpinning demand for low-latency blockchains across the Web 3.0 blockchain market.
Restraints Impact Analysis*
| Restraint | (~) % Impact on CAGR Forecast | Geographic Relevance | Impact Timeline |
|---|---|---|---|
| Cross-chain interoperability and scalability gaps | -3.8% | Worldwide, multi-chain deployments | Medium term (2-4 years) |
| Fragmented and fast-shifting global regulatory regimes | -4.2% | Emerging markets in particular | Short term (≤ 2 years) |
| Web3 talent drain to foundation-model AI labs | -2.1% | North America, EU | Short term (≤ 2 years) |
| Power-intensive on-chain AI inference and energy caps | -1.9% | Global, regulatory spotlight in EU | Long term (≥ 4 years) |
| Source: Mordor Intelligence | |||
Cross-chain interoperability and scalability gaps
Enterprises operating multi-network strategies confront liquidity siloes and complex key-management overhead. While Polkadot’s XCM and Cosmos’s IBC offer message-passing bridges, each demands distinct security assumptions and significant developer expertise [2]Polkadot Foundation, “XCM V3 Documentation,” polkadot.network. Microsoft’s tie-up with Axelar seeks to provide API-level abstractions, yet operational complexity remains high. Until seamless generalized communication standards mature, large corporates will hesitate to move mission-critical workflows on-chain, thereby moderating Web 3.0 blockchain market growth.
Fragmented and fast-shifting global regulatory regimes
Divergent rules from Latin America’s disparate stances to Qatar’s layered frameworks force multinational blockchain operators to maintain jurisdiction-specific compliance stacks. Continuous policy churn compels legal teams to monitor bills and adapt smart-contract parameters, inflating operating costs. Uncertainty over classification of tokens as commodities or securities chills capital formation in emerging economies. Consequently, inconsistent oversight could defer deployments and dampen near-term gains for the Web 3.0 blockchain market.
*Our forecasts treat driver/restraint impacts as directional, not additive. The impact forecasts reflect baseline growth, mix effects, and variable interactions.
Segment Analysis
By Blockchain Type: Consortium Networks Drive Enterprise Adoption
Public blockchains contributed 55.80% of Web 3.0 blockchain market share in 2025, propelled by open-source governance and robust developer ecosystems. Their transparent architecture undergirds DeFi, NFT, and gaming activity, fuelling network effects that attract liquidity. Yet, as regulated entities seek permission controls, consortium designs are registering a 64.9% CAGR through 2031, the highest within the segment. These networks balance shared ledger benefits with defined membership, identity management, and compliance gates, aligning with corporate risk frameworks.
The consortium surge signals a pragmatic middle path for enterprises that require auditable yet private environments. Vertical-specific consortia in trade finance, shipping, and pharmaceuticals are pooling resources to diffuse infrastructure costs. Smart-contract templates standardize workflows, speeding onboarding times and minimizing custom code. Such collaboration is reinforcing demand for unified governance tooling and node-as-a-service offerings, consolidating the Web 3.0 blockchain market.


By Application/Use Case: DePIN Emerges as Highest-Growth Segment
Gaming and metaverse applications represented the most dynamic slice of overall spending in 2025 and are forecast to grow at a 62.8% CAGR to 2031, the fastest among all use cases. Decentralized finance still accounts for 37.20% of 2025 revenues and remains the liquidity backbone of the Web 3.0 blockchain market, yet engagement-led micro-transactions in play-to-earn titles are now scaling daily on-chain activity. High-throughput public networks and side-chains that feature sub-second confirmation times give developers the performance headroom needed for real-time game logic, driving sustained infrastructure demand.
Metaverse ecosystems extend blockchain utility beyond financial primitives by enabling verifiable digital ownership of avatars, land parcels, and in-game assets. NFTs underpin secondary trading and creator-economy royalties, while token-gated access to virtual events deepens user retention. The gaming and metaverse wave therefore acts as a high-frequency stress-test for low-latency consensus mechanisms, accelerating roadmap investments in sharding, zero-knowledge rollups, and object-centric storage. Combined, these entertainment-driven workloads are set to lift the Web 3.0 blockchain market size for application-layer services and middleware, reshaping how value is generated and exchanged across interactive media platforms.
By End-user Industry: Retail Acceleration Challenges BFSI Dominance
Financial institutions account for 40.90% of Web 3.0 blockchain market size in 2025, relying on the technology for real-time settlement, trade-finance automation, and KYC compliance. Permissioned ledgers facilitate high-value transfers while on-chain analytics curb illicit financing risks. Nonetheless, retail and e-commerce players are tracking a 51.3% CAGR to 2031 as consumer appetite grows for provenance-verified products and frictionless cross-border checkouts. Token-gated loyalty programs are also converting engagement into measurable lifetime value.
Healthcare, logistics, and public-sector agencies are integrating blockchain for data integrity and verifiable credentialing. The breadth of adoption signals that trust-minimized data exchange is evolving into a horizontal capability. Vendors that offer configurable policy engines and sector-specific APIs are well positioned to capture incremental wallets across the Web 3.0 blockchain market.
By Component: Services Growth Reflects Implementation Complexity
Platforms and core protocols delivered 62.40% of revenue in 2025, anchoring critical consensus, smart-contract, and storage layers. High uptime, audited codebases, and interoperability frameworks remain primary selection criteria for regulated clients. Meanwhile, services—covering consulting, systems integration, node management, and compliance tooling—are accelerating at 55.6% CAGR. Enterprises require end-to-end guidance to map process flows, architect hybrid infrastructures, and align smart contracts with jurisdictional statutes.
Growth in managed-service engagements demonstrates that solution stickiness now hinges on holistic value delivery rather than raw throughput. Vendors combining multi-chain orchestration, audit dashboards, and 24/7 support are addressing perceived skill gaps, thereby expanding total addressable spend within the Web 3.0 blockchain market.
By Enterprise Size: SME Adoption Accelerates Through Simplified Solutions
Large corporations captured 60.10% of spending in 2025 due to deep pockets, in-house talent, and regulatory teams capable of shepherding multiyear roll-outs. They pursue bespoke integrations that embed blockchain directly into treasury, ERP, and supplier-onboarding stacks. Conversely, SMEs are forecast to post 52.2% CAGR on the back of blockchain-as-a-service models, turnkey wallets, and low-code smart-contract templates.
Cloud-native offerings abstract node operations, letting smaller firms tap tokenized loyalty programs and supply-chain visibility without capital-intensive infrastructure. Partnerships between hyperscale clouds and Web3 gateways are shrinking deployment cycles, catalyzing grassroots participation and widening the Web 3.0 blockchain market funnel.
Geography Analysis
North America held 45.20% Web 3.0 blockchain market share in 2025, supported by mature capital markets, regulated stablecoin issuers, and a dense cluster of technology talent. Leading banks such as JPMorgan and custodians like BNY Mellon integrate tokenized rails into core banking systems, encouraging downstream fintech experimentation. Grant programs and regulatory sandboxes across select US states provide compliant launch-pads for start-ups.
Europe capitalizes on the EU MiCA framework that harmonizes token issuance and service-provider licensing. Major economies—Germany, France, and Italy—pilot national identity credentials and green-bond tokenization on permissioned ledgers. Energy-efficiency mandates drive interest in proof-of-stake options, influencing vendor selection across the Web 3.0 blockchain market. The UK readies bespoke crypto-asset regulations, aiming to balance innovation with consumer protection.
Asia-Pacific, advancing at 40.9% CAGR, benefits from proactive regimes in Singapore, Hong Kong, and Japan that issue token-payment licenses and tax incentives. South Korea and Hong Kong subsidize Web3 gaming studios, fueling metaverse adoption. Australia's Treasury consults on token-mapping frameworks, while India and Indonesia experiment with CBDCs that could dovetail with public chains. Regional retail participation and super-app integration accelerate wallet downloads, underpinning outsized growth prospects for the Web 3.0 blockchain market.

Competitive Landscape
The Web 3.0 blockchain market is moderately fragmented. Open-source public-chain foundations—Ethereum, Solana, Polkadot—compete on throughput, composability, and developer incentives. Enterprise offerings from IBM, Microsoft, and SAP interact with permissioned frameworks such as Hyperledger Fabric, aiming to serve regulated industries. Strategic alliances have intensified: Microsoft’s collaboration with Axelar delivers cross-chain data routing, while Stripe’s series of wallet and stablecoin acquisitions embeds Web3 rails into mainstream payments.
Investment funds remain bullish; Paradigm’s USD 850 million raise and Pantera’s planned USD 1 billion fund underline confidence in multi-chain futures. Niche challengers focus on DePIN and AI-blockchain convergence. Zero Gravity Labs attracted USD 290 million to develop decentralized AI operating systems, highlighting a pivot toward compute tokenization. Vendor differentiation is coalescing around efficient consensus, privacy-preserving computation, and regulatory-ready identity modules.
Patent activity in interoperability and homomorphic encryption underscores defensive positioning. Meanwhile, sector-specific integrators targeting healthcare, mobility, and energy are carving out vertical strongholds. Continuous standardization efforts and acquisitions hint at gradual consolidation, yet the overall Web 3.0 blockchain market remains dynamic, with innovation cycles resetting competitive hierarchies every two to three years.
Web 3.0 Blockchain Industry Leaders
Polkadot Network (Web3 Foundation)
Chainlink Labs Ltd.
Polygon Labs Ltd.
Filecoin (Protocol Labs Inc.)
ConsenSys Software Inc.
- *Disclaimer: Major Players sorted in no particular order

Recent Industry Developments
- June 2025: Stripe acquired crypto-wallet start-up Privy to deepen Web3 capabilities, adding to its USD 1.1 billion Bridge buyout.
- June 2025: ConsenSys purchased Web3Auth, enhancing MetaMask with seed-phrase-free login and upcoming Bitcoin support.
- April 2025: Blocksquare and Vera Capital committed to tokenize USD 1 billion in United States real estate.
- March 2025: Sony’s Soneium blockchain integrated mini-apps into the LINE platform, aiming at 200 million users.


Research Methodology Framework and Report Scope
Market Definitions and Key Coverage
Our study defines the Web3 blockchain market as the total spending accruing from networks that record, validate, and automate data or value transfers through distributed ledgers, permissioned or permissionless smart contracts, and native digital assets across public, private, hybrid, and consortium architectures. Revenues include protocol infrastructure, node-running platforms, integration tooling, and implementation services that enable decentralized finance (DeFi), gaming, identity, data storage, and other Web3 applications.
Scope Exclusion: pure cryptocurrency exchange trading fees and legacy cloud hosting services are left outside our boundary because they reflect secondary financial activity rather than core Web3 infrastructure.
Segmentation Overview
- By Blockchain Type
- Public
- Private
- Hybrid
- Consortium
- By Application / Use Case
- Decentralised Finance (DeFi)
- Gaming and Metaverse
- Data and Storage
- Identity and Credentials
- Payments and Remittances
- Other Applications
- By End-user Industry
- BFSI
- Retail and e-Commerce
- Media and Entertainment
- Healthcare and Life Sciences
- Information Technology and Telecom
- Government and Public Sector
- Logistics and Supply-chain
- Other Industries
- By Component
- Platforms / Protocol Infrastructure
- Services (Consulting, Integration, Support)
- By Enterprise Size
- Large Enterprises
- Small and Medium Enterprises
- By Geography
- North America
- United States
- Canada
- Mexico
- South America
- Brazil
- Argentina
- Rest of South America
- Europe
- Germany
- United Kingdom
- France
- Italy
- Spain
- Russia
- Rest of Europe
- Asia-Pacific
- China
- Japan
- India
- South Korea
- Australia and New Zealand
- Rest of Asia-Pacific
- Middle East and Africa
- Middle East
- Saudi Arabia
- United Arab Emirates
- Turkey
- Rest of Middle East
- Africa
- South Africa
- Nigeria
- Egypt
- Rest of Africa
- Middle East
- North America
Detailed Research Methodology and Data Validation
Primary Research
Mordor analysts scheduled structured calls with Web3 middleware vendors, DeFi protocol contributors, CIOs at BFSI and retail firms, and regional blockchain regulators across North America, Europe, and Asia-Pacific. Interviews clarified enterprise adoption timelines, validator incentive dynamics, and likely policy inflection points, while online surveys captured planned budget shifts among small and medium enterprises.
Desk Research
We extracted foundational data from open governmental statistics on ICT investment (OECD, U.S. BEA), regional blockchain association fact sheets, WIPO patent trends on smart contract filings, and customs shipment codes for specialized mining and validation hardware. Supplemental inputs came from company 10-Ks, investor decks, and reputable news archives accessed via Dow Jones Factiva. Where protocol token economics were critical, aggregated on-chain analytics from publicly available blockchain explorers were reviewed. These sources, together with D&B Hoovers financials for key platform providers, offered baseline volumes, pricing cues, and historical growth signals. The list is illustrative, not exhaustive; many other references informed data checks and clarification.
Market-Sizing & Forecasting
A top-down construct links national ICT outlays and venture funding pools to Web3 penetration rates, which are then validated through bottom-up checks such as sampled average protocol fees multiplied by active addresses and hardware shipments multiplied by ASPs. Key variables like daily active wallet counts, GitHub repository commits, Layer 2 transaction throughput, regulatory sandbox approvals, and protocol treasury inflows drive annual estimates. Five-year projections apply multivariate regression blended with scenario analysis, and coefficients are refined with forward-looking guidance obtained during primary research. Gaps in granular vendor data are bridged by conservative interpolation anchored to observable on-chain growth ceilings.
Data Validation & Update Cycle
Outputs pass a two-step analyst peer review, variance flags trigger re-contacts with domain experts, and macro currency conversions are benchmarked against IMF rates. Reports refresh annually, with interim updates issued when material network upgrades, funding spikes, or major regulations emerge.
Why Mordor's Web 3.0 Blockchain Baseline Commands Reliability
Published Web3 values often diverge because firms vary in what they count, how often they refresh models, and the indicators they trust. By centering estimates on verifiable on-chain activity and cross-referenced spending intents, Mordor delivers a figure that decision-makers can readily audit.
Key gap drivers include differing treatment of ancillary exchange revenues, omission of enterprise private chains, contrasting wallet growth curves, and less frequent model refreshes used by some publishers.
Benchmark comparison
| Market Size | Anonymized source | Primary gap driver |
|---|---|---|
| USD 7.23 B (2025) | Mordor Intelligence | |
| USD 7.00 B (2025) | Global Consultancy A | Excludes services beyond token issuance; limited Asia coverage; biennial updates |
| USD 3.03 B (2024) | Trade Journal B | Counts only core protocols, omits DeFi and enterprise chains; conservative adoption curve |
| USD 6.41 B (2025) | Industry Association C | Relies on self-reported vendor sales and nominal FX, with overlap across segments |
Taken together, the comparison shows that Mordor's disciplined scope selection, variable transparency, and yearly refresh cycle provide the most balanced and reproducible baseline for Web3 strategy planning.


Key Questions Answered in the Report
What is the size of the Web 3.0 blockchain market in 2026 and what value is forecast for 2031?
The market is USD 10.2 billion in 2026 and is projected to reach USD 56.93 billion by 2031 with a 41.05% CAGR.
Which blockchain type is expected to grow the fastest through 2031?
Consortium blockchains hold the highest growth outlook with a 64.9% CAGR to 2031.
How rapidly is the Asia-Pacific Web 3.0 blockchain market expanding?
Asia-Pacific is set to grow at a 40.9% CAGR from 2026 to 2031, the quickest regional pace worldwide.
Why are regulated stablecoins critical for enterprise blockchain adoption?
Clear rules let institutions hold and transfer fiat-backed tokens, which unlocks compliant cross-border payments and on-chain treasury uses.
What main challenge slows large multi-chain blockchain deployments?
Limited interoperability creates liquidity siloes and high technical overhead, which discourages enterprises from adopting multi-network strategies.
Page last updated on:


