
Waste-to-Energy (WtE) Plant Feedstock Market Size and Share
Market Overview
| Study Period | 2021 - 2031 |
|---|---|
| Market Size (2026) | USD 21.87 Billion |
| Market Size (2031) | USD 30.91 Billion |
| Growth Rate (2026 - 2031) | 7.25 % |
| Fastest Growing Market | Asia-Pacific |
| Largest Market | Asia-Pacific |
| Market Concentration | Medium |
Major Players *Disclaimer: Major Players sorted in no particular order Image © Mordor Intelligence. Reuse requires attribution under CC BY 4.0. | |
Waste-to-Energy (WtE) Plant Feedstock Market Analysis by Mordor Intelligence
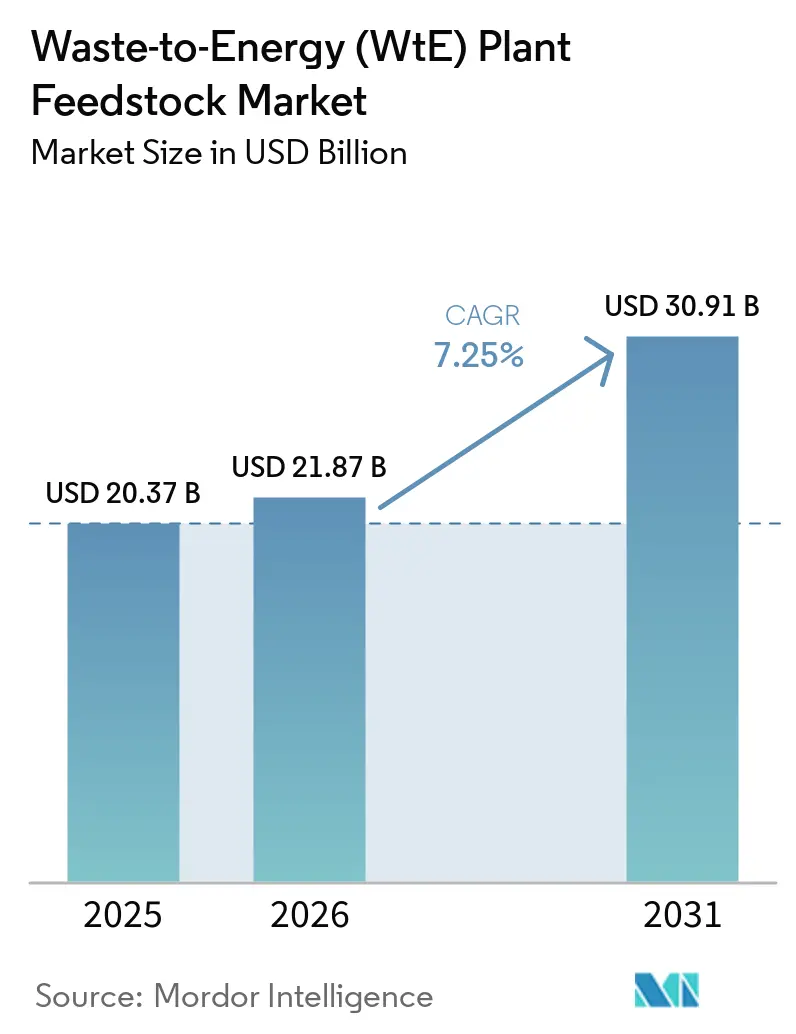
The Waste-to-Energy Plant Feedstock Market size is expected to grow from USD 20.37 billion in 2025 to USD 21.87 billion in 2026 and is forecast to reach USD 30.91 billion by 2031 at 7.25% CAGR over 2026-2031. The waste-to-energy plant feedstock market is supported by landfill-diversion rules, source separation requirements, and public programs that make residual waste management a formal municipal responsibility. California's proposed AB-70 would include pipeline biomethane made from diverted organic waste within state regulations by January 2027, while Florida's 2025 program authorizes assistance and incentives for municipal solid-waste-to-energy facilities. The waste-to-energy plant feedstock market also benefits from demand for renewable gas and low-carbon fuel, especially where long-term offtake contracts can support project financing. Feedstock quality, capital requirements, emissions costs, and permitting timelines continue to shape project selection and operating returns. Competition increasingly favors operators that can secure municipal supply agreements, control feedstock quality, and combine treatment with power, heat, or renewable-gas sales.
Key Report Takeaways
- By feedstock type, Municipal Solid Waste held 68.3% of the market share in 2025, while Agricultural & Biomass Residue is projected to grow at a 9.8% CAGR through 2031.
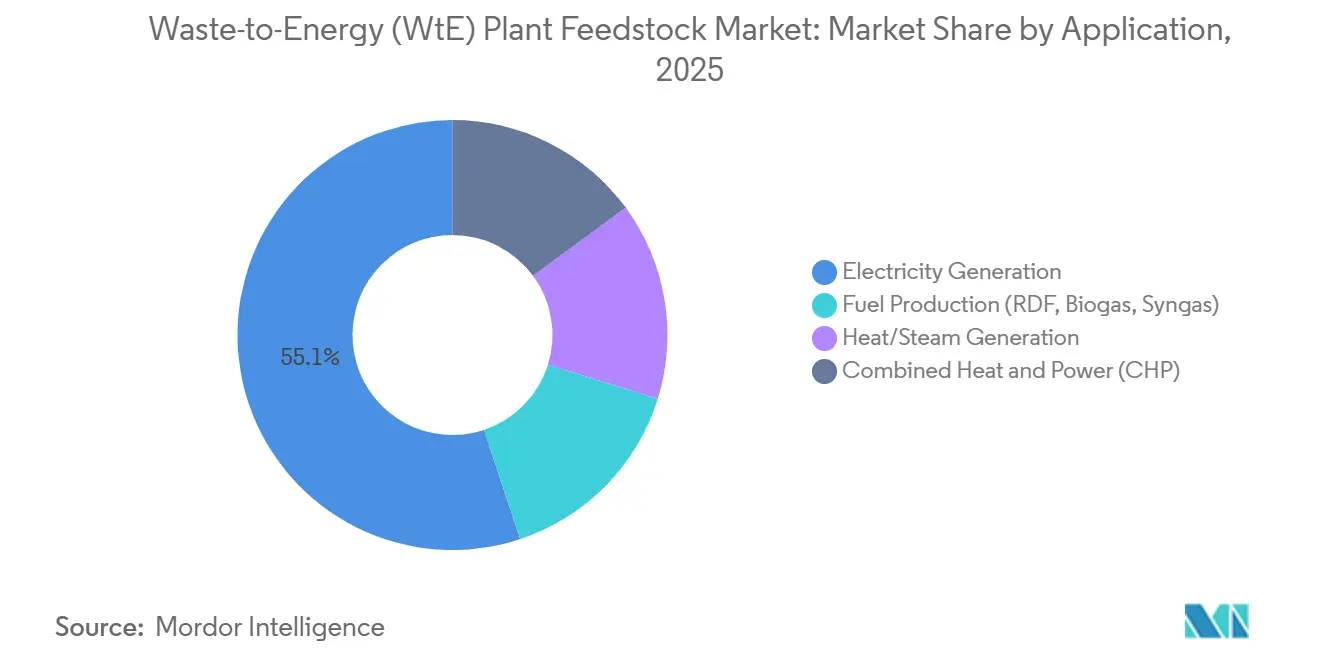
- By application, Electricity Generation accounted for 55.1% of the market share in 2025, while Fuel Production is forecast to grow at an 8.9% CAGR through 2031.
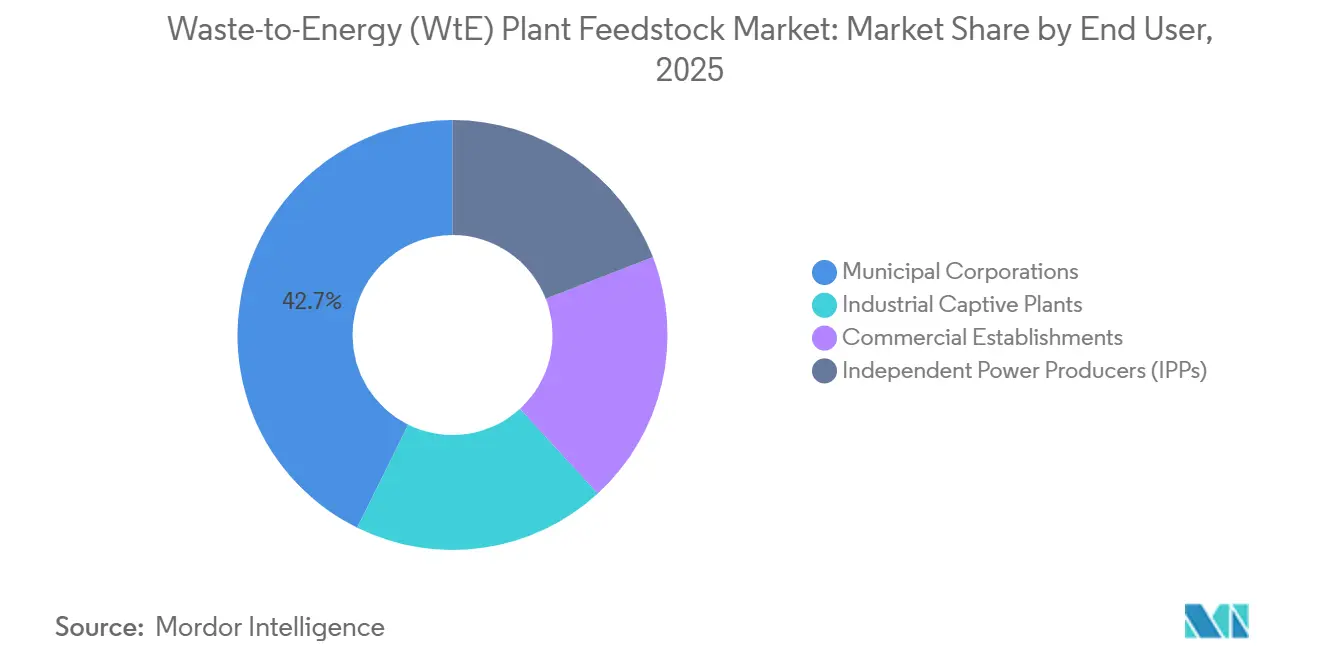
- By end user, Municipal Corporations held 42.7% of the market share in 2025, while Industrial Captive Plants are projected to expand at a 7.5% CAGR through 2031.
- By geography, Asia-Pacific accounted for 39.7% of the market share in 2025 and is forecast to grow at an 8.1% CAGR through 2031.
Note: Market size and forecast figures in this report are generated using Mordor Intelligence’s proprietary estimation framework, updated with the latest available data and insights as of January 2026.
Market Trends and Insights
Drivers Impact Analysis of Waste-to-Energy (WtE) Plant Feedstock Market*
| Driver | (~) % Impact on CAGR Forecast | Geographic Relevance | Impact Timeline |
|---|---|---|---|
| Landfill-Diversion Mandates and Municipal Capacity Gaps | +1.80% | Global; concentrated in EU, North America, and APAC core markets | Short term (≤ 2 years) |
| Public-Private Partnership Pipelines for Urban Residual Waste | +1.10% | APAC, MEA, South America | Medium term (2–4 years) |
| Renewable Gas and Bio-LNG Offtake Commitments | +0.90% | Nordic Europe, Italy, North America, Northeast Asia | Medium term (2–4 years) |
| Carbon-Credit and Circular-Economy Revenue Stacking | +0.80% | Global; premium potential in EU, India, Canada | Medium term (2–4 years) |
| Feedstock-Quality Stabilization Through AI Sorting and Digital Combustion Control | +0.70% | Global; early adoption in Japan, South Korea, Switzerland | Short to medium term |
| Heat-Offtake and District-Energy Integration | +0.50% | Northern and Central Europe, China | Long term (≥ 4 years) |
| Source: Mordor Intelligence | |||
Landfill-Diversion Mandates and Municipal Capacity Gaps
Landfill restrictions are making feedstock access a compliance matter for municipal authorities. The waste-to-energy plant feedstock market gains more predictable volumes when municipalities must separate organics or divert residual waste. California's AB-70 is advancing through the 2025-2026 session and would require regulations to include pipeline biomethane derived from diverted organic waste by January 2027[1]. Florida's 2025 statute permits grants and financial assistance for municipal solid-waste-to-energy projects, including infrastructure that supports waste aggregation[2]. New Jersey adopted food-waste recycling rules in August 2025 that require source separation from designated generators and channel eligible material to permitted facilities. Long-term gate-fee agreements can therefore provide operators with steadier revenue than projects exposed only to electricity prices.
Feedstock-Quality Stabilization Through AI Sorting and Digital Combustion Control
Stable calorific value improves power output, reduces equipment stress, and supports more reliable plant operation. A commercial trial of intelligent combustion control in Gyeonggi Province increased power generation by 3.09%, reduced carbon monoxide emissions by 60.72%, and lowered nitrogen oxide concentrations by 7.33% over 6 months. EBARA Environmental Plant has developed an image-recognition system that identifies unsuitable, hazardous, and oversized waste, and it reported 90% operatorless crane control[3]. Jaipur Robotics deployed computer vision at a Swiss waste bunker in 2024 to map calorific values and help operators blend materials before combustion[4]. Kanadevia presented a plant-trial method in 2025 that used sensor data to reduce the combustion area on the post-combustion grate by 60%. The waste-to-energy plant feedstock market is likely to place greater value on contracts that document quality and provide traceable feedstock characteristics.
Carbon-Credit and Circular-Economy Revenue Stacking
Waste projects can earn revenue from energy, gate fees, and verified environmental attributes when their emissions reductions are documented. This model is most relevant for organic waste streams that avoid landfill methane and for projects that can verify biogenic carbon outcomes. A Swiss operator reported 13,342 tonnes of cumulative avoided carbon dioxide by June 2025 and projected 70,000 certified tonnes annually as additional facilities enter service. Canada's Clean Fuel Regulations created a route for registered renewable natural gas volumes to receive credit value, making measured carbon intensity important to project returns. The waste-to-energy plant feedstock market can benefit when developers build monitoring and verification into project design rather than treating it as a later reporting task. The waste-to-energy plant feedstock market benefits when projects combine organics collection, anaerobic digestion, and renewable-gas production.
Public-Private Pipelines and Renewable Gas Offtake
Long-term fuel purchase agreements can provide the revenue certainty required to finance organic-waste conversion projects. Shell and Hapag-Lloyd signed a multiyear liquefied biomethane agreement in September 2025, with bunkering available at 22 Shell LNG locations. Vireo Energy's Lista Biogass plant in Norway is commissioning in 2026 and is designed to process 125,000 tonnes of organic feedstock annually, producing 90 GWh of bio-LNG for Gasum under a long-term offtake agreement. Kawasaki Kisen Kaisha began continuous procurement of ISCC-EU-certified bio-LNG for car carriers in April 2026. The waste-to-energy plant feedstock market is supported by demand for food waste, manure, sewage sludge, and other organic inputs. The waste-to-energy plant feedstock market also favors developers that can meet certification requirements and aggregate supply at scale.
Restraints Impact Analysis of Waste-to-Energy (WtE) Plant Feedstock Market*
| Restraint | (~) % Impact on CAGR Forecast | Geographic Relevance | Impact Timeline |
|---|---|---|---|
| High Upfront Capital and Financing Risk | -1.30% | Global; most acute in North America, Europe, and South/Southeast Asia | Short to medium term |
| Feedstock Contamination and Calorific-Value Volatility | -0.90% | Global; most acute in APAC and MEA where collection infrastructure is fragmented | Medium term (2–4 years) |
| Emissions Compliance and Retrofit Cost Escalation | -0.80% | Europe (EU ETS from 2028), North America (EPA NESHAP, state standards) | Medium to long term |
| Community Opposition and Permitting Delays | -0.50% | North America, Western Europe, urban APAC | Short to medium term |
| Source: Mordor Intelligence | |||
High Upfront Capital, Compliance Costs, and Permitting Risk
Large plants require substantial capital before they can generate revenue. A utility-scale facility processing 1 million tonnes annually can require capital expenditure of USD 1.2 billion under current North American and European cost conditions. Lenders commonly seek contracted revenues, proven technology, independent engineering review, and debt-service coverage above 1.50x before they provide long-tenor project finance. MVV secured financing for its Medworth facility in December 2025, which is intended to process up to 625,000 tonnes of residual waste annually once complete. Private operators also face carbon and emissions costs that may not be recoverable through existing contracts. Community concerns and slow permitting can add further time and cost, making established municipal agreements and public support important for the waste-to-energy plant feedstock market.
Feedstock Contamination and Calorific-Value Volatility
Moisture and chlorine content can reduce thermal performance and damage boilers over time. Mixed municipal waste can also contain materials that are unsuitable for combustion or that complicate emissions control. India's agricultural residue supply is large but seasonal, requiring multiple suppliers and longer procurement arrangements to improve availability. The India Ministry of Agriculture has allocated INR 5.4 billion for crop-residue management for 2026-2027, supporting collection and biomass use. China is also directing new solid-waste projects to address fly-ash disposal alongside construction approval, showing that handling requirements extend beyond waste intake. The waste-to-energy plant feedstock market depends on pretreatment, sorting, supplier controls, and contract terms that link price to material quality.
*Our forecasts treat driver/restraint impacts as directional, not additive. The impact forecasts reflect baseline growth, mix effects, and variable interactions.
Waste-to-Energy (WtE) Plant Feedstock Market Segment Analysis
By Feedstock Type:
Municipal Solid Waste Provides Scale While Biomass Residue Grows FasterMunicipal Solid Waste held 68.3% of the waste-to-energy plant feedstock market share in 2025. Its position reflects established collection systems and municipal concession agreements across Europe, North America, and East Asia. Those systems give operators better visibility on volume and gate-fee income. Agricultural & Biomass Residue is forecast to grow at a 9.8% CAGR through 2031. The segment is supported by efforts to capture value from crop residues, manure, and other farm-based materials. Scientific literature continues to identify residue conversion as a route to biofuels and bioproducts, although seasonal availability remains a practical constraint.
Industrial Waste supplies a secondary stream in manufacturing clusters, especially where producers seek material recovery and on-site energy use. Sewage sludge has become more relevant as wastewater facilities are expanding anaerobic digestion. Plastic and non-recyclable waste can improve energy content in thermal mixes, although its use must remain consistent with recycling and emissions requirements. Medical and biomedical waste commands higher processing fees because it requires specialized handling and compliance. Construction and demolition waste remains difficult to use because it can contain soil, concrete, and metals. A 2025 systematic review found growing use of artificial intelligence and machine learning in biomass-residue research, supporting better sorting and process modeling. The waste-to-energy plant feedstock industry is therefore moving toward more controlled blending and pretreatment rather than relying only on unprocessed mixed waste.
By Application:
Electricity Generation Leads While Fuel Production Expands FasterElectricity Generation accounted for 55.1% of the waste-to-energy plant feedstock market size in 2025. Grid-connected stoker-grate plants have long benefited from power-purchase agreements and established tariff structures. Heat and steam generation also support district-energy systems, especially in Northern and Central Europe. KVA Buchs reported higher district-heating revenue in 2025 despite lower electricity income, showing the value of a diversified output model. Fuel Production is forecast to grow at an 8.9% CAGR through 2031. The segment includes refuse-derived fuel pelletization, biogas upgrading, and syngas production.
Fuel projects favor feedstocks with high organic content, including food waste, sewage sludge, and agricultural residues. These materials differ from the high-calorific inputs traditionally sought by electricity-generation plants. As a result, growth in renewable gas can alter the mix of material available to thermal facilities that serve the same collection routes. Tosoh began commercial operation of a biomass power plant at Nanyo in May 2026 using white pellets, construction-waste wood chips, and refuse-derived pellets. The project shows how plants can combine several materials in one fuel system. The China State Council's 2026 action plan also encourages co-treatment of sewage sludge and industrial solid waste with municipal solid waste. The waste-to-energy plant feedstock market is thus expanding beyond standalone incineration toward multiple conversion routes.
By End User:
Municipal Corporations Lead While Industrial Captive Plants Grow FasterMunicipal Corporations held 42.7% of the market share in 2025. Publicly contracted concessions commonly provide waste volumes over long periods and may guarantee minimum tonnage. These arrangements support large facilities that require steady inflows and extended financing structures. India generates substantial municipal solid waste and has a limited share of its estimated waste-to-energy potential in operation, according to reporting on JFE Engineering's investment in Andhra Pradesh projects. Industrial Captive Plants are forecast to expand at a 7.5% CAGR through 2031. Cement, chemical, and food-processing sites can use these facilities to reduce purchased-energy exposure and process their own residues.
Commercial establishments offer a separate collection opportunity where food waste separation is required. New Jersey's 2025 rules direct designated commercial generators to separate food waste and send eligible material to certified recycling or energy facilities. Independent Power Producers can provide capital and asset-management capabilities where revenues are contracted. Encyclis agreed in 2026 to sell a 50% ownership interest in Dublin Waste to Energy to Universities Superannuation Scheme. Such transactions show investor interest in facilities with long-term gate-fee and heat-offtake income. Developers can widen the pool of available capital by reducing merchant electricity exposure. The waste-to-energy plant feedstock market supports project structures built around contracted feedstock and energy sales.
Geography Analysis
APAC Waste-to-Energy (WtE) Plant Feedstock Market
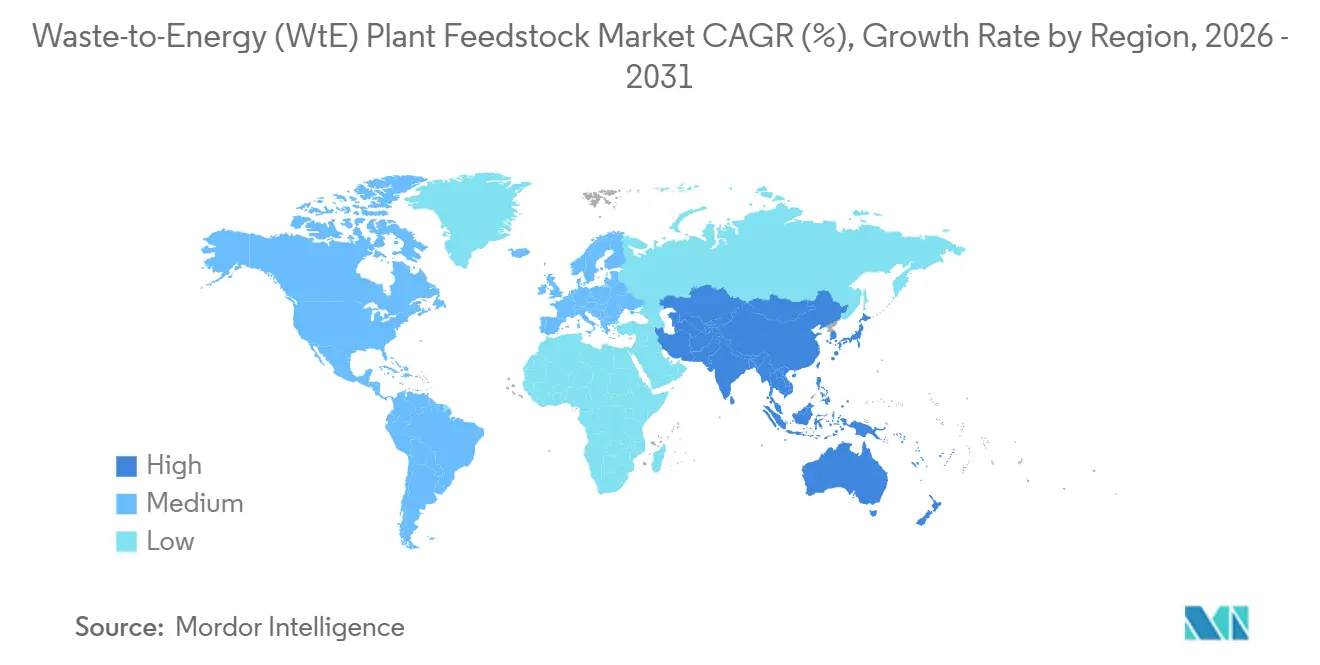
Asia-Pacific accounted for 39.7% of the waste-to-energy plant feedstock market size in 2025 and is forecast to grow at an 8.1% CAGR through 2031. China has a large installed base, but policy is shifting attention toward better operating quality and fly-ash management. The State Council's 2026 plan requires new projects to address fly-ash disposal along with construction approval. India offers growth potential through municipal waste and agricultural residue. The government allocated INR 5.4 billion for crop-residue management in 2026-2027. JFE Engineering invested JPY 750 million, equal to USD 5.2 million, for a 25% interest in 2 Andhra Pradesh projects in April 2026.
Eastern Europe Waste-to-Energy (WtE) Plant Feedstock Market
Europe held the second-largest regional position in 2025. The waste-to-energy plant feedstock market in Europe is shifting from broad capacity additions to asset optimization and selective development in Eastern Europe. European operators are also adapting to tighter carbon accounting and higher expectations for feedstock characterization. Poland, Romania, and the Czech Republic remain relevant because landfill rules support new waste-treatment capacity. Eversheds Sutherland reported that Polish waste-to-energy assets are attracting interest as long-term infrastructure assets. The waste-to-energy plant feedstock market in Europe is increasingly shaped by the ability to secure lower-fossil, higher-biogenic material and monitor its carbon content.
The Americas, MEA and APAC Waste-to-Energy (WtE) Plant Feedstock Market
North America, South America, and the Middle East & Africa make up the remaining regional demand. The waste-to-energy plant feedstock market in North America is supported by diversion measures and renewable-gas development, with state programs providing more defined pathways for organics. Mobius Renewables acquired Air Liquide biogas activities in the United States, France, Norway, and Sweden in May 2026, including landfill-gas-to-renewable-natural-gas and farm-waste sites. South America has potential in agricultural residues, including sugarcane bagasse. The Middle East & Africa is supported by urban waste-management programs and project pipelines. Indonesia's Presidential Regulation No. 109 of 2025 set a fixed USD 0.20/kWh tariff for 30 years, which improves revenue visibility but leaves operators exposed to long-term inflation risk.
Competitive Landscape
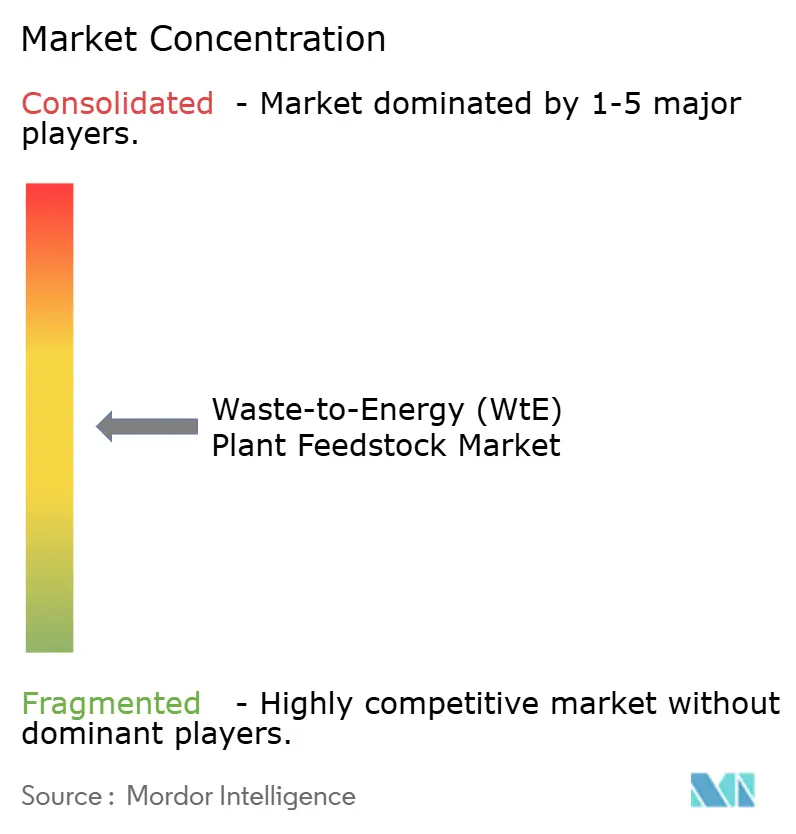
The waste-to-energy plant feedstock market has a moderately concentrated technology and operations base. Veolia, Remondis, Reworld, China Everbright Environment, and Shanghai Environment Group hold strong positions in their home regions. Their strength rests on municipal relationships, concession arrangements, engineering capabilities, and operating experience. Veolia increased its interest in Chonburi Clean Energy in Thailand to 66.6% in 2025, extending its position in the Eastern Economic Corridor. The waste-to-energy plant feedstock market rewards operators that combine waste collection, treatment, and plant operations. Competition is becoming more focused on digital feedstock controls and long-term access to municipal material.
Technology-focused providers can enter mature markets through operating and maintenance arrangements rather than full ownership. Kanadevia Inova assumed the 38-year operating and maintenance contract for Dublin Waste to Energy in March 2026 and committed to increasing throughput capacity by 15% to 690,000 tonnes annually. This approach provides access to operating data, plant processes, and long-term feedstock flows. Smaller firms can also use joint ventures or offtake agreements in agricultural-waste conversion. The waste-to-energy plant feedstock market therefore offers room for established integrated operators and specialized technology suppliers. Within the waste-to-energy plant feedstock market, specialized providers can compete through sorting, automation, combustion controls, and renewable-gas processing.
Capital providers are also shaping competitive conditions through ownership transactions in established assets. MEAG acquired a 49.78% stake in the South East London Combined Heat and Power facility in July 2026. Encyclis separately agreed to sell a 50% stake in Dublin Waste to Energy to Universities Superannuation Scheme. The waste-to-energy plant feedstock market attracts infrastructure investors where treatment and energy revenues are contracted. The waste-to-energy plant feedstock industry remains less concentrated at the project level because concessions, feedstock rules, and local approvals differ by city and country. The available information does not provide a combined top-player share, so it does not support a numerical market concentration score.
Waste-to-Energy (WtE) Plant Feedstock Industry Leaders
-
Veolia Environnement S.A.
-
SUEZ Group
-
REMONDIS SE & Co. KG
-
Waste Management, Inc.
-
China Everbright Environment Group Limited
- *Disclaimer: Major Players sorted in no particular order
Waste-to-Energy (WtE) Plant Feedstock Market Companies Covered in this Report
- Waste Management, Inc.
- Republic Services, Inc.
- Veolia Environnement S.A.
- SUEZ Group
- Urbaser S.A.
- China Everbright Environment Group Limited
- Reworld
- FCC Environment
- Biffa plc
- Renewi plc
- Remondis SE & Co. KG
- Stericycle, Inc.
- Ramky Enviro Engineers Limited
- China Green Environmental Protection Group
- Cleanaway Waste Management Limited
- Sembcorp Industries Ltd
- PreZero
- Shanghai Environment Group Co., Ltd.
- Indaver NV
- GFL Environmental Inc.
Recent Industry Developments in Waste-to-Energy (WtE) Plant Feedstock Market
- July 2026: German asset manager MEAG acquired a 49.78% interest in the South East London Combined Heat and Power energy-from-waste facility from iCON Infrastructure Partners.
- May 2026: Tosoh Corporation began commercial operations at its Nanyo biomass power plant, which uses white pellets, construction-waste wood chips, and refuse-derived pellets.
- April 2026: Mobius Renewables completed its acquisition of Air Liquide's biogas production operations in the United States, France, Norway, and Sweden, including 6 landfill-gas-to-renewable-natural-gas sites and 5 farm-waste sites.
- April 2026: JFE Engineering invested JPY 750 million, equal to USD 5.2 million, for a 25% interest in 2 Andhra Pradesh waste-to-energy projects.
Global Waste-to-Energy (WtE) Plant Feedstock Market Report Scope
Waste-to-Energy (WtE) plant feedstock refers to the waste materials supplied to a Waste-to-Energy facility as inputs for conversion into useful energy, primarily electricity, heat, or both. Typical WtE feedstocks include municipal solid waste (MSW), commercial and industrial waste, refuse-derived fuel (RDF), sewage sludge, agricultural waste, and other non-recyclable or combustible waste streams. Depending on the WtE technology used, the feedstock may be processed through incineration, gasification, pyrolysis, anaerobic digestion, or other thermal and biological conversion processes.
The Waste-to-Energy (WtE) Plant Feedstock Market is segmented by feedstock type, application, end user, and geography. By feedstock type, the market is segmented into municipal solid waste (MSW), industrial waste, agricultural and biomass residue, medical/biomedical waste, plastic and non-recyclable waste, sewage sludge, and other feedstocks. By application, the market is segmented into electricity generation, heat/steam generation, combined heat and power (CHP), and fuel production. By end user, the market is segmented into municipal corporations, industrial captive plants, commercial facilities, and independent power producers (IPPs). The report also covers the market size and forecasts for the global Waste-to-Energy Plant Feedstock Market across 26 countries in key regions. For each segment, the market sizing and forecasts have been provided on the basis of value (USD).
Segmentation Overview
| Municipal Solid Waste (MSW) |
| Industrial Waste |
| Agricultural & Biomass Residue |
| Medical/Biomedical Waste |
| Plastic & Non-Recyclable Waste |
| Sewage Sludge |
| Others (Construction & Demolition Waste, etc.) |
| Electricity Generation |
| Heat/Steam Generation |
| Combined Heat & Power (CHP) |
| Fuel Production (RDF, Biogas, Syngas) |
| Municipal Corporations |
| Industrial Captive Plants |
| Commercial Establishments |
| Independent Power Producers (IPPs) |
| North America | United States |
| Canada | |
| Mexico | |
| Europe | Germany |
| France | |
| Italy | |
| Spain | |
| United Kingdom | |
| Poland | |
| Russia | |
| Rest of Europe | |
| Asia-Pacific | China |
| India | |
| Japan | |
| South Korea | |
| Australia | |
| Indonesia | |
| Vietnam | |
| Thailand | |
| Rest of Asia-Pacific | |
| South America | Brazil |
| Argentina | |
| Chile | |
| Rest of South America | |
| Middle East and Africa | Saudi Arabia |
| United Arab Emirates | |
| Egypt | |
| South Africa | |
| Morocco | |
| Rest of Middle East and Africa |
| By Feedstock Type | Municipal Solid Waste (MSW) | |
| Industrial Waste | ||
| Agricultural & Biomass Residue | ||
| Medical/Biomedical Waste | ||
| Plastic & Non-Recyclable Waste | ||
| Sewage Sludge | ||
| Others (Construction & Demolition Waste, etc.) | ||
| By Application | Electricity Generation | |
| Heat/Steam Generation | ||
| Combined Heat & Power (CHP) | ||
| Fuel Production (RDF, Biogas, Syngas) | ||
| By End User | Municipal Corporations | |
| Industrial Captive Plants | ||
| Commercial Establishments | ||
| Independent Power Producers (IPPs) | ||
| By Geography | North America | United States |
| Canada | ||
| Mexico | ||
| Europe | Germany | |
| France | ||
| Italy | ||
| Spain | ||
| United Kingdom | ||
| Poland | ||
| Russia | ||
| Rest of Europe | ||
| Asia-Pacific | China | |
| India | ||
| Japan | ||
| South Korea | ||
| Australia | ||
| Indonesia | ||
| Vietnam | ||
| Thailand | ||
| Rest of Asia-Pacific | ||
| South America | Brazil | |
| Argentina | ||
| Chile | ||
| Rest of South America | ||
| Middle East and Africa | Saudi Arabia | |
| United Arab Emirates | ||
| Egypt | ||
| South Africa | ||
| Morocco | ||
| Rest of Middle East and Africa | ||
Key Questions Answered in the Report
How large is the waste-to-energy (WtE) plant feedstock market?
The sector is valued at USD 21.87 billion in 2026 and is forecast to reach USD 30.91 billion by 2031 at a 7.25% CAGR.
Which feedstock category is largest?
Municipal Solid Waste was the largest feedstock category, holding 68.3% share in 2025.
Which application is growing fastest?
Fuel Production is forecast to grow at an 8.9% CAGR through 2031, supported by biogas, bio-LNG, refuse-derived fuel, and syngas pathways.
Why is feedstock quality important for waste-to-energy plants?
Moisture, chlorine, and contamination can reduce thermal efficiency, increase maintenance needs, and affect energy output.
Which region has the strongest position in waste-to-energy feedstock?
Asia-Pacific held 39.7% share in 2025 and is forecast to grow at an 8.1% CAGR through 2031.
What makes a waste-to-energy project easier to finance?
Long-term municipal gate-fee agreements, contracted heat or power sales, reliable feedstock supply, and proven technology improve financing prospects.