
VR Marketing Services Market Size and Share
Market Overview
| Study Period | 2020 - 2031 |
|---|---|
| Market Size (2026) | USD 3.01 Billion |
| Market Size (2031) | USD 6.86 Billion |
| Growth Rate (2026 - 2031) | 17.91 % |
| Fastest Growing Market | Asia-Pacific |
| Largest Market | North America |
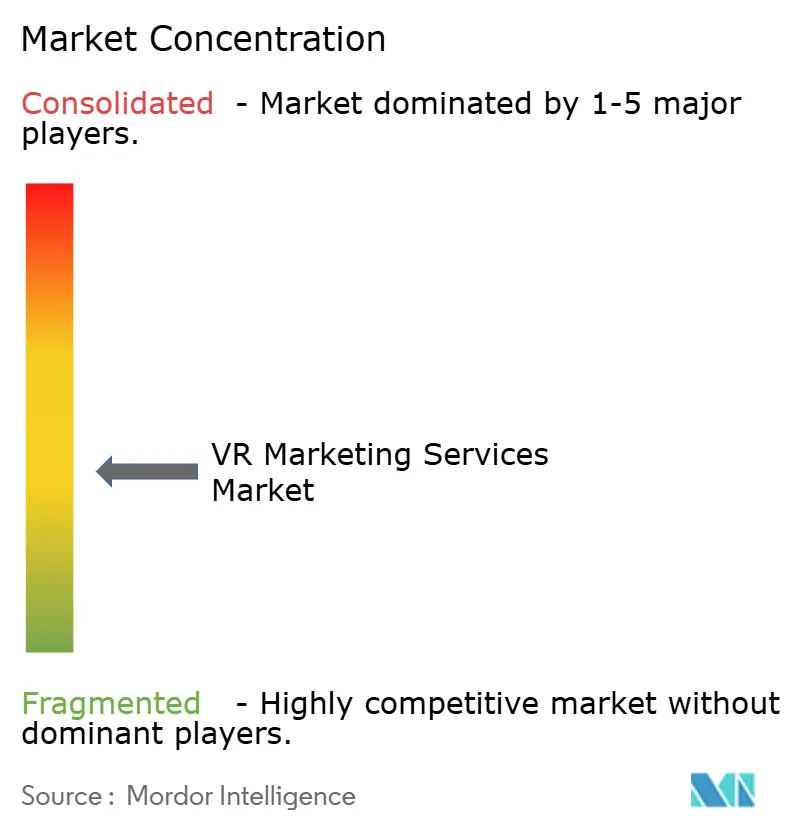
| Market Concentration | Medium |
Major Players *Disclaimer: Major Players sorted in no particular order Image © Mordor Intelligence. Reuse requires attribution under CC BY 4.0. | |
VR Marketing Services Market Analysis by Mordor Intelligence
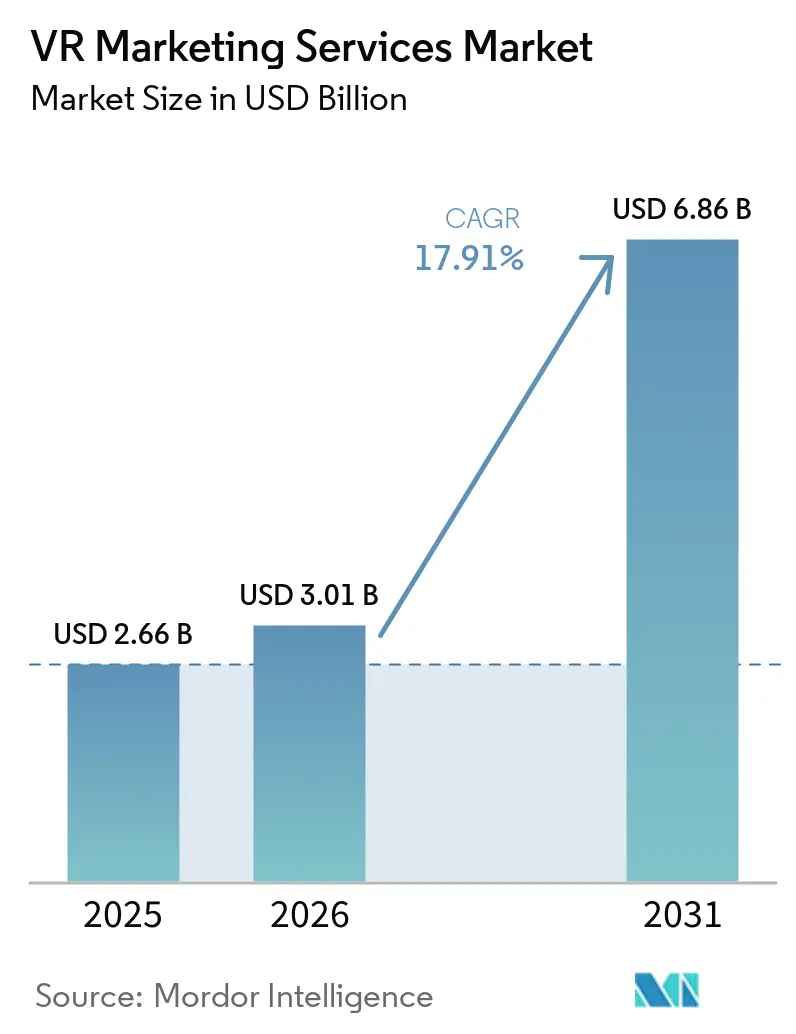
The VR marketing services market size was valued at USD 2.66 billion in 2025 and estimated to grow from USD 3.01 billion in 2026 to reach USD 6.86 billion by 2031, at a CAGR of 17.91% during the forecast period (2026-2031). The VR marketing services market is moving from isolated experiential work toward recurring campaign programs that are measured alongside other digital media. Retailers, automotive companies, and travel providers are using rendered environments to collect interaction data and support product discovery. Brands are also shifting attention from passive reach metrics toward dwell time, searches after engagement, and purchase activity. Mobile-first and browser-based delivery models reduce the dependence on consumer headset ownership and broaden campaign reach. Larger agency groups are expanding spatial production capabilities, while specialist studios retain an important role in complex vertical assignments.
Key Report Takeaways
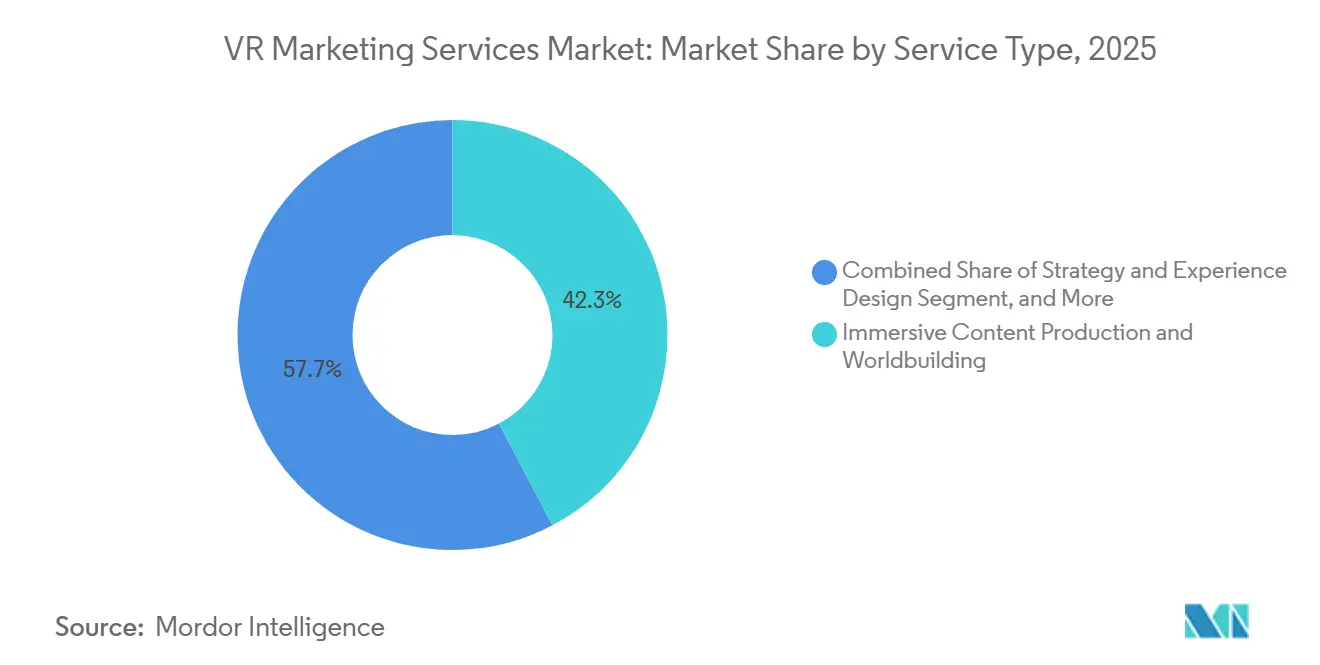
- By service type, Immersive Content Production and Worldbuilding held 42.30% of the VR marketing services market share in 2025, while Campaign Management, Optimization, and Analytics are projected to expand at a CAGR of 18.44% through 2031.
- By platform and delivery mode, Mobile and Application-Based VR Experiences accounted for 38.80% of the VR marketing services market in 2025, while WebXR and Browser-Based Experiences are projected to grow at a CAGR of 18.91% through 2031.
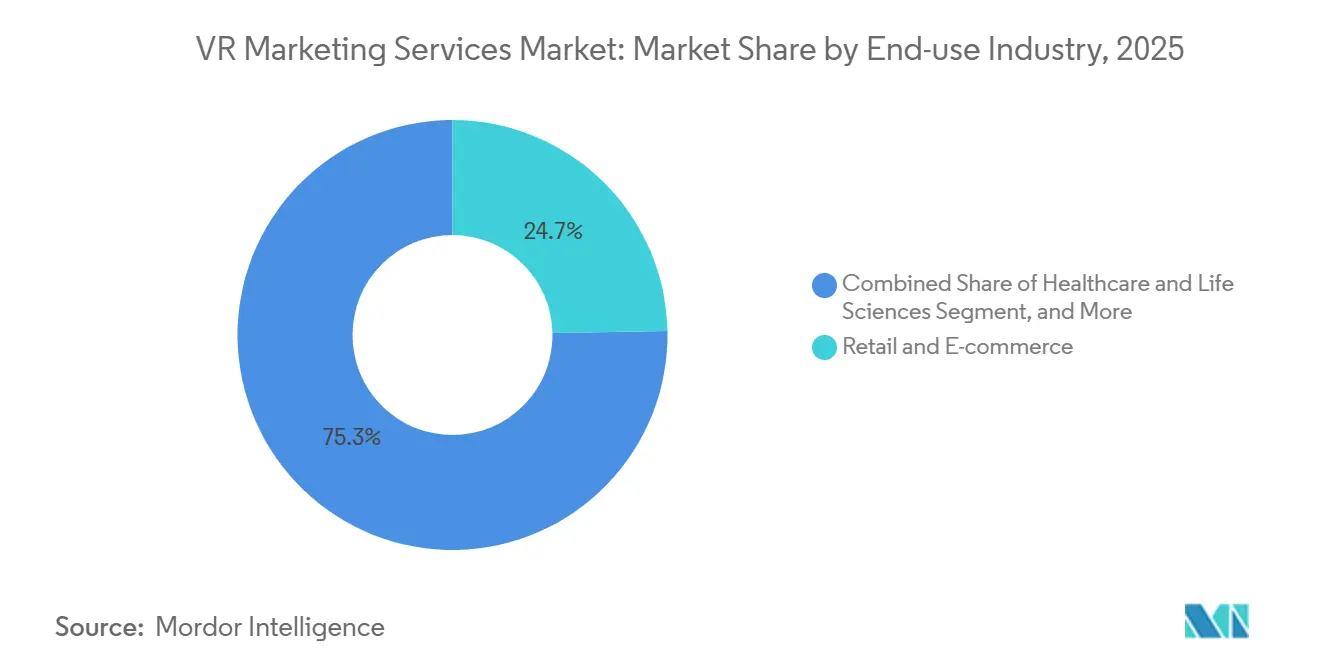
- By end-use industry, Retail and E-commerce retained 24.70% market share in 2025, while Travel and Hospitality is projected to register at a CAGR of 18.73% through 2031.
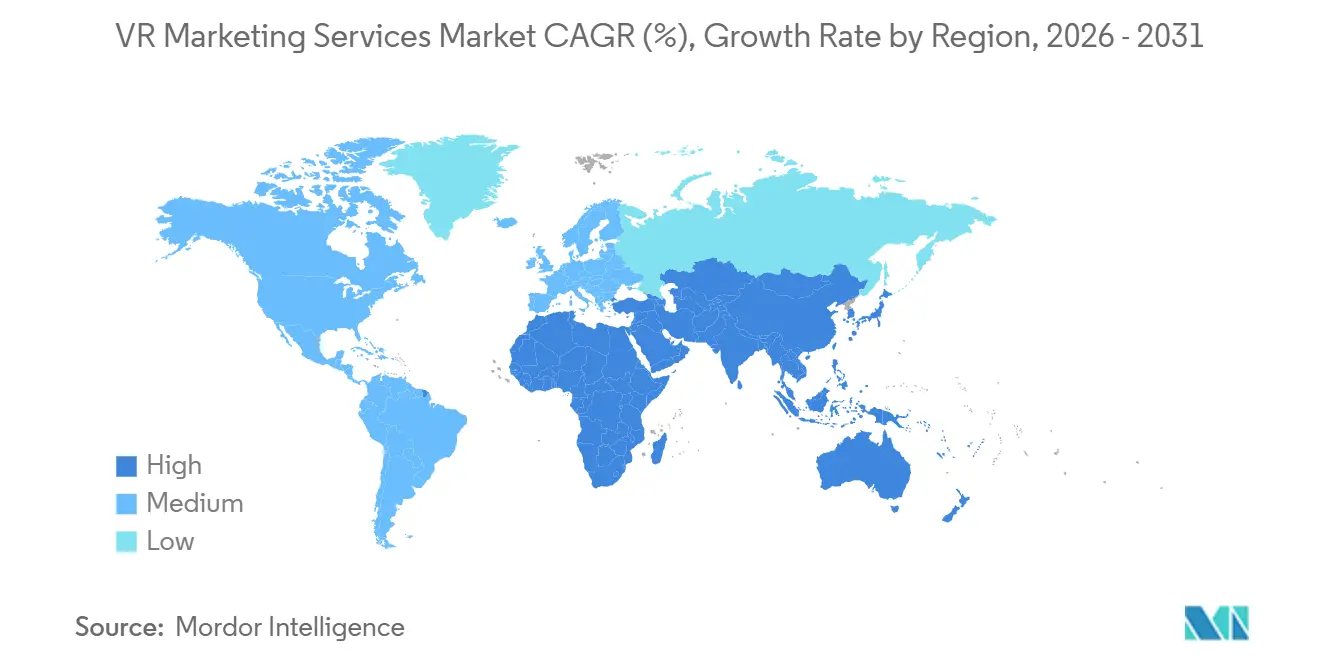
- By geography, North America held 41.63% of global revenue in 2025, while Asia-Pacific is projected to record a CAGR of 18.96% through 2031.
Note: Market size and forecast figures in this report are generated using Mordor Intelligence’s proprietary estimation framework, updated with the latest available data and insights as of January 2026.
Market Trends and Insights
Drivers Impact Analysis of VR Marketing Services Market*
| Driver | (~) % Impact on CAGR Forecast | Geographic Relevance | Impact Timeline |
|---|---|---|---|
| Demand for Immersive Brand Engagement | +4.2% | Global | Medium term (2-4 years) |
| Virtual Product Demonstrations for High-Consideration Purchases | +3.0% | North America and Europe | Medium term (2-4 years) |
| Expansion of Hybrid and Virtual Event Budgets | +2.5% | North America and Europe | Short term (≤ 2 years) |
| E-commerce Demand for 3D Product Discovery and Conversion | +2.8% | Asia-Pacific and North America | Short term (≤ 2 years) |
| Browser-Based Spatial Delivery Reduces Activation Friction | +2.3% | Global | Short term (≤ 2 years) |
| Enterprise Spatial Computing Pilots Expand Premium Experience Inventory | +1.8% | North America and Europe | Long term (≥ 4 years) |
| Source: Mordor Intelligence | |||
Demand for Immersive Brand Engagement
Brands are assigning dedicated budgets to virtual environments where consumers can explore products, attend launches, and participate in loyalty activities at their own pace. This approach gives the VR marketing services market a way to move beyond flat digital impressions and toward longer consumer interactions. Hakuhodo DY Holdings reported that 37.5% of Japanese users who encountered a brand in a virtual environment learned its name, while 21.5% searched for the company afterward. Snap’s Ramadan AR Mall reached more than 16.8 million users across the Middle East and North Africa in 2025, and average brand-store engagement rose 30.25% from 2024. Users spent more than 26 seconds in each virtual brand store, showing that seasonal spatial campaigns can achieve scale when the content reflects local demand. Dwell time and searches after a session give agencies performance measures that can support campaign reviews with senior marketers.
Virtual Product Demonstrations for High-Consideration Purchases
Virtual product demonstrations are most useful when buyers face complex choices, high prices, or difficult showroom visits. Automotive, real estate, and premium fashion are therefore relevant demand areas for the VR marketing services market. Automotive companies use browser-based 3D configurators and virtual showrooms so buyers can review interior trims, customize vehicles, and examine driving scenarios before visiting a dealer. Real estate developers in the Gulf Cooperation Council use guided virtual walkthroughs to present off-plan properties before construction is complete. These uses change the client brief from a brand-awareness exercise to sales support, which may require links to customer relationship management systems and dealer workflows. Such work can create longer engagements for service providers because the experience must align with the client’s sales process, not just a campaign calendar.
E-commerce Demand for 3D Product Discovery and Conversion
Online retail companies use 3D visualization and virtual try-on to reduce hesitation when shoppers cannot inspect a product in person. Shopify stated that products with 3D or augmented reality content converted at rates 94% higher than comparable listings without immersive content. A 2025 study by Snap and Publicis Groupe found that 80% of 4,028 shoppers reported greater purchase confidence with AR try-on tools, while 66% said they were less likely to return an item. These outcomes connect the VR marketing services market with both conversion and reverse-logistics concerns in online retail. The findings also support continued spending on product discovery tools in footwear, apparel, and home furnishings. As immersive shopping data is added to customer data platforms, privacy law requirements can shape how behavioral metrics are collected and retained.
Browser-Based Spatial Delivery Reduces Activation Friction
WebXR delivery removes the need for a separate application download or a consumer-owned headset. This makes the VR marketing services market more accessible through existing desktop and mobile browsers. WebXR can place 3D environments within web pages and support access through desktop, mobile, and headset devices. Puma and Meta launched a WebXR shopping experience for the All-Pro Nitro basketball shoe in June 2025, allowing users to view the shoe at 1:1 scale, measure their feet with hand controllers, and continue to checkout. Journee’s Clinique virtual lab was available in 36 countries and 21 languages through a browser, without an account requirement or extra hardware. Browser delivery can also shorten production cycles because campaign teams do not need app store submission, platform royalty payments, or consumer operating system update processes.
Restraints Impact Analysis of VR Marketing Services Market*
| Restraint | (~) % Impact on CAGR Forecast | Geographic Relevance | Impact Timeline |
|---|---|---|---|
| High Experience Production and Integration Costs | -1.5% | Global | Short term (≤ 2 years) |
| Limited Headset Reach for Mass-Market Campaigns | -1.2% | Global, excluding enterprise | Medium term (2-4 years) |
| Biometric and Inferred-Data Compliance Exposure | -0.9% | European Union and North America | Medium term (2-4 years) |
| GPU Streaming Capacity and Cost Constraints | -0.7% | Global | Short term (≤ 2 years) |
| Source: Mordor Intelligence | |||
High Experience Production and Integration Costs
High-fidelity experiences require 3D artists, spatial user experience designers, real-time rendering engineers, and quality assurance. These requirements make a VR project more costly than conventional digital creative work and limit adoption among mid-market brands. WPP launched its AI-powered Production Studio with Hogarth in June 2024, using NVIDIA Omniverse and OpenUSD as part of an annual USD 320 million investment in AI, data, and technology. The VR marketing services market also faces integration costs when campaigns must connect e-commerce systems, customer relationship management tools, marketing automation platforms, and analytics stacks. Larger holding companies can spread these costs across accounts, while smaller brands may compare a bespoke build against established performance marketing formats. Production automation may lower content costs over time, but savings do not necessarily reach every client at the same pace.
Biometric and Inferred-Data Compliance Exposure
Virtual reality platforms can collect eye-gaze patterns, head movements, pupil responses, and interaction sequences during an immersive session. The European Union’s General Data Protection Regulation treats biometric data used for unique identification as a special category and requires an appropriate legal basis, including explicit consent in relevant cases.[1] Research on extended reality privacy has also identified the limits of relying on device setup terms of service for continuous inferred data collection. The European Union AI Act imposes further restrictions on certain uses of biometric identification and emotion recognition. For the VR marketing services market, legal review may therefore involve marketing operations and privacy counsel before analytics features can be deployed. This process can increase both cost and production time for campaigns that use behavioral data.
*Our forecasts treat driver/restraint impacts as directional, not additive. The impact forecasts reflect baseline growth, mix effects, and variable interactions.
VR Marketing Services Market Segment Analysis
By Service Type:
Analytics Investment Narrows the Gap with ProductionImmersive Content Production and Worldbuilding held 42.30% of the VR marketing services market share in 2025, making it the largest service category. The share reflects a stage of development in which brands first pay to build a custom spatial environment. Automotive, fashion, and retail clients continue to commission these environments as the core assets in immersive programs. Strategy and Experience Design provides an entry point for clients who need to define a spatial brief and user journey before funding full production. It also supports early planning for the creative architecture, content flow, and business objective of an experience. Campaign Management, Optimization, and Analytics is projected to grow at a CAGR of 18.44% from 2026 to 2031. This rate reflects the growing demand for attribution linking immersive engagement to downstream conversion activity. The service category can become more important as marketing teams treat immersive sessions as measurable media units instead of one-time activations.
The VR marketing services industry is seeing agencies shift from project-based production revenue toward analytics and optimization work delivered through retainers. This change can reduce revenue from a single build while increasing client retention and contract duration. WPP’s 2024 production studio showed how large agencies are seeking to automate parts of high-fidelity 3D content creation. NVIDIA stated that Coca-Cola, Moët Hennessy, and Nestlé used Omniverse-based tools to create localized 3D content variations at scale. These variations require data on where and when different creative output performs. The combination of lower production effort and higher measurement needs can narrow the gap between content production and campaign analytics. Agencies must therefore compete on their ability to connect creative work with performance information as well as on visual production quality.

By Platform and Delivery Mode:
WebXR Reduces the Download BarrierMobile and Application-Based VR Experiences accounted for 38.80% of the VR marketing services market in 2025. The segment leads because smartphones are more widely available than dedicated headsets across all major geographies. Mobile delivery gives brands a practical way to reach a broad consumer audience without making headset ownership a condition of participation. Headset-Based Immersive Experiences remain well-suited to automotive, real estate, and luxury applications that require detailed, controlled environments. Hybrid Omnichannel VR Campaigns connect immersive content with physical events, digital channels, and mobile touchpoints. WebXR and Browser-Based Experiences are projected to record the fastest CAGR, at 18.91%, through 2031. This growth points to a shift from app-based delivery to browser access, with fewer steps for users. The VR marketing services market can use this delivery model to support mass reach while retaining an immersive format.
Puma’s June 2025 All-Pro Nitro experience demonstrated a browser-native shopping format that did not require a separate download. The user could inspect the product, measure foot size, and continue to the Puma website from the experience. Journee’s browser-based Clinique lab showed a second model for global distribution across 36 countries and 21 languages. Browser delivery can align with web accessibility tools that enterprise clients increasingly expect in digital campaigns. It also avoids several operational steps associated with native applications. Consumer headset shipments declined in 2025, limiting the audience for campaigns that only work on premium devices. The resulting hardware risk reinforces the value of browser delivery for campaign programs that need wider access.
By End-Use Industry:
Retail Anchors Demand as Travel ExpandsRetail and E-commerce retained 24.70% of the VR marketing services market share in 2025, making it the largest end-use category. The segment benefits from product visualization and virtual try-on tools that can be used repeatedly across product listings. Shopify reported that 3D and augmented reality content was associated with conversion rates 94% higher than comparable listings without immersive content. Travel and Hospitality is projected to register the fastest CAGR of 18.73% from 2026 to 2031. Destination organizations use virtual previews to reduce the time spent considering long-haul and high-value bookings. Virtual hotel and itinerary experiences can also support property and event-space reviews before a visit. These factors position retail as the largest current client category and travel as the fastest-expanding use case.
The VR marketing services industry also serves automotive companies that use spatial configurators and virtual showrooms during the pre-sale process. Maserati, Škoda, and Porsche have adopted spatial product experiences through platforms that include Journee’s Automotive Immersive Module and Apple Vision Pro enterprise configurations. Real estate uses digital twins and guided walkthroughs to support off-plan property sales.[2] Fashion and beauty companies use virtual try-on in efforts to improve product discovery and add-to-cart activity. Consumer electronics, healthcare and life sciences, and media and entertainment represent additional end-use areas with varying adoption levels. Healthcare use is more focused on medical-device education and physician training than on consumer-facing campaigns. The mix of use cases means service providers need both consumer marketing skills and the ability to support specialized business workflows.
Geography Analysis
North America VR Marketing Services Market
North America led the VR marketing services market, accounting for 41.63% of global revenue in 2025. The region benefits from concentrated enterprise marketing budgets, established full-service and specialist agencies, and early corporate use of spatial computing hardware. The United States remains the most active country for VR campaign commissioning, and WPP, Omnicom, and Publicis Groupe are investing in immersive production infrastructure for large enterprise clients. WPP’s HEX studio brought together 50 creative technologists from architecture, gaming, robotics, and related fields, showing continued investment in advanced experience production. North America’s revenue base is expected to remain the largest because of the scale of brand marketing budgets, even as regional growth moderates with maturity.
APAC VR Marketing Services Market
The VR marketing services market in Asia-Pacific is projected to grow at a CAGR of 18.96% from 2026 to 2031, the highest rate among the regions. China has developed a broad virtual reality and metaverse marketing ecosystem that is used by luxury brands and automotive manufacturers. Japan’s 2025 consumer survey identified 6.7 million metaverse users with measurable brand awareness after virtual brand contact. In that survey, 37.5% of users learned the brand name and 21.5% conducted a later web search. South Korea and Southeast Asia add to regional demand through high smartphone use, younger gaming-oriented consumers, and interest in interactive brand entertainment.
EMEA and South America VR Marketing Services Market
Europe has an important revenue base through Germany, the United Kingdom, and France, where luxury brands, automotive groups, and retail companies are active buyers. The United Kingdom’s creative-agency and production-studio base supports experience design work, while Germany’s automotive sector creates demand for configurators and virtual showrooms. European privacy rules shape immersive analytics consent and data retention, while the United Arab Emirates and Saudi Arabia are emerging as high-engagement markets. Saudi Arabia’s participation in Snap’s 2025 Ramadan AR Mall illustrates this engagement.[3] South America and Africa remain earlier-stage markets, with Brazil and South Africa leading adoption through mobile-native formats that can run on mid-range smartphones.
Competitive Landscape
The VR marketing services market is moderately fragmented, with 2 capability tiers. WPP, Publicis Groupe, Dentsu, Omnicom, and Havas compete for strategic accounts by placing immersive production within broader marketing transformation programs. These holding companies use virtual reality content as part of AI-led, omnichannel client work. WPP’s AI Production Studio uses NVIDIA Omniverse and OpenUSD, demonstrating a preference among large agencies for building production infrastructure rather than relying entirely on external studios. WPP also launched HEX in 2026 with 50 specialist technologists working across gaming, robotics, generative AI, and creative production.
Specialist agencies such as Groove Jones, Sector 5 Digital, and Journee compete on technical depth, focused vertical expertise, and faster production in automotive, healthcare, and fashion, where general-agency capabilities may be insufficient. CoStar Group completed the acquisition of Matterport in February 2025 at an enterprise value of USD 1.6 billion.[4] The transaction combined Matterport’s library of more than 14 million scanned spaces across 177 countries with CoStar’s property marketplace infrastructure. It strengthened the availability of integrated digital-twin capabilities for property marketing.
The VR marketing services market has open opportunities where spatial delivery and performance analytics are offered together rather than in separate phases. Browser-native platforms such as Journee and e-commerce-focused providers such as Marxent combine content creation, delivery, and analytics in a single service. This model can reduce the production cycle from months to weeks. Sector 5 Digital delivered an augmented reality program in July 2025 for a major United States sports franchise with a telecommunications company and a media agency, including stadium interactions and a mobile WebAR version. Accessibility standards and privacy compliance requirements can favor larger vendors that can meet enterprise request-for-proposal requirements.
VR Marketing Services Industry Leaders
-
WPP plc
-
Omnicom Group Inc.
-
Publicis Groupe S.A.
-
Dentsu Group Inc.
-
Havas N.V.
- *Disclaimer: Major Players sorted in no particular order
VR Marketing Services Market Companies Covered in this Report
- WPP plc
- Omnicom Group Inc.
- Publicis Groupe S.A.
- Dentsu Group Inc.
- Havas N.V.
- Jack Morton Worldwide, Inc.
- GMR Marketing, LLC
- Sector 5 Digital, LLC
- Groove Jones, Inc.
- The Glimpse Group, Inc.
- Matterport, Inc.
- Marxent Labs, LLC
- vFairs LLC
- ENGAGE XR Holdings plc
Recent Industry Developments in VR Marketing Services Market
- June 2026: WPP launched HEX, a frontier creative studio comprising 50 technologists with backgrounds in architecture, gaming, fine art, and robotics, positioned at the intersection of generative AI, immersive experiences, and branded interactive content. The studio operates within WPP Production’s innovation structure and delivers client work through WPP’s global account roster.
- May 2026: Groove Jones produced a promotional video for WPP Enterprise Solutions for the 2026 Adobe Summit using its proprietary GenVFX pipeline. The work combined generative AI with traditional visual-effects techniques to produce immersive marketing content more quickly than conventional workflows.
- February 2026: The Glimpse Group’s subsidiary, Sector 5 Digital, secured a mid-six-figure follow-on contract with a global pharmaceutical company for a 3D anatomy training platform, deepening the firm’s presence in the healthcare and life sciences vertical and demonstrating that immersive content production for medical brand education is now a structured budget line item for global pharma organizations.
- June 2026: Puma partnered with Meta to launch a WebXR mixed reality shopping experience for its All-Pro Nitro basketball shoe, accessible through the Meta Quest web browser without a separate download. The experience enabled users to view the shoe at 1:1 scale, measure foot size via hand controllers, and proceed directly to the Puma website for purchase, representing a commercially deployed spatial-to-checkout pipeline.
Global VR Marketing Services Market Report Scope
The VR marketing services market covers services that use virtual reality technologies to create immersive, interactive, and experience-led marketing campaigns for brands and organizations. The scope of the report includes VR-based brand activations, product demonstrations, virtual events, experiential advertising, customer engagement solutions, and related content development and deployment services across end-user industries.
The VR Marketing Services Market Report is Segmented by Service Type (Strategy and Experience Design, Immersive Content Production and Worldbuilding, and Campaign Management, Optimization and Analytics), Platform and Delivery Mode (WebXR / Browser-Based Experiences, Mobile and Application-Based VR Experiences, Headset-Based Immersive Experiences, and Hybrid Omnichannel VR Campaigns), End-use Industry (Retail and E-commerce, Automotive, Real Estate, Fashion and Beauty, Travel and Hospitality, Consumer Electronics, Healthcare and Life Sciences, and Media and Entertainment), and Geography (North America, South America, Europe, Asia-Pacific, Middle East, and Africa). The Market Forecasts are Provided in Terms of Value (USD).
Segmentation Overview
| Strategy and Experience Design |
| Immersive Content Production and Worldbuilding |
| Campaign Management, Optimization and Analytics |
| WebXR / Browser-Based Experiences |
| Mobile and Application-Based VR Experiences |
| Headset-Based Immersive Experiences |
| Hybrid Omnichannel VR Campaigns |
| Retail and E-commerce |
| Automotive |
| Real Estate |
| Fashion and Beauty |
| Travel and Hospitality |
| Consumer Electronics |
| Healthcare and Life Sciences |
| Media and Entertainment |
| North America | United States |
| Canada | |
| Mexico | |
| South America | Brazil |
| Argentina | |
| Chile | |
| Rest of South America | |
| Europe | Germany |
| United Kingdom | |
| France | |
| Italy | |
| Spain | |
| Russia | |
| Rest of Europe | |
| Asia-Pacific | China |
| India | |
| Japan | |
| South Korea | |
| Australia | |
| Southeast Asia | |
| Rest of Asia-Pacific | |
| Middle East | United Arab Emirates |
| Saudi Arabia | |
| Turkey | |
| Rest of Middle East | |
| Africa | South Africa |
| Egypt | |
| Nigeria | |
| Rest of Africa |
| By Service Type | Strategy and Experience Design | |
| Immersive Content Production and Worldbuilding | ||
| Campaign Management, Optimization and Analytics | ||
| By Platform and Delivery Mode | WebXR / Browser-Based Experiences | |
| Mobile and Application-Based VR Experiences | ||
| Headset-Based Immersive Experiences | ||
| Hybrid Omnichannel VR Campaigns | ||
| By End-use Industry | Retail and E-commerce | |
| Automotive | ||
| Real Estate | ||
| Fashion and Beauty | ||
| Travel and Hospitality | ||
| Consumer Electronics | ||
| Healthcare and Life Sciences | ||
| Media and Entertainment | ||
| By Geography | North America | United States |
| Canada | ||
| Mexico | ||
| South America | Brazil | |
| Argentina | ||
| Chile | ||
| Rest of South America | ||
| Europe | Germany | |
| United Kingdom | ||
| France | ||
| Italy | ||
| Spain | ||
| Russia | ||
| Rest of Europe | ||
| Asia-Pacific | China | |
| India | ||
| Japan | ||
| South Korea | ||
| Australia | ||
| Southeast Asia | ||
| Rest of Asia-Pacific | ||
| Middle East | United Arab Emirates | |
| Saudi Arabia | ||
| Turkey | ||
| Rest of Middle East | ||
| Africa | South Africa | |
| Egypt | ||
| Nigeria | ||
| Rest of Africa | ||
Key Questions Answered in the Report
What is the size of the VR marketing services market?
The VR marketing services market was valued at USD 2.66 billion in 2025 and is estimated at USD 3.01 billion in 2026. It is projected to reach USD 6.86 billion by 2031 at a CAGR of 17.91%, as brands move immersive work into recurring campaign programs.
Which service type leads VR marketing services?
Immersive Content Production and Worldbuilding led with a 42.30% share in 2025 because clients first need custom spatial environments. Production spending covers the rendered environment used in launches, product exploration, and retail activations. Campaign Management, Optimization and Analytics is projected to record the fastest service CAGR of 18.44% through 2031 as measurement becomes more important.
Why are brands adopting WebXR experiences?
WebXR supports access through a browser without a separate application download or dedicated headset. For the VR marketing services market, this delivery approach can reduce consumer friction, support desktop and mobile access, and avoid several operational steps associated with native application distribution. It also allows campaign teams to update creative assets without app-store submission, platform royalties, or consumer operating-system update processes.
Which end-use segment is growing fastest?
Travel and Hospitality is projected to grow at a CAGR of 18.73% through 2031.
Which region will grow fastest through 2031?
Asia-Pacific is projected to record the highest regional CAGR at 18.96%.
What limits wider use of immersive campaign services?
High production and integration costs, limited headset reach, privacy compliance requirements, and GPU streaming constraints can slow adoption.