Viral Vector Production (Research-use) Market Size and Share
Market Overview
| Study Period | 2020 - 2031 |
|---|---|
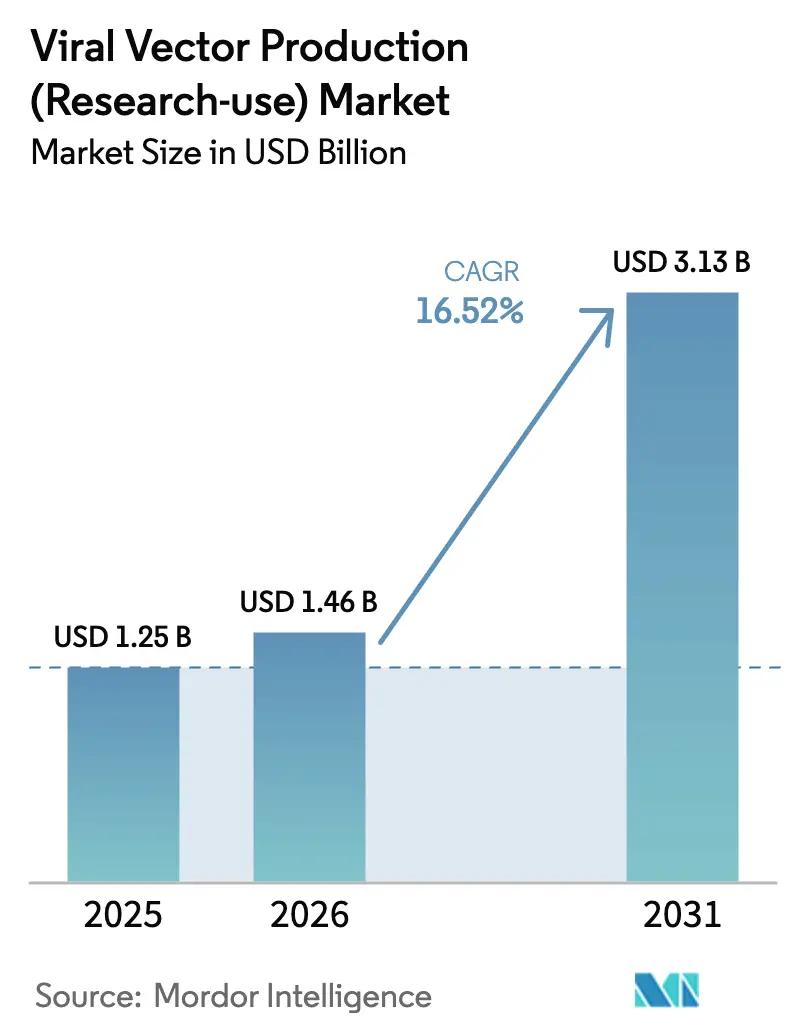
| Market Size (2026) | USD 1.46 Billion |
| Market Size (2031) | USD 3.13 Billion |
| Growth Rate (2026 - 2031) | 16.52% CAGR |
| Fastest Growing Market | Asia Pacific |
| Largest Market | North America |
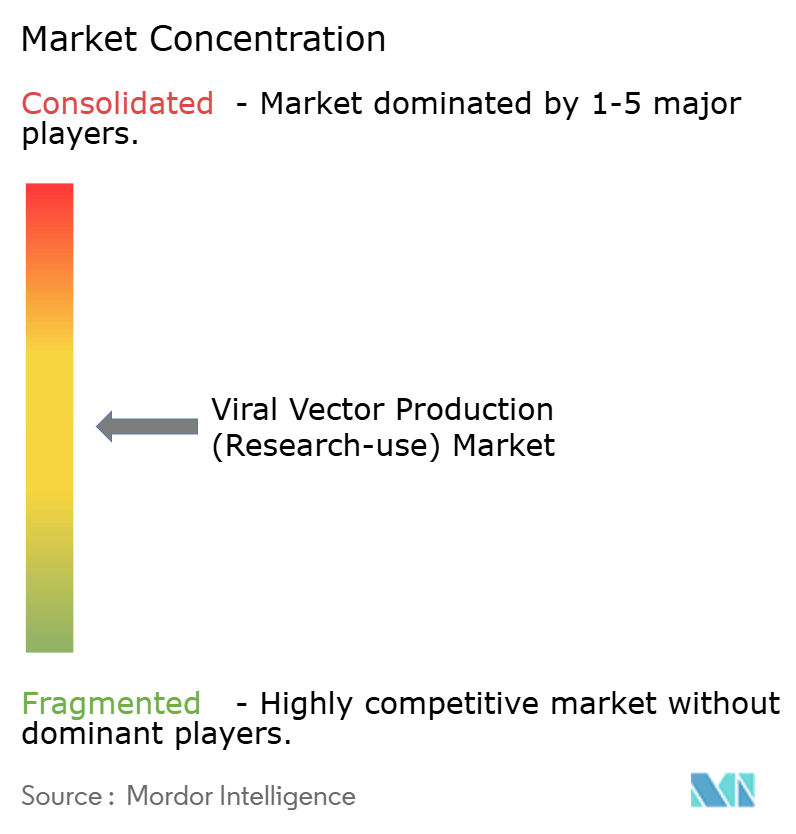
| Market Concentration | Medium |
Major Players-Market---MP.webp) *Disclaimer: Major Players sorted in no particular order Image © Mordor Intelligence. Reuse requires attribution under CC BY 4.0. | |
Viral Vector Production (Research-use) Market Analysis by Mordor Intelligence
The Viral Vector Production Market size was valued at USD 1.25 billion in 2025 and estimated to grow from USD 1.46 billion in 2026 to reach USD 3.13 billion by 2031, at a CAGR of 16.52% during the forecast period (2026-2031).
Demand acceleration stems from a clinical pipeline exceeding 2,000 cell and gene therapy programs that rely on research-grade viral vectors for pre-clinical exploration and early human studies[1]American Society of Gene & Cell Therapy, “2024 Gene, Cell, & RNA Therapy Landscape,” asgct.org. Academic laboratories, specialty biotechnology firms, and large pharmaceutical sponsors collectively fuel procurement, while consolidated contract manufacturers increase capacity at an unprecedented pace. North America remains the epicenter thanks to generous public funding and a mature innovation ecosystem, yet Asia-Pacific is translating heavy capital investment into the fastest regional growth. Across the board, process-intensive production, raw-material bottlenecks, and stringent analytics temper margins, but technology innovation and platform manufacturing continue to unlock scale advantages.
Key Report Takeaways
- By vector type, adeno-associated virus held 41.78% of the viral vector production research use market share in 2025; lentiviral vectors are poised for an 18.02% CAGR through 2031.
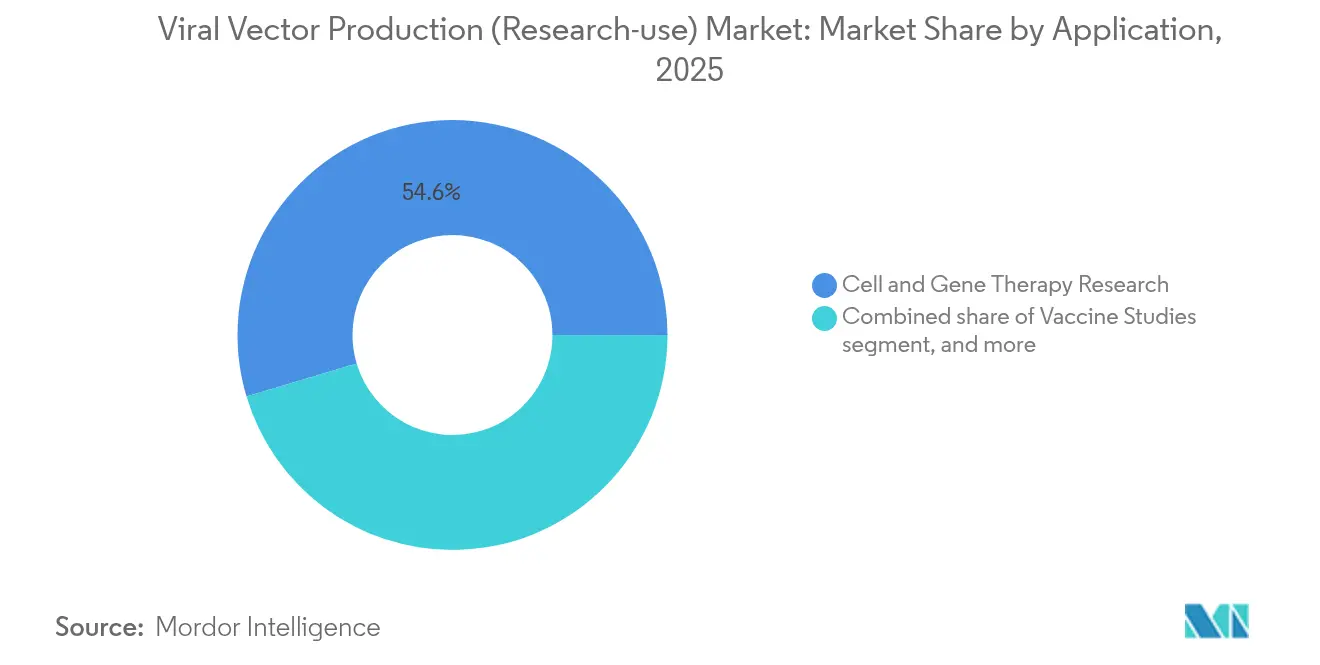
- By application, cell and gene therapy research represented 54.62% of the viral vector production research use market size in 2025, whereas oncolytic virus studies are projected to post an 17.96% CAGR to 2031.
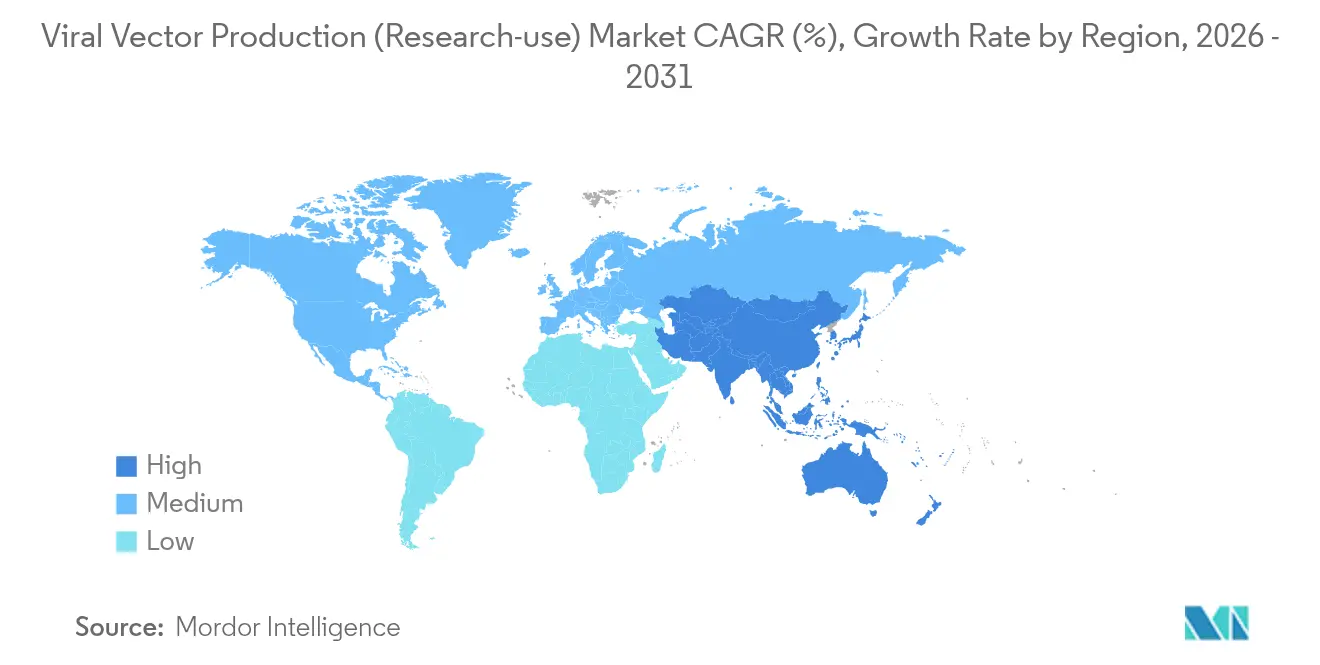
- By geography, North America accounted for 45.92% revenue in 2025; Asia-Pacific leads in growth at a 17.21% CAGR to 2031.
- By end user, pharmaceutical and biotechnology companies captured 47.88% income in 2025, while CDMOs are forecast to grow at 18.9% through 2031.
Note: Market size and forecast figures in this report are generated using Mordor Intelligence’s proprietary estimation framework, updated with the latest available data and insights as of 2026.
Global Viral Vector Production (Research-use) Market Trends and Insights
Drivers Impact Analysis*
| Driver | % Impact on CAGR Forecast | Geographic Relevance | Impact Timeline |
|---|---|---|---|
| Expansion of cell and gene therapy clinical pipeline | +4.2% | Global, led by North America and EU | Medium term (2–4 years) |
| Rapid capacity scale-up by contract manufacturers | +3.8% | Global, spill-over from North America to APAC | Short term (≤ 2 years) |
| Technology innovations in upstream and downstream processing | +2.9% | North America & EU core, expanding to APAC | Long term (≥ 4 years) |
| Strategic industry collaborations and funding influx | +2.1% | Global, early gains in Boston, San Francisco, Cambridge | Medium term (2–4 years) |
| Rising academic and government investment in viral vector research | +1.8% | US, UK, Germany concentration | Long term (≥ 4 years) |
| Favorable regulatory support for advanced therapies | +1.3% | North America & EU, gradual APAC adoption | Medium term (2–4 years) |
| Source: Mordor Intelligence | |||
Expansion of Cell and Gene Therapy Clinical Pipeline
More than 2,000 active clinical studies demand specialized vectors, and the FDA cleared five gene therapies in 2023, reinforcing confidence in viral delivery platforms. Oncology now represents 40% of ongoing trials, amplifying need for diverse capsids and oncolytic designs. NIH initiatives such as the Ultra-Rare Gene Therapy Network and the USD 104 million Bespoke Gene Therapy Consortium deepen institutional commitment[2]National Institutes of Health, “Bespoke Gene Therapy Consortium Overview,” nih.gov. Researchers require multiple serotypes for comparative work, elevating throughput expectations and shortening production lead-times. In response, the viral vector production research use market invests in modular facilities that can flex between small exploratory batches and pilot-scale lots without compromising compliance standards.
Technology Innovations in Upstream and Downstream Processing
Suspension-adapted cell lines paired with 5,000 L single-use bioreactors allow scale without extensive retrofits, as demonstrated by Takara Bio’s deployment of Thermo Fisher DynaDrive systems. Affinity purification media such as AAVX capture resin achieve 85-95% recoveries, while flow-virometry and NIST reference materials sharpen lot release precision[3]National Institute of Standards and Technology, “Reference Materials for Viral Vector Analytics,” nist.gov. Artificial-intelligence-guided capsid engineering from firms like Dyno Therapeutics elevates tissue specificity, permitting lower vector doses and potentially reducing manufacturing burden. Collectively, these advances reduce cost per dose and underpin the long-term competitiveness of the viral vector production research use market.
Strategic Industry Collaborations and Funding Influx
Cross-sector collaborations accelerate know-how transfer: Charles River’s tie-up with the Gates Institute targets next-generation lentiviral technologies. Government backing also expands, typified by the USD 5 billion Project NextGen and BARDA’s USD 500 million late-stage vaccine support[4]U.S. Department of Health and Human Services, “Project NextGen and BARDA Funding Updates,” hhs.gov. Private capital mirrors public enthusiasm; venture funding reached USD 3.4 billion across nearly 100 deals in 2023, focusing on platform technologies capable of multi-indication utility. The viral vector production research use market therefore benefits from robust liquidity that cushions cyclical funding shocks and accelerates commercialization timelines.
Rising Academic and Government Investment in Viral Vector Research
NIH and European Horizon programs allocate sizeable budgets to facilities, training, and technology cores, ensuring that translational projects have rapid access to high-quality vectors. These allocations foster regional clusters where academic discovery and industrial scale-up coexist, further enlarging the viral vector production research use industry talent pool. Dedicated training networks diminish the skills gap, though labor demand still outpaces supply. As governments expand apprenticeship grants, the market expects trained headcount to increase by 196% from 2025 to 2030, bringing production overheads gradually down.
Restraints Impact Analysis*
| Restraints Impact Analysis | (~) % Impact on CAGR Forecast | Geographic Relevance | Impact Timeline |
|---|---|---|---|
| High production costs and process complexity | -2.7% | Global, acute in emerging markets | Short term (≤ 2 years) |
| Supply chain bottlenecks for critical raw materials | -1.9% | Global with regional variability | Short term (≤ 2 years) |
| Stringent and evolving regulatory requirements | -1.4% | North America & EU | Medium term (2–4 years) |
| Limited skilled workforce and training gaps | -1.1% | Global, pronounced in APAC | Long term (≥ 4 years) |
| Source: Mordor Intelligence | |||
High Production Costs and Process Complexity
Research-grade AAV lots cost USD 10,000–50,000, and analytical testing can consume up to 30% of spend, placing pressure on grant-funded projects. Multiple plasmid transfections, diverse cell platforms, and stringent impurity clearance elevate fixed overheads. Smaller labs struggle to justify capital outlays, thereby intensifying outsourcing dependence. CDMOs counter with platform cell lines and automated chromatography, yet validation timelines and capex outlays delay broad savings. Consequently, cost remains the most immediate headwind to scaling the viral vector production research use market.
Supply Chain Bottlenecks for Critical Raw Materials
COVID-19 disruptions exposed fragile reagent supply chains; lead times for GMP-grade plasmid DNA stretched to 16 weeks, delaying investigational studies. Oligopolistic supplier structures heighten price volatility for resins and transfection reagents. Sponsors now dual-source media and develop in-house plasmid suites to mitigate risk, but such redundancy adds expense. Regional diversification strategies in APAC may gradually stabilize flows, yet logistics complexity persists, constraining the near-term throughput of the viral vector production research use market.
*Our forecasts treat driver/restraint impacts as directional, not additive. The impact forecasts reflect baseline growth, mix effects, and variable interactions.
Segment Analysis
By Vector Type: AAV Dominance Meets Lentiviral Innovation
Adeno-associated virus vectors retained 41.78% of the viral vector production research use market in 2025, underpinned by favorable immunogenicity and broad tissue tropism. Lentiviral vectors, however, are projected to expand at an 18.02% CAGR on the strength of CAR-T and ex vivo gene-editing adoption. Adenoviruses sustain relevance in vaccine prototyping and oncolytics, whereas retroviral and newer platforms cater to specialized payload and neurotropic needs.
Continuous capsid engineering bolsters AAV versatility, with machine-learning libraries driving superior targeting efficiency. Stable producer cell lines now improve lentiviral batch consistency, shrinking cost differentials. Facilities increasingly configure multi-suite layouts capable of alternating between vector families in response to parallel project pipelines, reinforcing the agility imperative across the viral vector production research use market.


By Application: Research Foundation Drives Therapeutic Innovation
Cell and gene therapy investigations commanded 54.62% of the viral vector production research use market size in 2025, reflecting sustained laboratory exploration into payload design and vector-host interactions. Oncolytic virus programs, however, lead growth at 17.96% CAGR as immuno-oncology pairs viral lysis with checkpoint blockade. Vaccine research maintains elevated demand post-pandemic, especially as Project NextGen funds next-wave prophylactics.
Academic consortia now push vectors into regenerative-medicine, genome-editing delivery, and tissue-engineering models. Such diversification multiplies batch requisitions, requiring CDMOs to pivot quickly among serotypes, titers, and purification schemes. The result is a dynamic order landscape that sustains throughput even when individual therapeutic areas ebb.
By End User: Academic-Industry Convergence Accelerates Innovation
Pharmaceutical and biotechnology sponsors generated 47.88% of 2025 revenue, leveraging vectors for IND-enabling studies and early clinical lots. CDMOs are the fastest-growing cohort at 18.9% CAGR as firms outsource complex bioprocessing. Academic cores and research institutes remain pivotal, yet they increasingly partner with commercial manufacturers to access GMP-aligned quality systems.
Strategic acquisitions, Charles River’s USD 292.5 million purchase of Vigene Biosciences, for instance, create integrated offerings that couple analytics with production to shorten timelines. Such consolidation deepens service menus and strengthens negotiating leverage, influencing pricing structures across the viral vector production research use market.
Geography Analysis
North America sustained a 45.92% revenue share in 2025, powered by NIH grants exceeding USD 8.5 billion and the USD 5 billion Project NextGen initiative. Biotech clusters in Boston, San Francisco, and the Research Triangle house dense networks of vector specialists, regulatory consultants, and venture capital. Recent capacity additions, such as GenScript’s New Jersey site, further entrench regional leadership.
Asia-Pacific registered the most rapid trajectory, projected at 17.21% CAGR through 2031. China’s Guangzhou hub, Japan’s automation-heavy production suites, and South Korea’s biomanufacturing incentives converge to create a robust ecosystem. Expanding technical capability, competitive labor costs, and growing domestic demand attract Western sponsors seeking supply-chain diversification.
Europe delivers steady progress under EMA harmonization. Novartis’s VIFA One plant exemplifies investment in fully robotic manufacturing, while the UK’s Cell and Gene Therapy Catapult fosters tech-transfer pipelines. Regulatory complexities post-Brexit impose incremental compliance tasks, yet pan-European collaborations mitigate fragmentation risk. Emerging regions across Latin America and the Middle East pursue foundational infrastructure but remain minor contributors to the viral vector production research use market for the forecast horizon.

Competitive Landscape
Market consolidation has advanced as established suppliers acquire niche innovators to secure technology depth and capacity. Merck KGaA’s USD 600 million buyout of Mirus Bio broadened reagent portfolios, while Charles River added viral vector manufacturing through its Vigene Biosciences purchase. Top players such as Lonza, Thermo Fisher, and Oxford Biomedica wield early-mover process knowledge and longstanding regulatory rapport.
Competition now centers on turnkey solutions that merge cell-line development, upstream production, downstream purification, and release testing under unified quality systems. Automation adoption accelerates, with robotic harvests and closed-system chromatography driving down contamination risks. Companies also invest in digital twins to model process variability and in silico scale-up, creating data moats that raise switching costs.
White-space opportunities include capsid libraries optimized for tissue selectivity, scalable herpes simplex systems for large-payload delivery, and next-generation producer lines that drive single-use platforms. Firms that integrate these innovations while offering flexible scheduling and transparent pricing will consolidate share in the viral vector production research use market.
Viral Vector Production (Research-use) Industry Leaders
Merck KGaA
Lonza
Thermo Fisher Scientific Inc.
FUJIFILM Diosynth Biotechnologies
Charles River Laboratories
- *Disclaimer: Major Players sorted in no particular order

Recent Industry Developments
- June 2025: Charles River Laboratories launched a lentiviral-vector partnership with the Gates Institute to refine next-generation production methods.
- March 2025: VectorBuilder opened a 500,000 sq ft Gene Delivery campus in Guangzhou containing 30 GMP suites.
- February 2025: Novartis inaugurated its €40 million fully automated VIFA One facility in Slovenia.
- February 2025: Takara Bio scaled viral vector CDMO services using 50 L–5,000 L single-use bioreactors.
- August 2024: MilliporeSigma completed the USD 600 million Mirus Bio acquisition, reinforcing transfection reagent capabilities.


Research Methodology Framework and Report Scope
Market Definitions and Key Coverage
Our study defines the viral-vector production (research use) market as the sale of laboratory-grade adeno-associated, adenoviral, lentiviral, retroviral, and related vectors that are supplied in small-batch, non-GMP formats for in-vitro discovery, pre-clinical proof-of-concept, assay development, and academic experiments.
Scope exclusion: Clinical-grade and commercial-scale GMP vectors intended for human dosing, as well as plasmid DNA kits, are excluded.
Segmentation Overview
- By Vector Type
- Adeno-Associated Virus (AAV)
- Adenoviral Vectors
- Lentiviral Vectors
- Retroviral Vectors
- Other Vector Types
- By Application
- Cell & Gene Therapy Research
- Vaccine Studies
- Oncolytic Virus Research
- Other Applications
- By End User
- Pharmaceutical & Biotechnology Companies
- Contract Development & Manufacturing Organizations (CDMOs)
- Academic Centers & Research Institutes
- Contract Research Organizations (CROs)
- Geography
- North America
- United States
- Canada
- Mexico
- Europe
- Germany
- United Kingdom
- France
- Italy
- Spain
- Rest of Europe
- Asia-Pacific
- China
- Japan
- India
- Australia
- South Korea
- Rest of Asia-Pacific
- Middle East & Africa
- GCC
- South Africa
- Rest of Middle East & Africa
- South America
- Brazil
- Argentina
- Rest of South America
- North America
Detailed Research Methodology and Data Validation
Primary Research
Mordor analysts interview process-development scientists at vector core facilities, procurement managers at biotech start-ups, and reagent distributors across North America, Europe, and Asia-Pacific. These conversations validate average research-use batch sizes, prevailing price points, and the share of orders handled through contract vector cores versus in-house labs.
Desk Research
We begin by mapping publicly available statistics and scientific outputs. Key inputs include FDA and EMA master file listings, NIH RePORTER grant data, EU Horizon project databases, customs codes for HS 300215, and peer-reviewed papers that report typical vector titers. Company 10-Ks, investor decks, and conference abstracts illustrate capacity additions and research demand swings. Select paid resources, such as D&B Hoovers for revenue splits and Questel for patent counts, help our analysts size supplier activity and intellectual-property momentum. The sources above are illustrative; many more were reviewed to cross-check figures and fill gaps.
Market-Sizing & Forecasting
We employ a top-down model that rebuilds 2024 vector demand by reconciling academic publication counts, grant funding directed to viral tools, and average price-per-10^13 GC equivalents, which are then corroborated with a sampled bottom-up roll-up of leading supplier revenues. Critical variables include AAV versus lentivirus research adoption rates, annual grant disbursement growth, typical titer requirements per assay, shifts toward synthetic promoter libraries, and regional lab headcount expansion. A multivariate regression links these drivers to historic sales and projects the market through 2030. Scenario analysis adjusts for funding squeezes or breakthrough gene-editing alternatives. Where supplier disclosures lack detail, gap factors are estimated using regional shipment proxies and interview-derived utilization ratios.
Data Validation & Update Cycle
Every model run is sense-checked against patent application volumes and customs trade lines. Variances outside a three-year moving range trigger a senior analyst review before sign-off. Reports refresh yearly, with interim updates released when funding policy or technology step changes materially alter demand.
Why Mordor's Viral Vector Production Baseline Commands Reliability
Published estimates often differ, and we acknowledge that variation stems from scope, pricing units, and refresh cadence.
Key gap drivers include whether plasmid DNA revenues are bundled, if GMP volumes are mixed with research-only sales, the treatment of one-off pilot batches, and currency conversions that rivals freeze at outdated rates while Mordor updates monthly.
Benchmark comparison
| Market Size | Anonymized source | Primary gap driver |
|---|---|---|
| USD 1.25 B (2025) | Mordor Intelligence | - |
| USD 1.77 B (2025) | Global Consultancy A | Includes early clinical GMP lots and assumes uniform ASP across regions |
| USD 2.23 B (2025) | Industry Association B | Blends plasmid DNA kits with viral vectors and uses 2023 FX rates |
The comparison shows how a clear research-only scope, frequent currency updates, and cross-checks with lab-level demand allow Mordor to deliver a balanced, transparent baseline that decision-makers can trace back to tangible variables and repeatable steps.


Key Questions Answered in the Report
What is the current size of the viral vector production research use market?
The viral vector production research use market stands at USD 1.46 billion in 2026 and is projected to grow to USD 3.13 billion by 2031 at a 16.52% CAGR.
Which vector type generates the greatest demand?
Adeno-associated virus vectors lead with 41.78% market share in 2025 thanks to low immunogenicity and versatile tissue targeting.
Why are CDMOs growing faster than other end-user segments?
CDMOs offer specialized infrastructure and regulatory expertise that many sponsors prefer to outsource, driving a 18.9% CAGR for the segment through 2031.
Which region is expanding most rapidly?
Asia-Pacific is forecast to register the highest regional CAGR at 17.21%, propelled by large-scale investments in China, Japan, and South Korea.
What is the main cost barrier in viral vector research production?
High batch costs, USD 10,000-50,000 for research-grade AAVs, combined with extensive analytical requirements create significant budget pressure for smaller labs.
How are supply chain risks being mitigated?
Producers increasingly adopt dual-sourcing, regional diversification, and vertical integration strategies to stabilize reagent and plasmid DNA supply.
Page last updated on:


