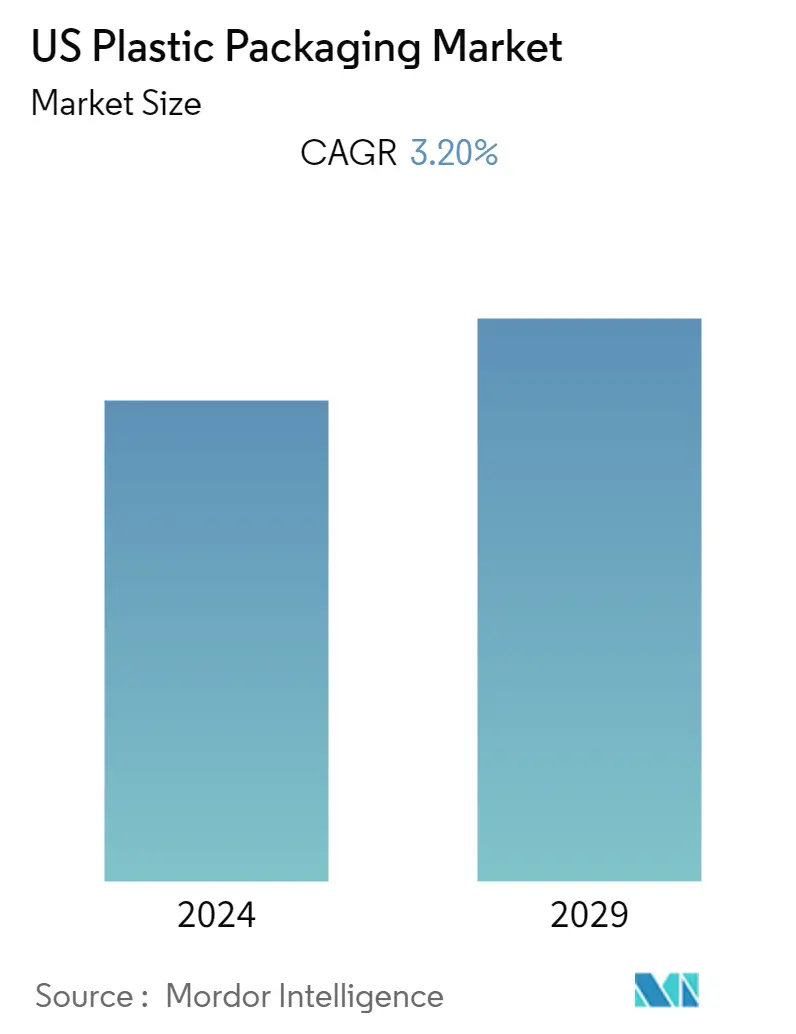
Market Size of US Plastic Packaging Industry
| Study Period | 2019 - 2029 |
| Base Year For Estimation | 2023 |
| Forecast Data Period | 2024 - 2029 |
| Historical Data Period | 2019 - 2022 |
| CAGR | 3.20 % |
| Market Concentration | Medium |
Major Players
*Disclaimer: Major Players sorted in no particular order |
Need a report that reflects how COVID-19 has impacted this market and its growth?
US Plastic Packaging Market Analysis
United States Plastic Packaging Market is expected to grow at a CAGR of 3.2% during the forecast period 2021 to 2026. The packaging was considered an essential service. Currently, in the United States, the FDA has said the COVID virus is not transmitted via packaging. However, some reports have indicated virus viability on packaging materials for one to three days. Thus, beverage, food, healthcare, and other end-user industries have been considered under essential services in the region. The respective end user witnessed significant demand for products such as bottled water, hand sanitizer bottle, household cleaning, etc., detergent, among others. According to convenience store news 2020 survey report, purchasing behavior of consumers at convenience stores due to the pandemic for the product such as bottled water(single), bottled water(multipack), milk accounted for 49%, 38%, and 46%, respectively.
- Bottled water is the most consumed beverage in the United States, according to the International Bottled Water Association (by volume). According to the International Bottled Water Association (IBWA) report, in the United States, the average sales of bottled water amount to USD 18.5 billion, with a rise of 8.8%. The per capita use exceeds 42 gallons of bottled water, with a rise of 6.2%. With this upward trend set to continue, the need for PET in bottled water packaging is expected to rise.
- Owing to the increased emphasis on sustainability, companies in the region are focusing on improving their single-use plastic packaging recycling rates. For instance, Repurpose Compostable Cold Cups are molded from polylactic acid resin extracted from corn grown in the United States to form clear plastic cups vegetable-based ink on the outside. The cups are offered in 12- and 16-ounce sizes, are BPA-free, and certified by the Biodegradable Products Institute (BPI). The cups can be composted at any BPI-certified commercial recycling center. Such initiatives are going to drive the plastic packaging market.
- The United States consumers are most enthusiastic when it comes to shopping during holidays. As per Adobe Analytics, the US online purchases over the 2020 holidays grew 32.2% from 2019, totaling a record of USD 188.2 billion as shoppers stayed home and shopped on the web during the pandemic, which has gradually led to the increase in the plastic packaging.
- The injection Molding technique is mostly used in the pharmaceutical industry to mass-produce plastic articles, such as syringes, drug inhalation units, bottle caps/closures, etc. Many companies have been investing in developing/expanding their portfolio in injection molding to supply caps and closures to the industry. For instance, Silgan Closures, in 2020, acquired Cobra Plastics, a manufacturer of injection-molded plastic closures to supply a wide variety of caps and closures in various industries.
- Consumers, especially those classified as millennials and Generation Z, have grown increasingly sensitive to the environmental impact of their product choices, leading to the use of paper cups. The popularity of cafés has created a global burst in the consumption of out-of-home (OOH) tea and coffee beverages. According to a study by NC State University in 2020, the United States led globally in the consumption of OOH paper-based coffee cups at 136 million cups per day, followed by China at 27.4 million, Russia at 16.4 million, Germany at 7.2 million, Britain at 7.0 million, and Australia at 2.7 million.
