Market Trends of United States Solar Energy Industry
Solar Photovoltaic (PV) Expected to Dominate the Market
- Solar power has become more accessible and prevalent in the United States. Solar experienced an annual growth rate of 8.3% in 2022 compared to the previous year. Over the last decade, solar installations in the country have grown 30-fold. The total installed capacity in the United States reached 145,598 gigawatt-hours in 2022.
- The solar energy markets are maturing rapidly around the country, and solar electricity is now economically competitive with conventional energy sources in several states, including California, Hawaii, and Minnesota.
- The solar photovoltaic (PV) market is mainly driven by strong federal policies, such as the solar Investment Tax Credit (ITC), rapidly declining costs, and increasing demand for clean electricity across the private and public sectors.
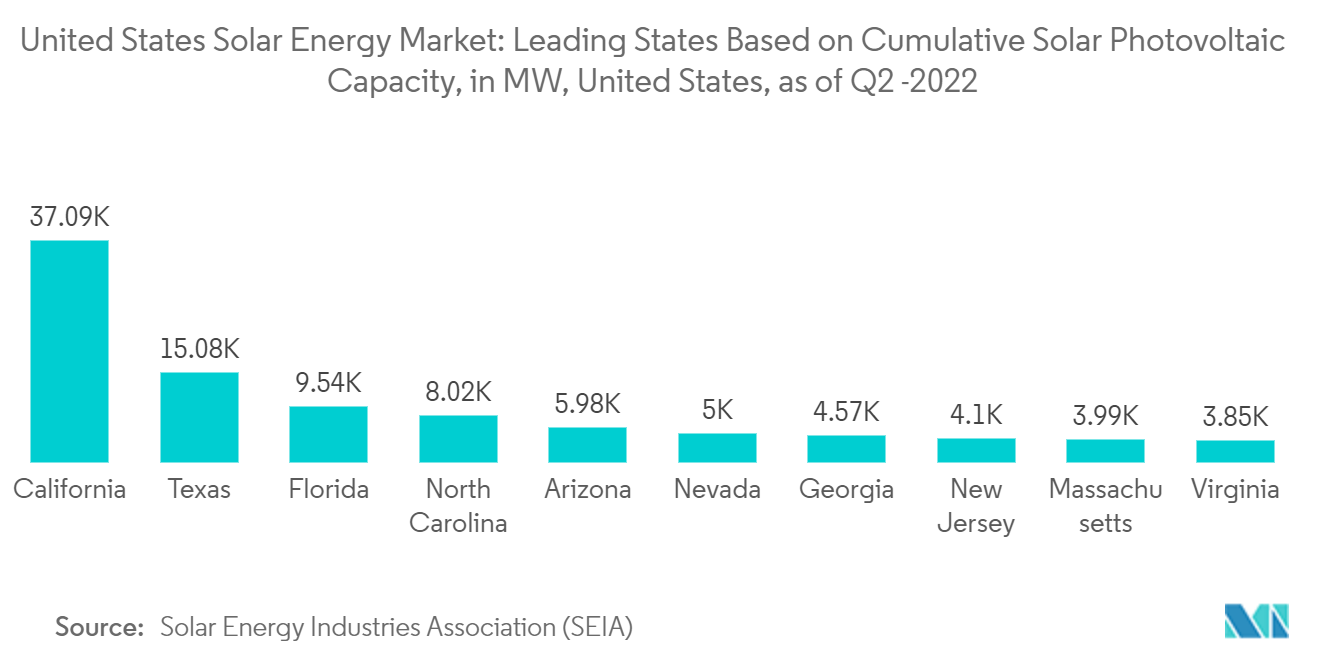
- California has by far the most installed capacity of solar photovoltaic (PV) power of any state in the United States. The Golden State had a total solar power capacity of over 37 gigatonnes as of the second quarter of 2022. Texas came in second with a capacity of about 15 gigatonnes. In 2021, both states in the United States added the most solar PV capacity.
- According to the Solar Energy Industries Association (SEIA), Utility-scale solar installations increased 66% from the first quarter of 2022. The sector is still experiencing supply constraints, but things are improving as module shipments arrive at ports. In the first quarter of this year, photovoltaic solar (PV) accounted for 54% of all new electricity-generating capacity additions. The capacity is expected to increase this year and continue to surge significantly during the forecast period.
- Hence, owing to the points mentioned above, solar photovoltaic (PV) is expected to dominate the US soar energy market during the forecast period.
Understand The Key Trends Shaping This Market
Download Sample
Declining Costs and Increasing Efficiencies of Solar Panels Expected to Drive the Market
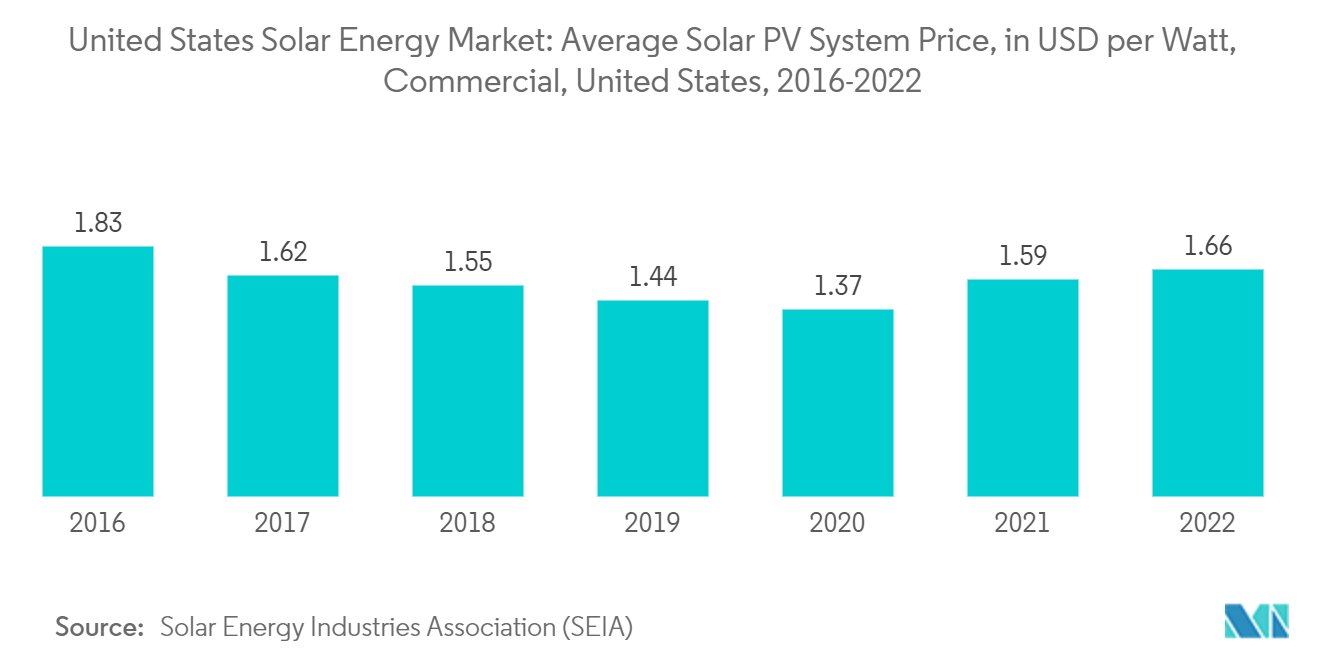
- Since the last decade, the average cost of a solar PV panel has dropped by nearly 90% globally. Prices of other components have also fallen significantly since 2011, reducing the Levelized Cost of Electricity (LCOE) for residential and utility-scale solar PV generation.
- Due to a combination of techno-economic and geopolitical factors, the rate of decline of solar PV panel prices is estimated to reduce slightly. Still, prices will continue to decline during the forecast period.
- According to the United States National Renewable Energy Laboratory (NREL), since 2010, there has been a 64%, 69%, and 82% reduction in the cost of residential, commercial-rooftop, and utility-scale PV systems in the United States, respectively.
- Due to the declining prices, many residential and commercial consumers are opting for rooftop solar PV systems to reduce energy costs and recovery time. Similarly, for large-scale utility project operators, lower panel costs enable them to sign Power Purchase Agreements (PPA) with consumers at a lower price.
- Over the past decade, the efficiency of solar PV panels has risen steadily. With the emergence of new technologies and manufacturing capabilities, this trend is expected to continue during the forecast period. The most efficient solar panels commercially available in the market have efficiency ratings as high as 22.8%, whereas most boards have an efficiency rating ranging from 16% to 18%.
- As of January 2022, SunPower's monocrystalline solar PV panels had the highest efficiency rating of any commercially available solar panel brand. Additionally, according to Solar Energy Industries Association, the U.S. Solar PV Pricing Trend dropped from USD 4.37 per watt in 2012 to USD 1.66 per watt in 2022 for the commercial segment.
- Therefore, owing to the above-mentioned points, declining costs and increasing efficiencies of solar PV panels are expected to drive the country's solar energy market during the forecast period.