United States NOR Flash Market Size and Share
Market Overview
| Study Period | 2020 - 2031 |
|---|---|
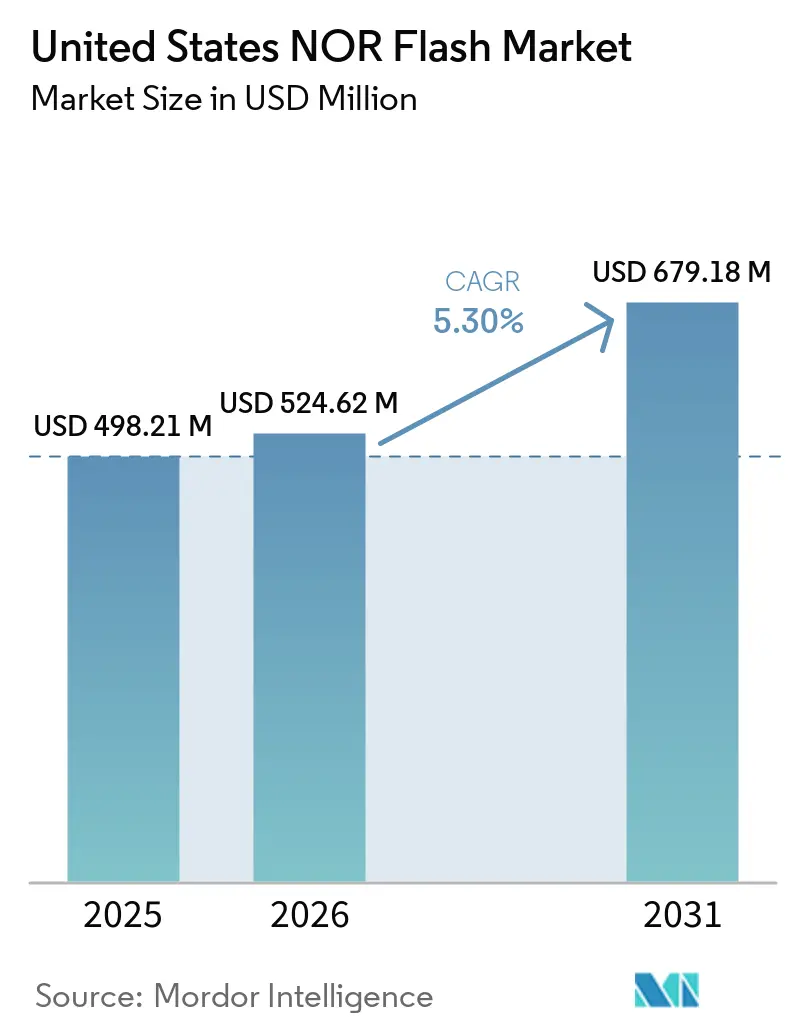
| Base Year Market Size (2025) | USD 498.21 Million |
| Market Size (2026) | USD 524.62 Million |
| Market Size (2031) | USD 679.18 Million |
| Growth Rate (2026 - 2031) | 5.30% CAGR |
| Fastest Growing Market | Asia-Pacific |
| Largest Market | North America |
Major Players *Disclaimer: Major Players sorted in no particular order Image © Mordor Intelligence. Reuse requires attribution under CC BY 4.0. | |
United States NOR Flash Market Analysis by Mordor Intelligence
The United States NOR Flash market size was valued at USD 498.21 million in 2025 and is estimated to grow from USD 524.62 million in 2026 to reach USD 679.18 million by 2031, at a CAGR of 5.3% during the forecast period (2026-2031). Growing federal incentives for domestic semiconductor capacity, stringent automotive functional-safety mandates, and a pivot toward high-reliability code storage together shift revenue mix away from consumer devices toward automotive, aerospace, and industrial control. Automotive domain controllers now specify high-density serial NOR to support over-the-air firmware redundancy, while 5G small-cell radio units create new mid-volume sockets that amplify demand without relying on cyclical handset sales. Supply dynamics remain tight because most mature-node capacity still resides on 200 mm lines in Taiwan and Japan, allowing incumbent vendors to exercise pricing power in niches where instant-boot and radiation tolerance command premiums. Process-gas price volatility and wafer competition with analog ICs temper margins, yet vendor roadmaps increasingly emphasize security features that lift average selling prices faster than bit growth.
Key Report Takeaways
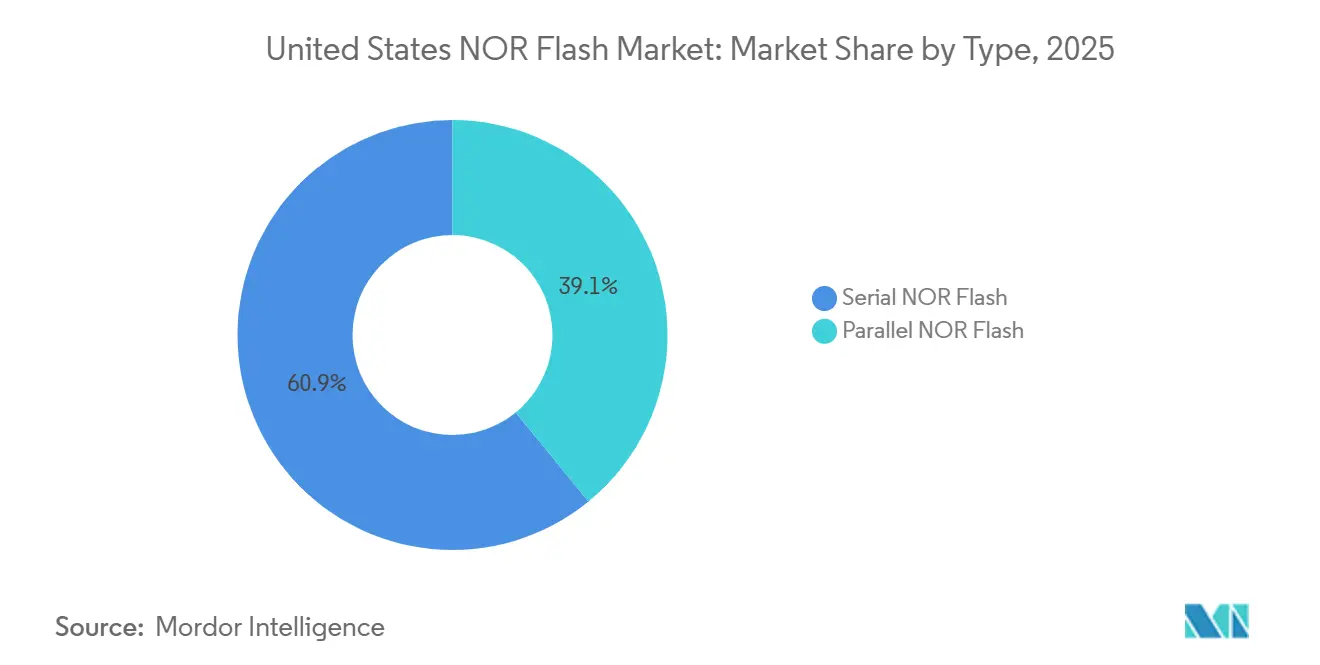
- By type, serial NOR Flash led the United States NOR Flash market with a 60.9% revenue share in 2025 and is projected to expand at a 7.8% CAGR through 2031.
- By interface, Quad SPI held 46.2% of the United States NOR Flash market share in 2025, while Octal and xSPI recorded the fastest projected CAGR of 10.6% to 2031.
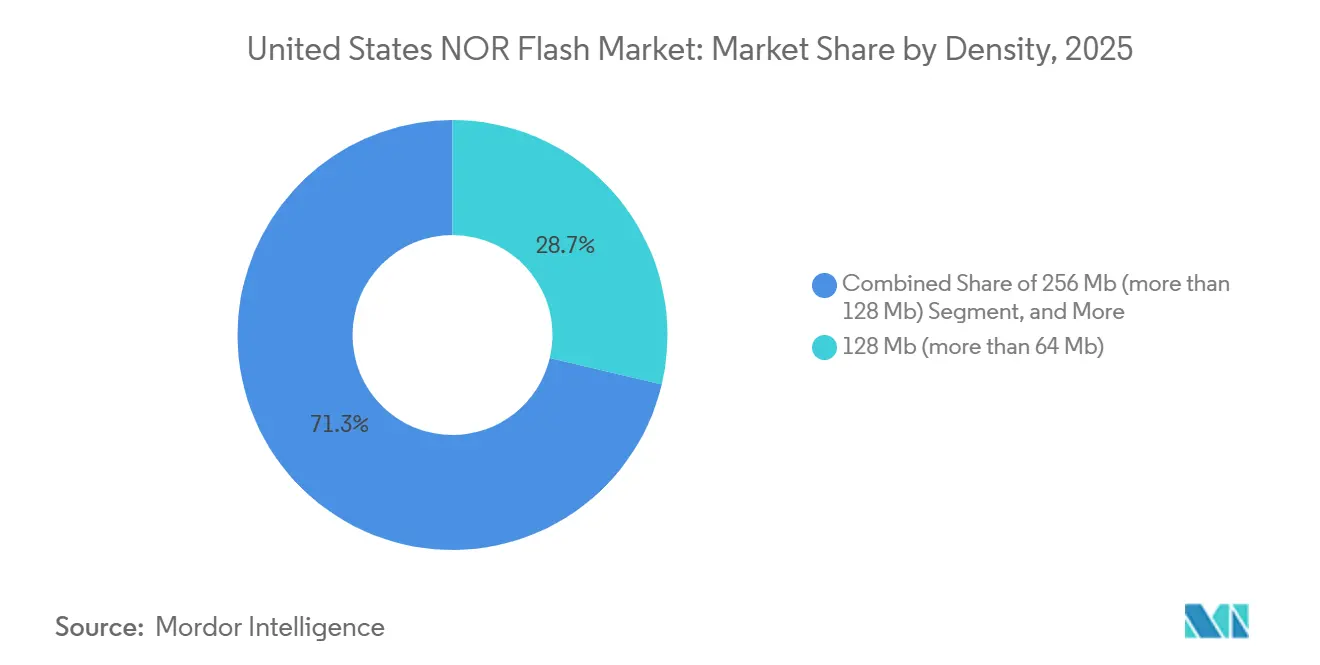
- By density, the 128-megabit tier commanded 28.7% of the United States NOR Flash market in 2025; densities of 256 megabits and above are advancing at an 11.4% CAGR.
- By voltage, the 3 V Class commanded 44.1% of the United States NOR Flash market in 2025; densities of the 1.8 V Class advance at a 9.8% CAGR.
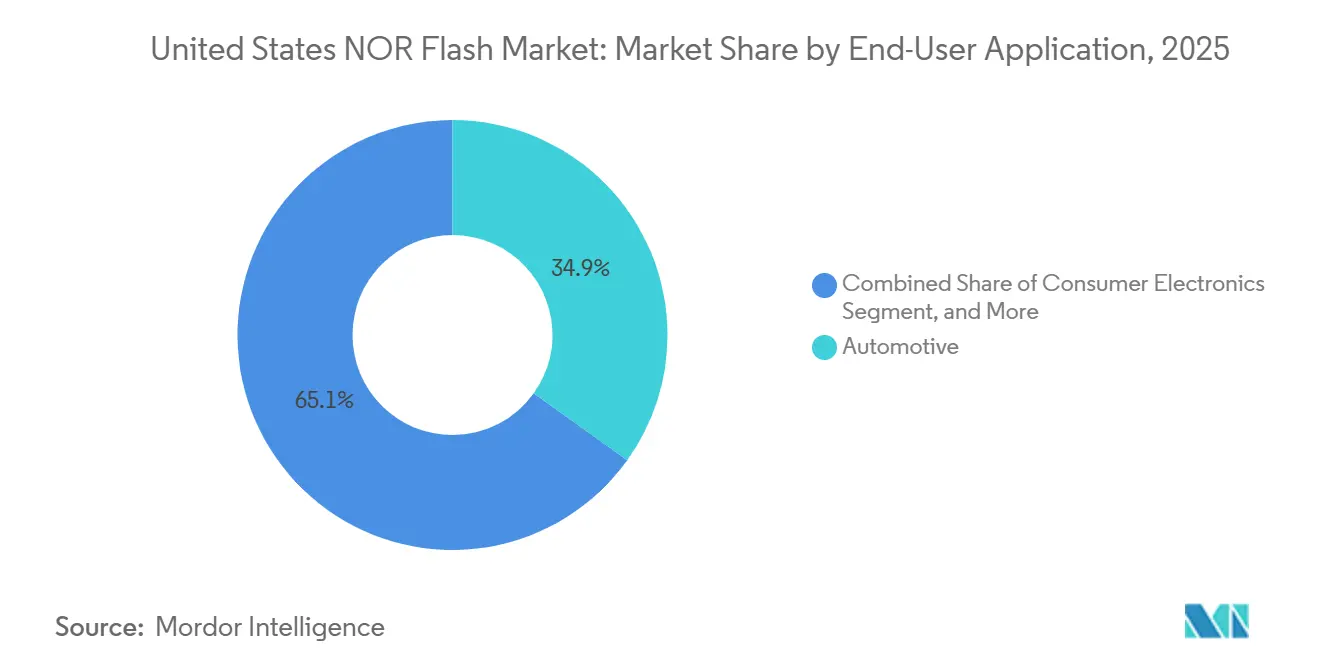
- By end-user application, automotive accounted for 34.9% of the United States NOR Flash market revenue in 2025 and grew at a 10.8% CAGR, outpacing all other segments.
- By process technology node, the 55 nm commanded 31.7% of the United States NOR Flash market size in 2025, and 28 nm and below accelerated at a 11.2% CAGR, outpacing all other segments.
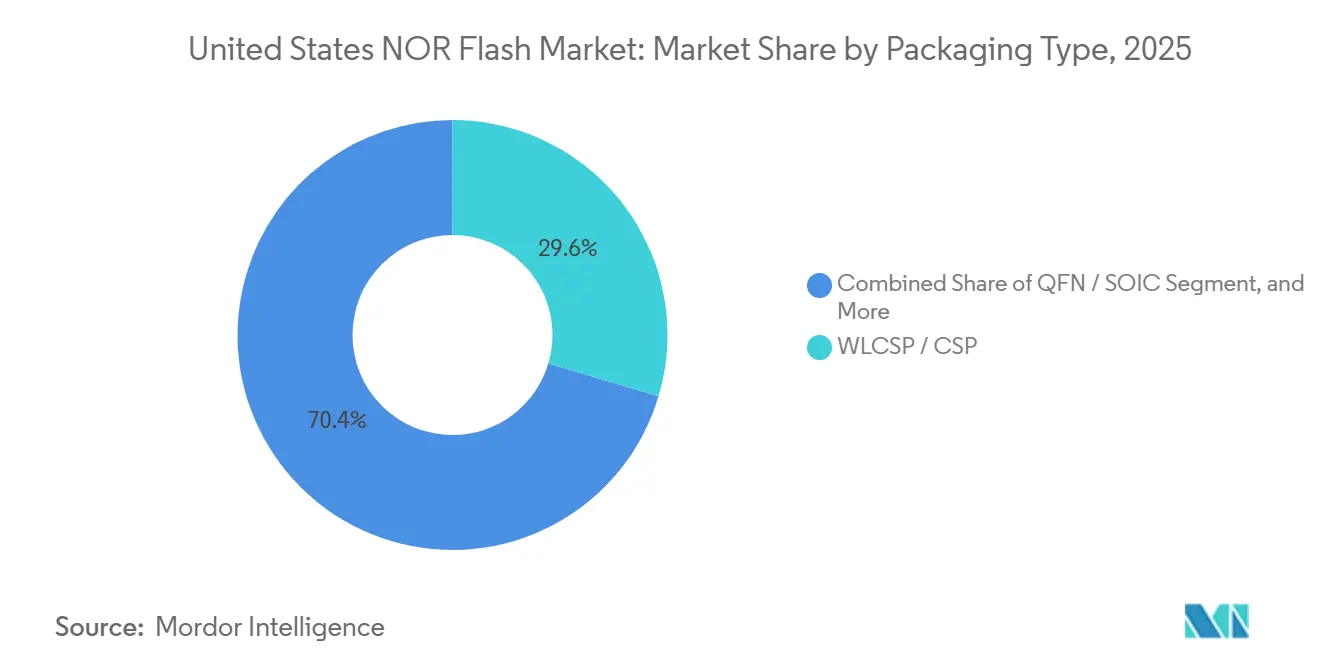
- By packaging type, the WLCSP / CSP commanded 29.6% of the United States NOR Flash market size in 2025 and accelerated at a 9.4% CAGR, outpacing all other segments.
Note: Market size and forecast figures in this report are generated using Mordor Intelligence’s proprietary estimation framework, updated with the latest available data and insights as of January 2026.
Competitive positioning in United states includes both locally based firms and those operating across multiple regions. The market landscape in the global nor flash industry research shows how these players are arranged internationally.
United States NOR Flash Market Trends and Insights
Drivers Impact Analysis*
| Driver | (~) % Impact on CAGR Forecast | Geographic Relevance | Impact Timeline |
|---|---|---|---|
| Surge In Demand for High-Reliability NOR In U.S. ADAS And Functional-Safety ECUs | +0.9% | National, concentrated in Michigan automotive corridor and Southwest EV hubs | Medium term (2-4 years) |
| CHIPS And Science Act Incentives Accelerating Domestic NOR Manufacturing | +1.2% | Arizona, New York, Texas | Long term (≥ 4 years) |
| Rapid Roll-Out of 5G mmWave Base-Stations Driving NOR Code-Storage Demand | +0.7% | Urban Northeast and West Coast markets | Short term (≤ 2 years) |
| Industrial IoT Deployments In Harsh U.S. Environments Needing Instant-Boot Memory | +0.6% | Oil and gas South, Midwest manufacturing, utilities | Medium term (2-4 years) |
| DoD Aerospace and Defense Modernization Requiring Radiation-Tolerant NOR | +0.5% | California, Texas, Arizona, Virginia | Long term (≥ 4 years) |
| Emerging Open-Source RISC-V MCU Ecosystem Standardizing on External NOR for Secure Boot | +0.4% | California design hubs and Northeast R&D corridors | Medium term (2-4 years) |
| Source: Mordor Intelligence | |||
Surge in Demand for High-Reliability NOR in U.S. ADAS and Functional-Safety ECUs
Automakers that are rolling out Level 2+ and Level 3 autonomy now require flash that meets ISO 26262 ASIL-D. Infineon’s Semper family attained that certificate, enabling Tier 1s to reduce redundancy layers while still guaranteeing deterministic boot.[1]Infineon Technologies, “Semper NOR Flash Safety Portfolio,” infineon.com Zonal architectures consolidate many small ECUs into high-performance controllers, lifting density needs to 128 Mb-512 Mb per zone. Tesla’s AI5 platform produced in Texas relies on external serial NOR to isolate safety-critical firmware, and multiyear supply contracts already stretch to the 2029 model year. These factors collectively place serial NOR on the critical path of EV production ramps.
CHIPS and Science Act Incentives Accelerating Domestic NOR Manufacturing
Through July 2025, CHIPS disbursed USD 36.4 billion across 40 projects, three-quarters of which reside in Arizona, New York, and Texas, anchoring memory-capable fabs near automotive and defense clusters.[2]U.S. Government Accountability Office, “Semiconductors: Information on Projects Funded to Strengthen U.S. Supply Chain,” gao.gov Local subsidies narrow the cost gap with Asian production, and Amkor’s Peoria WLCSP line gives automakers an ITAR-compliant packaging option. While wafer starts will not meaningfully add until 2028, customers are already placing take-or-pay orders that secure futures capacity, signaling confidence in a domestically sourced supply chain.
Rapid Roll-Out of 5G mmWave Base-Stations Driving NOR Code-Storage Demand
Nationwide C-band and mmWave deployment forces carriers to add thousands of small cells, each embedding 64 Mb-256 Mb serial NOR for FPGA configuration and secure firmware. Ericsson and Nokia specify automotive-grade parts to withstand rooftop heat cycling, lifting average selling prices relative to consumer Wi-Fi routers.[3]Federal Communications Commission, “5G Spectrum Resources,” fcc.gov Broadband funds under the Infrastructure Investment and Jobs Act extend this build-out through 2028, ensuring a steady, non-cyclical demand stream.
Industrial IoT Deployments in Harsh U.S. Environments Needing Instant-Boot Memory
Oil rigs, substations, and manufacturing lines require deterministic boot in milliseconds, which execute-in-place NOR provides without DRAM shadowing. Rockwell Automation and Schneider Electric validated wide-voltage NOR in predictive-maintenance gateways, confirming 15-year endurance across -40 °C to +125 °C cycles. Department of Energy resilience grants accelerate utility adoption, cementing industrial IoT as the third pillar of demand after automotive and communications.
Restraints Impact Analysis*
| Restraint | (~) % Impact on CAGR Forecast | Geographic Relevance | Impact Timeline |
|---|---|---|---|
| High Fabrication Cost Versus SPI-NAND Beyond 28-Nanometer Nodes | -0.8% | Global consumer and communication markets | Short term (≤ 2 years) |
| Limited Domestic 300-Millimeter Capacity Constraining High-Density NOR Supply | -0.7% | Arizona and New York | Long term (≥ 4 years) |
| Adoption of Embedded MRAM And RRAM as Alternative Code Storage in MCUs | -0.6% | Automotive and industrial design centers | Medium term (2-4 years) |
| Volatility In Critical Process Gas Supply (Neon, Fluorine) Raising Cost Unpredictability | -0.5% | All U.S. fabs | Short term (≤ 2 years) |
| Source: Mordor Intelligence | |||
High Fabrication Cost Versus SPI-NAND Beyond 28-Nanometer Nodes
SPI-NAND achieves a cost of approximately USD 0.015 per Mb at a 1 Gb density on 28 nm technology, making it a more economical choice compared to NOR, which remains above USD 0.05 per Mb. This significant cost difference is prompting cost-sensitive OEMs to transition to SPI-NAND, especially in applications where boot latency is not a critical factor. Foundries are increasingly prioritizing high-margin logic production, leaving NOR confined to older manufacturing equipment. This older equipment lacks the scale-economy advantages that NAND benefits from, further widening the cost gap. As a result, NOR technology struggles to compete in terms of cost efficiency, particularly in high-density applications.
Limited Domestic 300-Millimeter Capacity Constraining High-Density NOR Supply
New semiconductor fabs in Arizona are primarily focused on advanced logic nodes, such as 3 nm and 2 nm, rather than mature-node memory production. Consequently, high-density NOR memory, ranging from 256 Mb to 1 GB, faces challenges in securing sufficient production capacity. These products must compete for the limited 200 mm wafer capacity in Asia, which is already under strain. Any geopolitical disruptions could exacerbate these supply constraints, further limiting production volumes. Despite healthy growth in end-use applications, the constrained supply environment poses a significant challenge for the high-density NOR market.[4]Taiwan Semiconductor Manufacturing Company, “Arizona Fab Roadmap,” tsmc.com
*Our forecasts treat driver/restraint impacts as directional, not additive. The impact forecasts reflect baseline growth, mix effects, and variable interactions.
Segment Analysis
By Type: Serial Dominance Anchored by Automotive and IoT
Serial NOR Flash accounted for 60.9% of the United States NOR Flash market share in 2025, a lead that is widening as automotive OEMs replace bulky parallel devices with quad- and octal-variant devices to trim board size. The trend strengthens the United States NOR Flash market by allowing vendors to upsell secure-boot features at premium margins. Parallel NOR still services defense rad-hard designs and legacy industrial controllers where 15-year form-fit-function commitments override space constraints. Vendors therefore dual-source both interfaces, but volume growth and roadmap investment clearly favor serial parts, keeping parallel revenue flat even as the overall United States NOR Flash market size rises.
Second-generation serial parts offer execute-in-place at 400 MB/s and AES-256 encryption, enabling zonal ECUs to load Linux images directly without DRAM staging. As RISC-V MCUs proliferate, start-ups pick serial NOR for its broad tool-chain support, reinforcing an ecosystem effect that further marginalizes parallel. Consequently, serial NOR becomes the strategic linchpin for automakers, industrial IoT, and 5G infrastructure, while parallel NOR becomes a legacy-harvest play.


By Interface: Octal and xSPI Capture High-Performance Tier
Quad SPI captured 46.2% of revenue in 2025, yet octal and xSPI are growing faster, with a 10.6% CAGR. This growth is driven by the increasing demand for centralized automotive controllers, which require 400 MB/s bandwidth to load redundant firmware images efficiently. The shift is expanding the high-margin segment of the United States NOR Flash market, as designers prioritize speed and deterministic reads over cost per bit. Single- and dual-SPI are gradually being relegated to cost-sensitive consumer segments, while quad-SPI remains the mid-range standard. Octal SPI, on the other hand, is emerging as the premium choice due to its superior performance capabilities.
Octal devices now incorporate advanced features such as differential signaling and ECC, which were previously exclusive to parallel buses. JEDEC’s xSPI 2.0 specification has further enhanced throughput, bringing it closer to PCIe Gen2 levels while maintaining the benefits of low-pin-count packages. This development has significantly reduced the performance gap that once justified the use of parallel interfaces. As OEMs prepare to redesign control units for the 2028 model years, the adoption of xSPI is expected to accelerate. This trend positions xSPI as the leading boot standard for high-reliability applications, solidifying its market position.
By Density: 256-Megabit-Plus Segment Leads Growth Amid Software Bloat
The 128 Mb tier retained 28.7% share in 2025, but Linux-based infotainment stacks and ADAS sensor fusion are driving the need for larger firmware partitions, pushing demand toward 256 MB-1 GB capacities. This shift toward higher densities is boosting the United States NOR Flash market size, as the increase in average selling prices outweighs the penalties associated with larger die sizes. Meanwhile, lower-density parts, particularly those ≤8 Mb, are witnessing a decline as embedded MRAM within microcontrollers eliminates the requirement for external code storage below 64 Mb. This trend highlights the growing preference for higher-density solutions in advanced applications.
To achieve gigabit capacities without relying on new lithography advancements, vendors are stacking two 512 Mb dies within a single BGA or WLCSP package. This approach allows mature 55 nm processes to remain relevant while preserving automotive qualification standards, which are critical for maintaining reliability in automotive applications. Additionally, this strategy serves as a safeguard against the erosion of low-end sockets by embedded alternatives. As a result, the market is experiencing a shift driven by density rather than unit growth, positioning density-driven mix shifts as the primary revenue driver through 2031.

By Voltage: 1.8-Volt Devices Gain as Automotive Migrates to Lower Power
Three-volt NOR accounted for 44.1% of revenue in 2025, yet 1.8 V devices are growing at a 9.8% CAGR because EV makers chase every milliwatt of standby savings. The migration propels the premium tier of the United States NOR Flash market as low-voltage variants feature smaller booster circuits and improved EMI margins. Wide-voltage 1.65 V-3.6 V parts persist in retrofit industrial boards that mix legacy controllers with new sensors, stabilizing a mid-volume niche.
GigaDevice’s 1.2 V octal family targets camera and radar modules where tight thermal envelopes leave little headroom for flash regulators, suggesting that sub-1.8 V will expand once supporting chipsets normalize around lower I/O rails. Voltage segmentation, therefore, mirrors both process scaling and power-reduction imperatives across mobility and edge compute.
By End-User Application: Automotive Segment Outpaces All Others
Automotive contributed 34.9% of the 2025 revenue and experienced a 10.8% CAGR, driven by ISO 26262 standards that prioritize deterministic read latency and long data retention. The adoption of zonal ECUs has replaced multiple 32 Mb parts with single 256 Mb-512 Mb secure NOR chips, significantly increasing the dollar content per vehicle and strengthening supplier relationships. Communication equipment ranked second, accounting for 28.3% of the revenue, supported by the expansion of 5G macro and small-cell networks. These networks often incorporate dual 128 Mb devices to ensure fail-safe updates, further boosting demand in this segment.
The industrial sector ranked third, contributing 21.7% of the revenue, with consistent demand from utilities and the oil-and-gas industry. This sector prioritizes extended-temperature grades over higher densities, ensuring reliability in harsh environments. Consumer electronics accounted for 10.4% of the revenue, as smartphones increasingly adopt SPI-NAND or UFS technologies, leaving BIOS chips in PCs as the primary volume driver. Aerospace and defense, while representing only 4.7% of the market, generate substantial profits per bit due to the high premiums associated with radiation-hardened components. This segment remains protected from emerging Chinese competitors due to its specialized requirements and high barriers to entry.
By Process Technology Node: 28 Nm and Below Gains Despite Cost Headwinds
The 55 nm node commanded 31.7% share, offering a balanced trade-off between yield, cost efficiency, and its established use in automotive applications. This node remains a popular choice due to its reliability and compatibility with existing automotive standards. However, nodes at 28 nm and below are experiencing an 11.2% CAGR as manufacturers adopt advanced lithography techniques. These techniques help reduce active power consumption and increase density without relying on charge-trap cells. In January 2026, United Microelectronics and Silicon Storage Technology achieved automotive Grade 1 qualification for embedded SuperFlash on 28 nm, further validating this node for discrete migration and expanding its adoption in the automotive sector.
Older nodes, such as those at 90 nm and above, continue to serve niche markets like defense rad-hard applications and long-tail industrial replacements. However, their production capacity is increasingly constrained as foundries shift 200 mm lines toward manufacturing SiC power devices. This shift reflects the growing demand for SiC technology in power applications, limiting the availability of older nodes. As a result, process technology segmentation is now more influenced by application criticality rather than pure economic considerations. Additionally, the inclusion of feature-rich security blocks is becoming a priority, surpassing the importance of minimizing raw die size in many applications.
By Packaging Type: WLCSP Expands in Automotive and Wearables
WLCSP held 29.6% of 2025 revenue and grew at a 9.4% CAGR, primarily due to its ability to enable zero-stand-off integration in applications like ADAS cameras and smartwatches. This packaging technology is increasingly favored for its compact size and efficiency, making it ideal for modern electronic devices. Additionally, its growing adoption aligns with the demand for miniaturized components in consumer electronics. The technology's compatibility with advanced manufacturing processes further supports its market growth. Peoria’s new Amkor line, offering ITAR-compliant WLCSP, has also contributed to reducing lead times and aligning with CHIPS reshoring objectives.
Quad flat no-lead packages maintain a 38.7% market share, as industrial customers continue to prefer gull-wing packages that can withstand multiple rework cycles. This packaging type remains a reliable choice for applications requiring durability and ease of assembly. Fine-pitch BGA, on the other hand, secures 24.1% of the market, driven by its suitability for high-density automotive controllers where signal integrity is critical. The demand for these packages is further supported by advancements in automotive electronics and the increasing complexity of vehicle systems. Together, these packaging technologies cater to diverse industry needs, ensuring steady market growth.
Geography Analysis
The West led the United States NOR Flash market, powered by California’s design ecosystem and Arizona’s multi-billion-dollar fab cluster. TSMC’s and Intel’s investments have brought advanced-logic expertise closer to flash suppliers, even though most NOR wafers are still imported from Asia. The region benefits from co-located EDA, IP, and AI accelerator teams, which integrate serial NOR into automotive SoCs and datacenter boards during the design-win phase. This synergy creates a self-sustaining regional loop, driving innovation and market growth. Additionally, the West's established infrastructure and skilled workforce further solidify its leadership in the NOR Flash market.
The South is the fastest-growing region in the market. Texas has emerged as a hub, combining EV gigafactories, Samsung’s Taylor fab, and hyperscale datacenters. Tesla’s zonal ECUs and Oracle’s edge-AI clusters rely heavily on instant-boot flash, boosting cross-industry procurement in the region. State-level advantages, such as lower power costs and abundant open land, attract suppliers to establish integrated operations, including wafer production, OSAT, and systems integration. This strategic bundling within a single logistics corridor positions the South as a key player in the NOR Flash market's expansion.
The Northeast is driven by GlobalFoundries’ Malta line and Micron’s ambitious Clay project. The region's dense network of universities and defense labs fosters R&D in radiation-tolerant and secure-boot technologies, making it a niche center for high-reliability flash IP. This focus on specialized applications ensures steady demand for advanced NOR Flash solutions. Meanwhile, the Midwest contributes to the market by leveraging Ohio’s emerging fabs and Michigan’s Tier 1 suppliers. However, the Midwest remains dependent on other regions for mature-node wafers. Overall, the geographical distribution reflects the broader reshoring trend, where policy, power pricing, and industrial bases converge to reshape the NOR Flash supply chain.
Mordor Intelligence tracks the nor flash market across other major regions such as Europe and Asia, with additional country-level coverage spanning Mexico, Germany, South Korea, Japan, Italy, United Kingdom, and France, each reflecting localized structural drivers, restraints and more.
Competitive Landscape
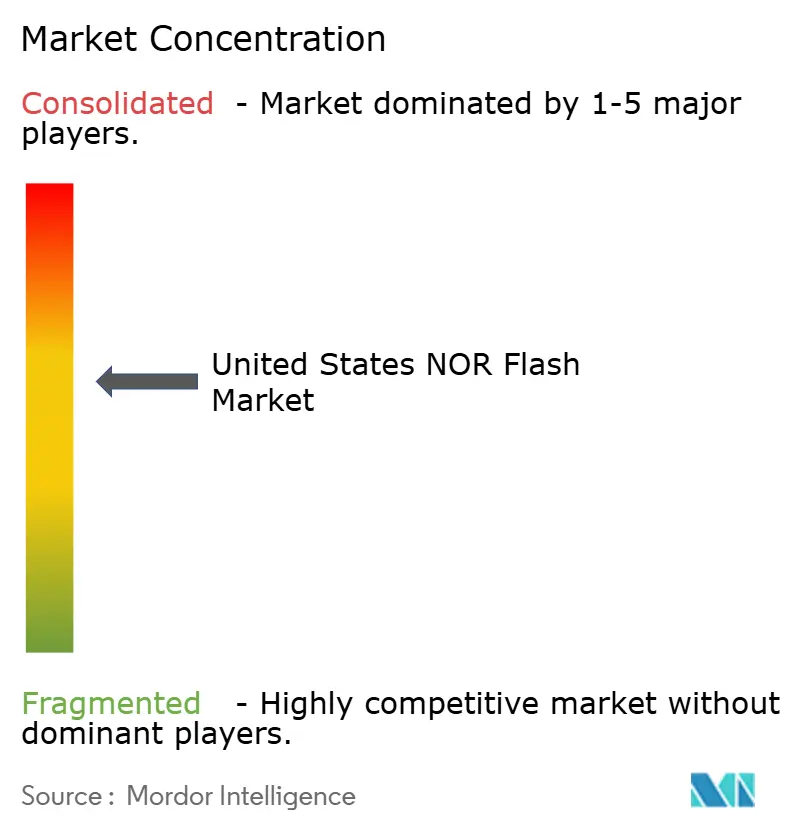
Revenue concentration remains moderate, with the top five Infineon, Micron, Winbond, Macronix, and GigaDevice controlling about 65% of the United States NOR Flash market. These companies dominate due to their established expertise, robust supply chains, and adherence to stringent industry certifications. Chinese entrants are attempting to disrupt the market by offering competitive pricing, particularly in Tier 2 communication equipment. However, sectors like automotive and defense continue to favor established players with ISO 26262, ITAR, and QML qualifications. The competitive landscape is shifting, with innovation now focusing on hardware root-of-trust and secure update protocols rather than just density. This strategic pivot allows incumbents to maintain their margins while offering differentiated products.
Winbond’s ASIL-D-certified W35T octal family and Macronix’s ArmorBoot exemplify the industry's move toward security-centric innovation. These advancements address the growing demand for secure and reliable flash memory in critical applications. Micron’s USD 1.8 billion acquisition of Powerchip’s fab in January 2026 further strengthens its vertical integration capabilities. However, this move also increases its exposure to geopolitical risks, which could impact supply stability. Supply constraints remain a significant challenge, as highlighted by Winbond’s two-year sell-out notice, which underscores the importance of long-term allocation guarantees. Such dynamics are helping to stabilize pricing and reward vendors capable of ensuring consistent supply.
Embedded MRAM is emerging as a potential threat to low-density NOR flash, particularly in applications requiring high endurance and speed. To counter this, NOR flash vendors are shifting their focus to 128-Mb to 1-Gb densities, which cater to a broader range of applications. Additionally, they are bundling secure-element features to enhance product value and meet evolving customer needs. This strategic realignment allows vendors to target specialized, high-reliability niches, such as automotive and industrial sectors. Despite shrinking consumer volumes in commodity markets, the focus on high-margin applications has enabled the industry to maintain average gross margins above 40%. This approach ensures sustained profitability while adapting to changing market demands.
United States NOR Flash Industry Leaders
Infineon Technologies AG
Micron Technology Inc.
Winbond Electronics Corporation
Macronix International Co. Ltd.
GigaDevice Semiconductor Inc.
- *Disclaimer: Major Players sorted in no particular order

Recent Industry Developments
- February 2026: Winbond announced a two-year sell-out across NOR, DRAM, and SLC NAND portfolios and committed USD 1.35 billion in new capacity.
- January 2026: Micron agreed to acquire Powerchip’s P5 Tongluo campus for USD 1.8 billion to expand 300 mm DRAM output.
- January 2026: SST and UMC attained automotive Grade 1 for 28 nm SuperFlash Gen 4 embedded NOR, opening a pathway for discrete migration.
- December 2025: GAO detailed CHIPS Act awards totaling USD 36.4 billion across 19 states.


Research Methodology Framework and Report Scope
Market Definitions and Key Coverage
Our study defines the United States NOR flash memory market as the annual revenue earned from stand-alone serial and parallel NOR chips sold into domestic consumer electronics, communications hardware, automotive control units, industrial automation systems, aerospace, and defense designs.
Scope exclusion: NAND flash, phase-change, MRAM/RRAM, and embedded NOR blocks that ship inside microcontrollers or SoCs are outside the study.
Segmentation Overview
- By Type (Value, Volume)
- Serial NOR Flash
- Parallel NOR Flash
- By Interface (Value)
- SPI Single / Dual
- Quad SPI
- Octal and xSPI
- By Density (Value)
- 2 Megabit and Less NOR
- 4 Megabit (More than 2 Mb) NOR
- 8 Megabit (More than 4 Mb) NOR
- 16 Megabit (More than 8 Mb) NOR
- 32 Megabit (More than 16 Mb) NOR
- 64 Megabit (More than 32 Mb) NOR
- 128 Megabit (More than 64 Mb) NOR
- 256 Megabit (More than 128 Mb) NOR
- Greater than 256 Megabit
- By Voltage (Value)
- 3 V Class
- 1.8 V Class
- Wide-Voltage (1.65 V - 3.6 V)
- Sub-1.8 V Classes (1.2 V, 2.5 V, 5 V)
- By End-User Application (Value, Volume)
- Consumer Electronics
- Communication
- Automotive
- Industrial
- Other End-User Applications
- By Process Technology Node (Value)
- 90 nm and Older
- 65 nm
- 55 nm
- 45 nm
- 28 nm and Below
- By Packaging Type (Value)
- WLCSP / CSP
- QFN / SOIC
- BGA / FBGA
- Other Packaging Types
Detailed Research Methodology and Data Validation
Primary Research
Mordor analysts held structured interviews with procurement managers at automotive ECU makers, consumer device ODMs, U.S. defense contractors, distributors, and foundry/OSAT executives. Follow-up surveys captured prevailing ASP bands, inventory run-rates, and fab utilization swings, enabling us to reconcile desk-research gaps and triangulate assumptions.
Desk Research
We built our base with public datasets from the U.S. Bureau of Economic Analysis, International Trade Commission shipment codes, and Customs import records, which reveal unit flows and average declared values. Technical cues came from Semiconductor Industry Association briefs, JEDEC interface roadmaps, and SAE functional-safety standards for vehicles. Company 10-Ks, investor decks, and Dow Jones Factiva news helped map capacity shifts, while Questel patent analytics flagged upcoming density transitions. The sources listed are illustrative; many additional references supported data collection, validation, and clarification.
Market-Sizing & Forecasting
A top-down model starts with U.S. electronics production value, applies NOR-dependent penetration ratios, and is checked against import-export reconciliations. Select bottom-up roll-ups of distributor sell-in volumes multiplied by sampled ASPs fine-tune totals. Key variables include 5Gbase-station installations, ADAS attach rates, SPI share shifts, average die density, and CHIPS-Act driven domestic wafer starts. Forecasts employ multivariate regression blended with scenario analysis to capture cyclical order patterns; every assumption is stress-tested with expert respondents. Missing data on niche military-grade parts are bridged through three-year moving averages anchored to Department of Defense budget outlays.
Data Validation & Update Cycle
Analysts run anomaly checks against quarterly earnings, customs filings, and SIA billings, then re-contact sources if variances exceed thresholds. Each model passes dual peer review and refreshes annually, with mid-cycle revisions triggered by major events such as plant fires, sanctions, or large mergers.
Why Our United States NOR Flash Baseline Commands Reliability
Estimates from different publishers often diverge because they slice the market by geography, memory type, or density in unique ways and refresh on uneven cadences.
Benchmark comparison
| Market Size | Anonymized source | Primary gap driver |
|---|---|---|
| USD 498.21 million (2025) | Mordor Intelligence | - |
| USD 1.20 billion (2023) | Regional Consultancy A | Covers all of North America and counts industrial-grade microcontroller NOR, inflating value |
| USD 400 million (2022) | Trade Journal B | Tracks only SPI NOR below 256 Mb, excludes automotive and defense demand |
| USD 6.00 billion (2024) | Industry Tracker C | Blends NOR with NAND and embedded flash, reallocates global sales to the U.S. |
The table shows how scope stretch, product mix, and year misalignment can swing totals dramatically. By anchoring to clearly defined boundaries, triangulated variables, and a transparent yearly cadence, Mordor Intelligence provides a dependable baseline that decision-makers can trace and replicate with confidence.


Key Questions Answered in the Report
What is the 2026 United States NOR Flash market size?
The United States NOR Flash market size stands at USD 524.62 million in 2026, on track to reach USD 679.18 million by 2031, according to Mordor Intelligence.
Which application segment is growing the fastest?
Automotive is the fastest-growing segment, advancing at a 10.8% CAGR as ISO 26262 safety mandates and over-the-air update architectures favor deterministic NOR Flash, notes Mordor Intelligence.
Why are octal and xSPI interfaces gaining traction?
Octal and xSPI deliver up to 400 MB/s read bandwidth and built-in ECC, meeting throughput needs of zonal ECUs and 5G radios while keeping pin count low.
How does the CHIPS Act affect domestic NOR supply?
CHIPS funding steers new wafer and packaging capacity to Arizona, New York, and Texas, reducing future reliance on Asian mature-node fabs and supporting supply-chain security.
Will embedded MRAM replace all low-density NOR?
Embedded MRAM is displacing 64 Mb external NOR in some MCUs, but densities above 128 Mb still favor discrete NOR due to cost, qualification heritage, and execute-in-place performance.
Which vendors lead the high-reliability NOR space?
Infineon, Micron, Winbond, Macronix, and GigaDevice dominate high-reliability NOR by combining automotive-grade qualification, security features, and long-term supply agreements.
Page last updated on:


