
Telecom Capex Prioritization Tracker Market Size and Share
Market Overview
| Study Period | 2020 - 2031 |
|---|---|
| Market Size (2026) | USD 1.41 Billion |
| Market Size (2031) | USD 2.75 Billion |
| Growth Rate (2026 - 2031) | 14.29 % |
| Fastest Growing Market | Asia-Pacific |
| Largest Market | North America |
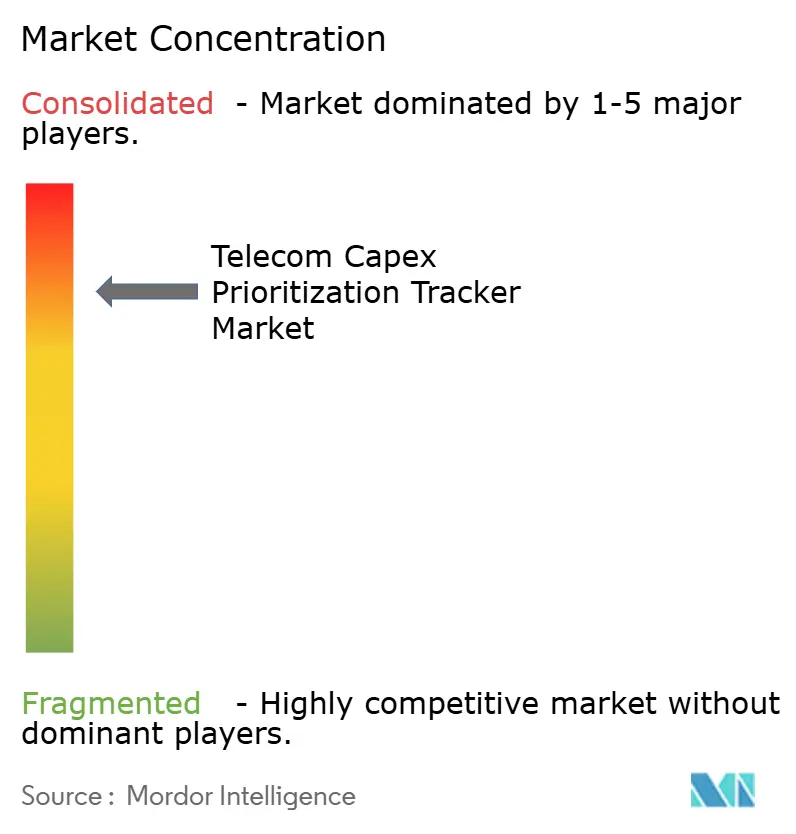
| Market Concentration | High |
Major Players *Disclaimer: Major Players sorted in no particular order Image © Mordor Intelligence. Reuse requires attribution under CC BY 4.0. | |
Telecom Capex Prioritization Tracker Market Analysis by Mordor Intelligence
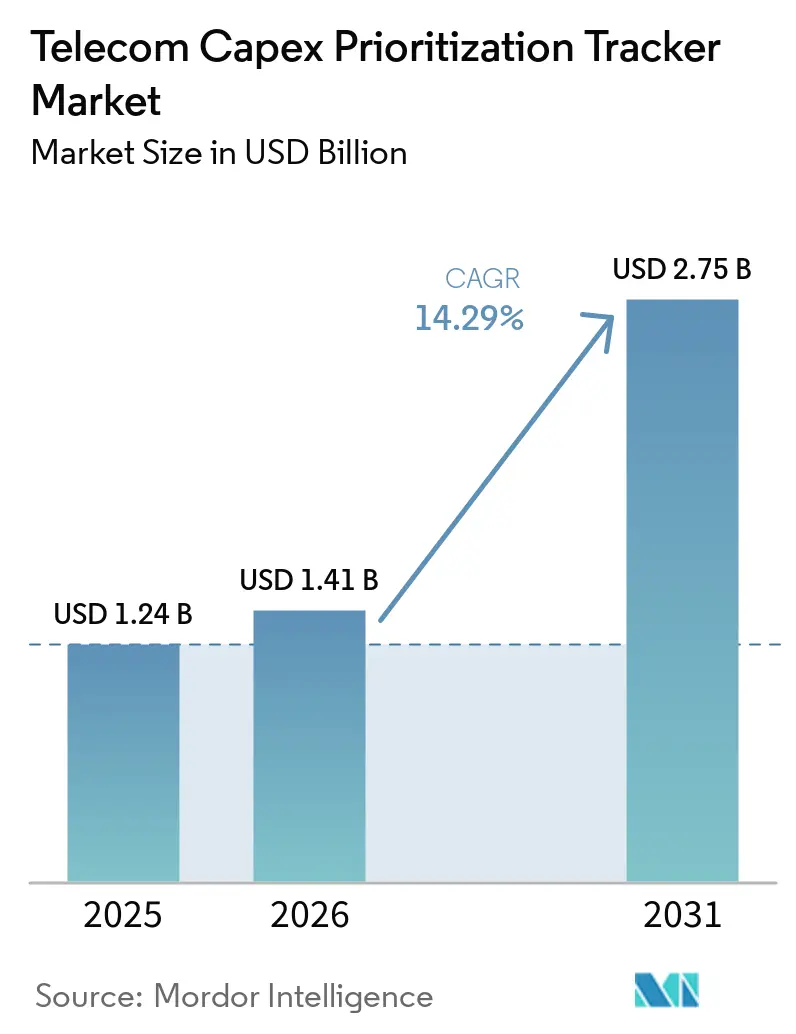
The Telecom Capex Prioritization Tracker Market size was valued at USD 1.24 billion in 2025 and estimated to grow from USD 1.41 billion in 2026 to reach USD 2.75 billion by 2031, at a CAGR of 14.29% during the forecast period (2026-2031). The spending mix is shifting from broad-coverage programs toward capacity, software, transport, and fiber projects that support increasingly dense networks. Commercial 5G Standalone launches reached 95 operators by March 2026, while 35 operators were investing in 5G-Advanced, which increases the need to track software, core, and transport commitments alongside radio deployments. Demand for data-center interconnect capacity also changes the timing of network investment because cloud and AI workloads require fiber routes and optical capacity on schedules that may not match traditional mobile planning cycles. Digital sovereignty and public connectivity programs create procurement needs that can persist even when commercial network investment is selective, including the European Union’s Digital Networks Act and India’s domestic data storage requirements. The Telecom Capex Prioritization Tracker Market, therefore, depends on the ability to distinguish between declining broad-based equipment budgets and the project types that remain essential for fiber, cloud connectivity, and network automation.
Key Report Takeaways
- By investment category, radio access network equipment led with 38.24% revenue share in 2025, while fiber and fixed broadband infrastructure are forecast to expand at a 15.47% CAGR through 2031.
- By technology, 5G network infrastructure accounted for 42.13% of the Telecom Capex Prioritization Tracker Market size in 2025, while fiber-to-the-premises is forecast to grow at a 16.27% CAGR through 2031.
- By network asset type, wireless access held 41.23% revenue share in 2025, while wireless X-Haul and packet core are expected to record a 15.68% CAGR through 2031.
- By capex source, mobile network operators accounted for 61.24% of spending in Telecom Capex Prioritization Tracker Market 2025, while infracos and tower companies are projected to advance at a 16.13% CAGR through 2031.
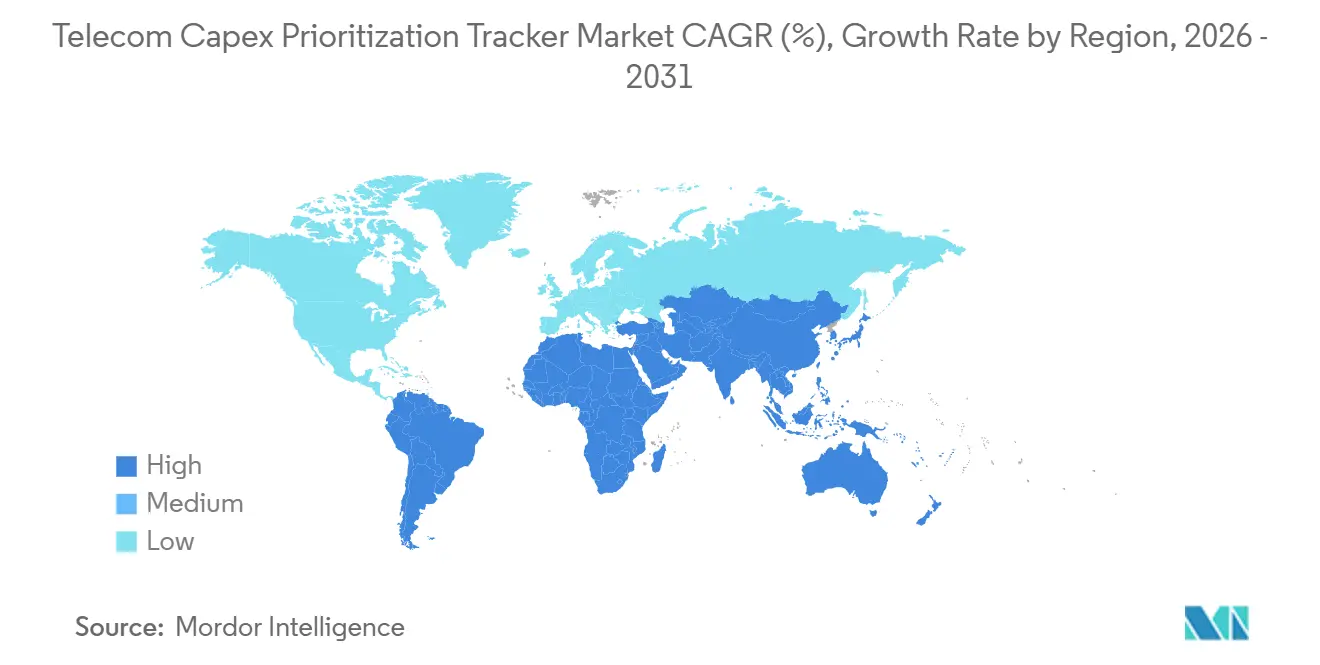
- By geography, North America held 31.24% revenue share in 2025, while Asia-Pacific is projected to register the fastest regional CAGR at 15.83% through 2031.
Note: Market size and forecast figures in this report are generated using Mordor Intelligence’s proprietary estimation framework, updated with the latest available data and insights as of January 2026.
Market Trends and Insights
Drivers Impact Analysis of Telecom Capex Prioritization Tracker Market*
| Driver | (~) % Impact on CAGR Forecast | Geographic Relevance | Impact Timeline |
|---|---|---|---|
| 5G Standalone and Network Densification | +3.8% | Global, concentrated in North America, Asia-Pacific, and Europe, Middle East, and Africa | Short term (≤ 2 years) |
| Fiber Broadband and Fixed Wireless Access Expansion | +3.1% | North America and Asia-Pacific, with spillover to Europe and South America | Medium term (2-4 years) |
| AI Data-Center Interconnect and Cloud-Native Network Investment | +2.4% | Global, concentrated in North America, East Asia, and the Singapore, Malaysia, and Thailand corridor | Medium term (2-4 years) |
| Public-Sector Connectivity and Digital-Sovereignty Programs | +1.3% | Europe, India, the Middle East, and Africa | Long term (≥ 4 years) |
| Energy-Efficient Network Modernization and Automation | +0.9% | Global, with early gains in Western Europe and East Asia | Medium term (2-4 years) |
| 6G Research and Pre-Commercial Infrastructure Commitments | +0.5% | East Asia and early European, Middle Eastern, and African adopters | Long term (≥ 4 years) |
| Source: Mordor Intelligence | |||
5G Standalone and Network Densification
The transition from 5G Non-Standalone to Standalone architecture is a central capital allocation signal for the Telecom Capex Prioritization Tracker Market. By March 2026, 95 operators had commercially launched 5G Standalone services, 42% more than in the first quarter of 2025.[1] The same source reported that 35 operators were investing in 5G-Advanced and 11 had launched commercial services. These projects require upgrades to packet cores, orchestration systems, transport links, and radio networks rather than isolated radio equipment purchases. China had 4.838 million 5G base stations at the end of 2025, and 5G-Advanced coverage had expanded to more than 330 cities, creating a need for X-Haul and core capacity, even as the radio layer has already grown. This makes deployment status, software readiness, and transport constraints important inputs for spending priorities.
Fiber Broadband and Fixed Wireless Access Expansion
Fiber programs are becoming a larger part of the Telecom Capex Prioritization Tracker Market because they support residential broadband, mobile backhaul, and enterprise connectivity. AT&T announced a five-year U.S. investment plan exceeding USD 250 billion in March 2026, with fiber expansion toward 40 million locations by the end of 2026 and 60 million by 2030. T-Mobile committed USD 2.7 billion to 2 fiber joint ventures in April 2026, targeting 1.8 million additional fiber passings by the end of 2026. Fixed wireless access is also becoming a coordinated complement to fiber rather than only a rural alternative. Fiber assets can serve broadband customers and provide routes for mobile and data-center traffic, which makes their allocation more complex than a single access-network line item. These combined uses sustain the Telecom Capex Prioritization Tracker Market as operators coordinate fixed and wireless capital plans.
AI Data-Center Interconnect and Cloud-Native Network Investment
AI infrastructure is directing more network capital toward data-center interconnect and cloud-ready transport. Nokia stated that annual inter-facility traffic was growing at 23%, while intra-data-center traffic was growing at 65%, increasing demand for optical systems that reduce power, space, and cost per bit. HKT announced plans in July 2026 for a 3.2 Tbps ultra-low-latency data-center interconnect route in Hong Kong, with the first phase expected to be completed by the end of 2026. KT outlined a three-year KRW 18 trillion investment plan, equivalent to USD 11.73 billion, including KRW 8 trillion, equivalent to USD 5.22 billion, for next-generation network technologies. These commitments move some transport decisions beyond the normal timing of mobile coverage programs. The Telecom Capex Prioritization Tracker Market must therefore account for cloud demand, optical capacity, and data-center locations when identifying investment priorities.
Public-Sector Connectivity and Digital-Sovereignty Programs
Public-sector requirements support network projects that are less dependent on short-term subscriber returns. The European Union adopted the Digital Networks Act in January 2026, establishing a Single Passport authorization framework and an infrastructure preparedness plan for resilient connectivity.[2] The IRIS² program, valued at EUR 10.6 billion (USD 11.5 billion), entered its design and development phase in 2025 and is scheduled for deployment from 2029 to 2030. India required authorized telecom infrastructure entities to store network data, logs, and related information within the country from July 2025.[3] Portugal’s National Sovereign Cloud Plan for 2026 to 2027 also sets a cloud-first infrastructure framework for public administration. These policy schedules can create a minimum level of network and cloud investment, supporting the Telecom Capex Prioritization Tracker Market during periods of weaker commercial spending.
Restraints Impact Analysis of Telecom Capex Prioritization Tracker Market*
| Restraint | (~) % Impact on CAGR Forecast | Geographic Relevance | Impact Timeline |
|---|---|---|---|
| Mature-Market Capital-Intensity Normalization | -1.5% | China, Western Europe, Japan, and South Korea | Medium term (2-4 years) |
| Vendor Inventory Correction and Uneven 5G Monetization | -1.1% | Global, most acute in North America and Asia-Pacific | Medium term (2-4 years) |
| Multi-Year Procurement Locks Reduce Tracker Responsiveness | -0.7% | Global, most acute in markets with large incumbent operators | Medium term (2-4 years) |
| Power, Site, and Backhaul Readiness Gaps Delay Deployment | -0.5% | Africa, South and Southeast Asia, and parts of South America | Long term (≥ 4 years) |
| Source: Mordor Intelligence | |||
Mature-Market Capital-Intensity Normalization
Initial 5G buildouts have passed their peak in several advanced markets, leaving operators to focus on selected upgrades and maintenance. China Mobile planned CNY 136.6 billion (USD 18.9 billion) in capital expenditure for 2026, 9.5% lower than the prior year. Its computing power investment grew 62.4% to CNY 37.8 billion (USD 5.6 billion), while communications network investment declined by 20.3%. Deutsche Telekom invested EUR 16.9 billion (USD 18.3 billion) in network infrastructure in 2025, indicating an ongoing commitment but a mature maintenance and upgrade profile. This shift makes it harder to compare spending categories because compute and cloud projects sit close to conventional telecommunications network budgets. The Telecom Capex Prioritization Tracker Market needs to separate these uses without assuming that lower total equipment spending reflects lower demand for every network asset.
Vendor Inventory Correction and Uneven 5G Monetization
Inventory adjustments after the 2022 to 2024 procurement surge are limiting some equipment orders. As of April 2026, 5G Standalone services represented 29% of launched 5G deployments, and only 11 operators had commercially launched 5G-Advanced. Operators that have not established clear revenue gains from network slicing or low-latency services may delay discretionary upgrades. China Mobile’s 2025 to 2026 procurement covered 397,500 5G wireless sites, indicating continuing demand but lower volumes than the earlier peak period. Delayed Standalone deployments can also leave a mismatch between radio capacity and packet-core readiness. The Telecom Capex Prioritization Tracker Market must recognize these pause cycles while identifying operators that still require investment in core software, transport, or densification.
*Our forecasts treat driver/restraint impacts as directional, not additive. The impact forecasts reflect baseline growth, mix effects, and variable interactions.
Telecom Capex Prioritization Tracker Market Segment Analysis
By Investment Category:
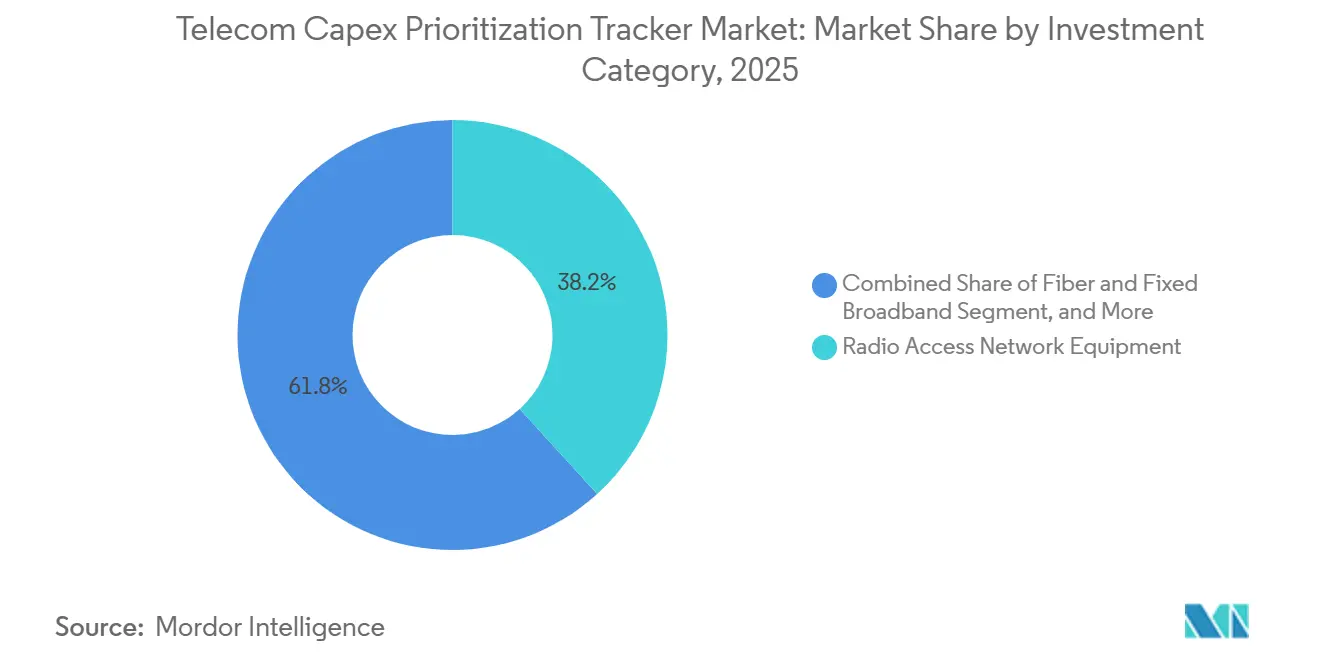
Radio Access Leads While Fiber and Fixed Broadband Gain PriorityRadio access network equipment held 38.24% of the Telecom Capex Prioritization Tracker Market share in 2025. Its position reflects the continued use of mid-band 5G for coverage depth and capacity in urban, suburban, and enterprise locations. These purchases commonly include radio units, site integration, spectrum-specific optimization software, and multi-year vendor commitments within the Telecom Capex Prioritization Tracker Market. Core network infrastructure is also important because a 5G Standalone transition needs packet-core and orchestration upgrades alongside radio work. Installation and maintenance create a recurring demand stream as operators retire 3G and copper assets and replace equipment that cannot remain in service.[4]
Fiber and fixed broadband infrastructure are forecast to register a 15.47% CAGR from 2026 to 2031, the highest rate in this segmentation. Fiber-to-the-premises programs are extending into secondary cities and rural areas across North America, Asia-Pacific, and Europe. A broadband fiber route can also serve as a dark-fiber path for data-center customers, creating separate revenue uses for the same physical asset. Nokia participated in an AI-optimized optical transport route in North Dakota designed for up to 400 Tbps, linking a major data-center development with the Chicago metropolitan area. The others category includes Open RAN software, satellite backhaul integration, and private 5G equipment, which may require separate tracking as adoption increases.

By Technology:
5G Infrastructure Holds the Largest Budget While FTTP Grows Fastest5G network infrastructure accounted for 42.13% of spending by technology in 2025. The share reflects incomplete coverage programs in emerging economies and the 5G Standalone upgrade cycle in advanced economies. Both use cases maintain 5G as the leading budget line, although their underlying investment reasons differ. Operators need radio, core, and transport components to deliver Standalone services effectively. The development of 5G-Advanced adds another layer of software and network-control requirements for the Telecom Capex Prioritization Tracker Market.
Fiber-to-the-premises is projected to expand at a 16.27% CAGR from 2026 to 2031. T-Mobile’s USD 2.7 billion joint-venture commitment and AT&T’s planned fiber build show the scale of current fiber investment in the United States. 4G LTE maintenance remains necessary where 5G coverage is incomplete and in private-network applications that favor established reliability. The USD 42.5 billion BEAD program supports a public and private procurement pipeline for broadband equipment. Other technologies include satellite backhaul and Open RAN, with the pace of commercial deployment shaping the technology mix through 2031.
By Network Asset Type:
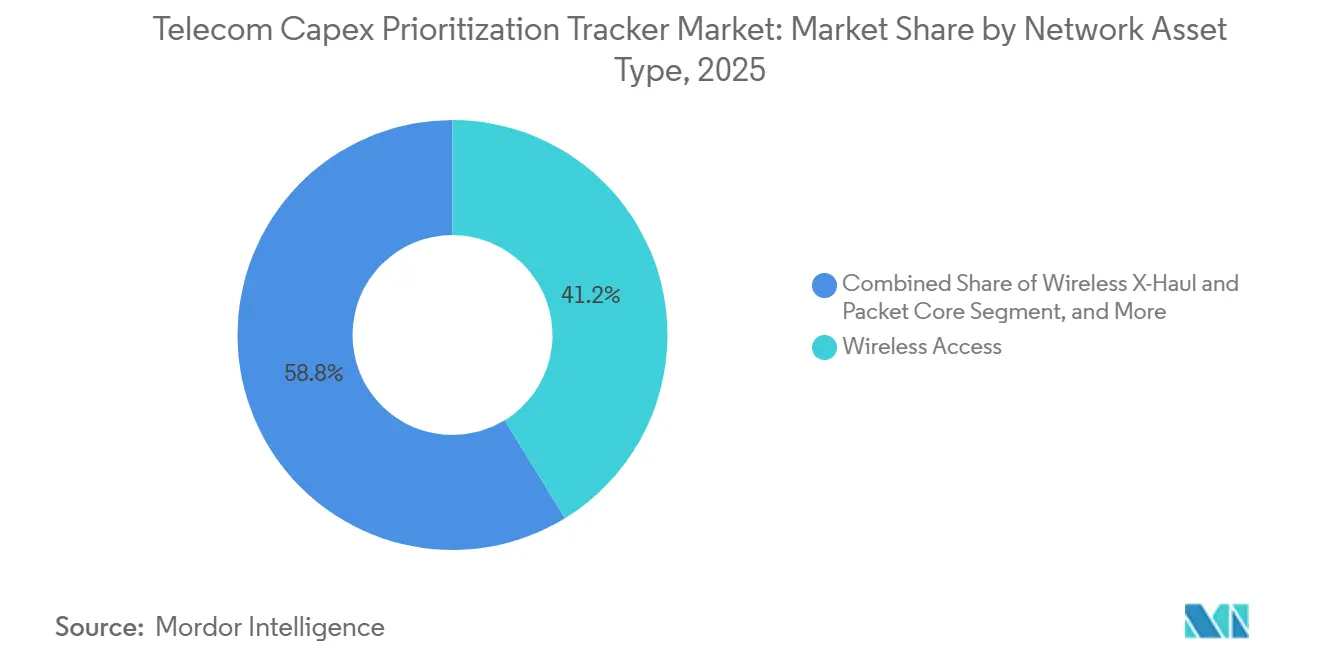
Wireless Access Remains Largest While X-Haul and Packet Core AccelerateWireless access held 41.23% of spending by network asset type in 2025. This includes macro-cell sites, small cells, radio units, and related infrastructure, all of which remain central to operator budgets. Dense radio deployments increase pressure on fronthaul, midhaul, backhaul, and core networks. NTT DOCOMO completed Japan’s first commercial deployment of Ericsson’s RAN Processor 6672 in July 2026, reporting up to 4 times the capacity of the previous generation and more than 50% lower energy consumption. Wireline access also continues to play a role as operators replace copper connections with fiber-based access.
Wireless X-Haul and packet core are projected to grow at a 15.68% CAGR from 2026 to 2031. The rate reflects a capacity bottleneck that can emerge when radio layers are densified before the underlying transport and packet core are expanded. Ceragon secured a five-year USD 70 million agreement in July 2026 with a tier-1 Asia-Pacific mobile operator to expand and modernize 4G and 5G transport networks. Transport networks remain necessary for mobile backhaul and fixed broadband aggregation, including extending 400G optical transport from the backbone to the metro layers. Other assets include satellite backhaul nodes, private-network edge infrastructure, and non-terrestrial transport.
By Capex Source:
Mobile Network Operators Lead While Infracos and Tower Companies ExpandMobile network operators accounted for 61.24% of the Telecom Capex Prioritization Tracker Market in 2025. Major operators, including AT&T, Verizon, T-Mobile, Deutsche Telekom, China Mobile, NTT DOCOMO, and Reliance Jio, continue to drive purchases of radio, core, and transport equipment. Their spending schedules strongly influence vendor revenue recognition and the timing of deployment programs. Fixed broadband operators represent a smaller but growing buyer group as they replace last-mile copper connections and build gigabit access networks. The others category includes enterprise private-network users and cable operators that are extending mobile services through MVNO agreements or spectrum strategies.
Infracos and tower companies are forecast to grow at a 16.13% CAGR from 2026 to 2031. Sale-and-leaseback transactions transfer passive network assets from operators to independent owners, while infracos are becoming investors in fiber conduits and data-center-adjacent assets. Ooredoo reported QAR 4.6 billion (USD 1.26 billion) in strategic capital expenditure in 2025 across data centers, 5G rollout, and tower consolidation. Once these owners acquire passive assets, they also take responsibility for maintenance, densification, and equipment hosting. This transfer changes which entity sets investment priorities and expands the range of buyers tracked by the Telecom Capex Prioritization Tracker Market.
Geography Analysis
North America Telecom Capex Prioritization Tracker Market
North America held 31.24% of the Telecom Capex Prioritization Tracker Market share in 2025. AT&T’s five-year U.S. investment plan exceeded USD 250 billion and covered fiber, 5G home internet, FirstNet, and satellite connectivity. Verizon’s completed acquisition of Frontier expanded its fiber operations from 15 to 31 states and Washington, D.C. The BEAD program adds USD 42.5 billion in public broadband funding to commercial build schedules.
APAC Telecom Capex Prioritization Tracker Market
Asia-Pacific is forecast to achieve the fastest regional CAGR, at 15.83%, from 2026 to 2031. China Mobile planned CNY 136.6 billion (USD 18.9 billion) in capital expenditure for 2026 and increased its computing-power network budget to CNY 37.8 billion (USD 5.6 billion). China Unicom planned CNY 50 billion (USD 6.9 billion) in capital expenditure for 2026, with more than 35% allocated to computing power. Reliance Jio invested USD 15.2 billion in fiscal year 2026 and had 27.1 million fixed broadband subscribers. NTT DOCOMO maintained JPY 857.5 billion (USD 5.7 billion) in fiscal year 2025 capital expenditure for 5G expansion and AI-enabled network management.
EMEA and South America Telecom Capex Prioritization Tracker Market
Europe’s 2025 network infrastructure investment totaled EUR 16.9 billion (USD 18.3 billion), with Deutsche Telekom contributing EUR 5.9 billion (USD 6.4 billion) in Germany. Virgin Media O2 committed GBP 700 million (USD 895 million) to mobile investment in 2026. The Middle East is a capital-intensive region, with Mobily reporting SAR 5.83 billion (USD 1.55 billion) in 2025 capital expenditure and more than 7,600 5G sites across 61 cities. Africa’s growth is supported by fiber and mobile investment, including Telkom South Africa’s ZAR 6.43 billion, equivalent to USD 350 million, capital expenditure in fiscal year 2026. South America is led more by fixed broadband and optical software investment, including Cirion’s network-as-a-service deployment with Ciena and Carma.
Competitive Landscape
The Telecom Capex Prioritization Tracker Market includes a concentrated top tier of network suppliers and a broader group of specialists. Huawei, Ericsson, Nokia, ZTE, and Cisco are established suppliers in core-network deployments. Competition is moving toward software-defined networks, automation, and AI-enabled operations as hardware features become less distinct. Nokia announced an AI-native RAN platform in July 2026 that enables operators to add capacity through software subscriptions without hardware refresh cycles. Within the Telecom Capex Prioritization Tracker Market, vendor roadmaps are also shaped by 3GPP, TM Forum, national spectrum authorities, and International Telecommunication Union requirements.
The Telecom Capex Prioritization Tracker Market also responds to product decisions that reduce power use and expand capacity. Ericsson’s RAN Processor 6672 deployment with NTT DOCOMO delivered up to 4 times the prior capacity and used more than 50% less energy, supporting upgrade decisions where operators need more capacity without a proportionate increase in power. Huawei introduced its Next-Generation WAN architecture at MWC Barcelona 2026, covering transport and cloud-network needs. Ciena introduced 1.6 Tbps coherent technology and 800 Gbps C- and L-band pluggables for AI infrastructure in March 2026, linking optical transport innovation with the network investment choices operators must make.
Specialist suppliers are creating positions in wireless transport, broadband access, and cloud-native network operations. Mavenir launched its Agentic Service Assurance Framework in June 2026 to support multi-domain fault detection and remediation without requiring operators to replace existing operational support systems. Ceragon expanded its position in transport through its five-year Asia-Pacific supply agreement, while Calix introduced Calix One in February 2026 as an AI-native platform that combines appliances, cloud software, AI agents, and managed services for broadband service providers. These firms compete through focused solutions and recurring platform revenue rather than broad equipment portfolios. This mix widens the number of capabilities evaluated within the Telecom Capex Prioritization Tracker Market.
Telecom Capex Prioritization Tracker Industry Leaders
-
Huawei Technologies Co., Ltd.
-
Telefonaktiebolaget LM Ericsson
-
Nokia Corporation
-
ZTE Corporation
-
Samsung Electronics Co., Ltd.
- *Disclaimer: Major Players sorted in no particular order
Telecom Capex Prioritization Tracker Market Companies Covered in this Report
- Huawei Technologies Co., Ltd.
- Nokia Corporation
- Telefonaktiebolaget LM Ericsson
- ZTE Corporation
- Cisco Systems, Inc.
- Ciena Corporation
- Juniper Networks, Inc.
- CommScope Holding Company, Inc.
- ADTRAN Holdings, Inc.
- Fujitsu Limited
- NEC Corporation
- Samsung Electronics Co., Ltd.
- Mavenir Systems, Inc.
- Airspan Networks Holdings Inc.
- Parallel Wireless, Inc.
- Calix, Inc.
- Cambium Networks Corporation
- Ubiquiti Inc.
- Tejas Networks Limited
- HFCL Limited
- Ceragon Networks Ltd.
- Aviat Networks, Inc.
- Ekinops S.A.
- Ribbon Communications Inc.
Recent Industry Developments in Telecom Capex Prioritization Tracker Market
- July 2026: NTT DOCOMO completed Japan's first commercial deployment of Ericsson's RAN Processor 6672, delivering up to four times the capacity of the previous generation and more than 50% lower energy consumption. The deployment establishes a new standard for 5G RAN densification efficiency in advanced markets, directly driving demand for packet-core and X-Haul capacity upgrades in parallel.
- July 2026: Ceragon Networks secured a five-year, USD 70 million supply agreement with a tier-1 APAC mobile operator to expand and modernize 4G and 5G transport networks, including E-band solutions and Ceragon Insight network monitoring software, covering both supply and technical support services.
- July 2026: Nokia announced the industry's first commercial AI-native RAN platform, enabling telecommunications providers to enhance network capacity through a software subscription model without hardware refresh cycles. Pilot deployments are slated for end of 2026, with commercial availability in 2027, leveraging NVIDIA's programmable merchant silicon.
- July 2026: HKT announced plans to deploy a 3.2 Tbps ultra-low-latency AI Data Centre Inter-connect Superhighway in Hong Kong, connecting major data-center clusters. Phase 1 connecting Lok Ma Chau to Tseung Kwan O targets completion by end of 2026 to support the megawatt-scale Sandy Ridge Data Facility Cluster.
Global Telecom Capex Prioritization Tracker Market Report Scope
The telecom capex prioritization tracker market refers to analytical tools, databases, and advisory services that enable telecommunications operators, infracos, and tower companies to monitor, evaluate, and strategically allocate their capital expenditures. These trackers provide granular visibility into spending across various network assets, including radio access networks, core infrastructure, fiber broadband, and transport networks, as well as technology transitions such as 5G rollouts and fiber-to-the-premises deployments. By offering insights into installation costs, maintenance budgets, and asset lifecycles, these solutions help communication service providers optimize their network investments, balance legacy network maintenance with next-generation infrastructure deployments, and maximize return on investment in a highly capital-intensive industry.
The Telecom Capex Prioritization Tracker Market Report is Segmented by Investment Category (Installation and Maintenance, Radio Access Network Equipment, Core Network Infrastructure, Fiber and Fixed Broadband Infrastructure, and Others), Technology (5G Network Infrastructure, 4G LTE Network Maintenance, Fiber-to-the-Premises, and Others), Network Asset Type (Wireline Access, Wireless Access, Wireless X-Haul and Packet Core, Transport Networks, and Others), Capex Source (Mobile Network Operators, Fixed Broadband Operators, Infracos and Tower Companies, and Others), and Geography (North America, South America, Europe, Asia-Pacific, Middle East, and Africa). The Market Forecasts are Provided in Terms of Value (USD).
Segmentation Overview
| Installation and Maintenance |
| Radio Access Network Equipment |
| Core Network Infrastructure |
| Fiber and Fixed Broadband Infrastructure |
| Other Investment Categories |
| 5G Network Infrastructure |
| 4G LTE Network Maintenance |
| Fiber-to-the-Premises |
| Other Technologies |
| Wireline Access |
| Wireless Access |
| Wireless X-Haul and Packet Core |
| Transport Networks |
| Other Network Asset Types |
| Mobile Network Operators |
| Fixed Broadband Operators |
| Infracos and Tower Companies |
| Other Capex Sources |
| North America | United States |
| Canada | |
| Mexico | |
| South America | Brazil |
| Argentina | |
| Chile | |
| Rest of South America | |
| Europe | Germany |
| United Kingdom | |
| France | |
| Italy | |
| Spain | |
| Rest of Europe | |
| Asia-Pacific | China |
| Japan | |
| India | |
| South Korea | |
| Australia | |
| Rest of Asia-Pacific | |
| Middle East | United Arab Emirates |
| Saudi Arabia | |
| Qatar | |
| Rest of Middle East | |
| Africa | South Africa |
| Egypt | |
| Nigeria | |
| Rest of Africa |
| By Investment Category | Installation and Maintenance | |
| Radio Access Network Equipment | ||
| Core Network Infrastructure | ||
| Fiber and Fixed Broadband Infrastructure | ||
| Other Investment Categories | ||
| By Technology | 5G Network Infrastructure | |
| 4G LTE Network Maintenance | ||
| Fiber-to-the-Premises | ||
| Other Technologies | ||
| By Network Asset Type | Wireline Access | |
| Wireless Access | ||
| Wireless X-Haul and Packet Core | ||
| Transport Networks | ||
| Other Network Asset Types | ||
| By Capex Source | Mobile Network Operators | |
| Fixed Broadband Operators | ||
| Infracos and Tower Companies | ||
| Other Capex Sources | ||
| By Geography | North America | United States |
| Canada | ||
| Mexico | ||
| South America | Brazil | |
| Argentina | ||
| Chile | ||
| Rest of South America | ||
| Europe | Germany | |
| United Kingdom | ||
| France | ||
| Italy | ||
| Spain | ||
| Rest of Europe | ||
| Asia-Pacific | China | |
| Japan | ||
| India | ||
| South Korea | ||
| Australia | ||
| Rest of Asia-Pacific | ||
| Middle East | United Arab Emirates | |
| Saudi Arabia | ||
| Qatar | ||
| Rest of Middle East | ||
| Africa | South Africa | |
| Egypt | ||
| Nigeria | ||
| Rest of Africa | ||
Key Questions Answered in the Report
How large is the Telecom Capex Prioritization Tracker Market?
The Telecom Capex Prioritization Tracker Market is estimated at USD 1.41 billion in 2026 and is forecast to reach USD 2.75 billion by 2031, at a 14.29% CAGR.
What is driving demand for telecom capex prioritization trackers?
5G Standalone deployments, fiber construction, AI data-center interconnect needs, and public connectivity programs are increasing the number of network projects that require coordinated capital decisions.
Which investment category is growing fastest?
Fiber and fixed broadband infrastructure is expected to grow at a 15.47% CAGR from 2026 to 2031, supported by broadband, mobile backhaul, and data-center connectivity requirements.
Which technology receives the largest share of telecom network spending?
5G network infrastructure accounted for 42.13% of technology-segmented spending in 2025, while fiber-to-the-premises has the highest projected growth rate at 16.27% CAGR.
Why are infracos and tower companies becoming more important?
Infracos and tower companies are projected to grow at a 16.13% CAGR as operators transfer passive assets and independent owners invest in towers, fiber conduits, and related infrastructure.
Which region is expected to grow fastest through 2031?
Asia-Pacific is projected to grow at a 15.83% CAGR, supported by investment in computing networks, fiber broadband, 5G Standalone, and data-center interconnect capacity.