South America Data Center Market Size and Share
Market Overview
| Study Period | 2020 - 2031 |
|---|---|
| Forecast Data Period | 2026 - 2031 |
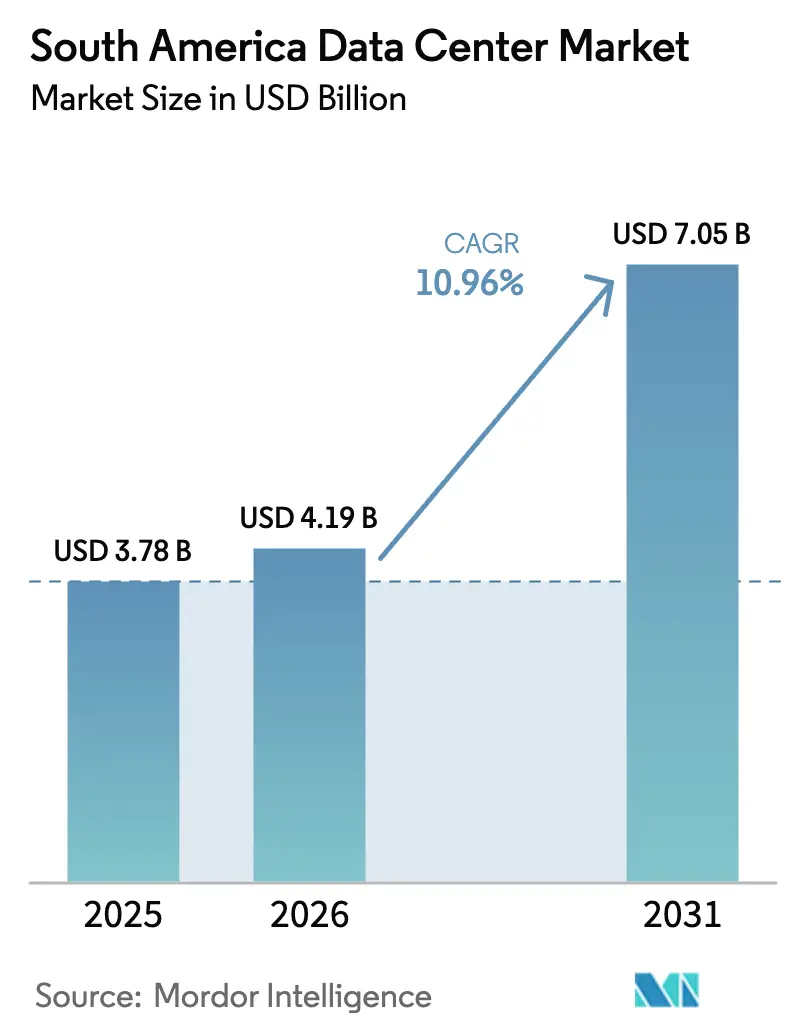
| Base Year Market Size (2025) | USD 3.78 Billion |
| Market Size (2026) | USD 4.19 Billion |
| Market Size (2031) | USD 7.05 Billion |
| Growth Rate (2026 - 2031) | 10.96% CAGR |
| Market Concentration | Medium |
Major Players *Disclaimer: Major Players sorted in no particular order Image © Mordor Intelligence. Reuse requires attribution under CC BY 4.0. | |
South America Data Center Market Analysis by Mordor Intelligence
The South America Data Center market size is expected to grow from USD 3.78 billion in 2025 to USD 4.19 billion in 2026 and is forecast to reach USD 7.05 billion by 2031 at 10.96% CAGR over 2026-2031. In terms of the IT Load capacity, the market is expected to grow from 1.51 thousand megawatts in 2025 to 2.23 thousand megawatts by 2030, at a CAGR of 8.16% during the forecast period (2025-2030). The market segment shares and estimates are calculated and reported in terms of MW. Rapid cloud adoption, hyperscale capital expenditure, and 5G-driven edge computing are the primary demand catalysts, while submarine cable additions and renewable energy power-purchase agreements are reshaping total cost of ownership. Competitive activity is intensifying as global and regional players deploy large-scale facilities in São Paulo, Santiago, and selected secondary metros. Government data-localization mandates and fintech regulation in Brazil and Chile are simultaneously creating mandatory in-country processing requirements and lifting enterprise confidence in local infrastructure. Persistent challenges around grid stability, water availability, and permitting timelines, however, continue to influence site selection and project economics.
Key Report Takeaways
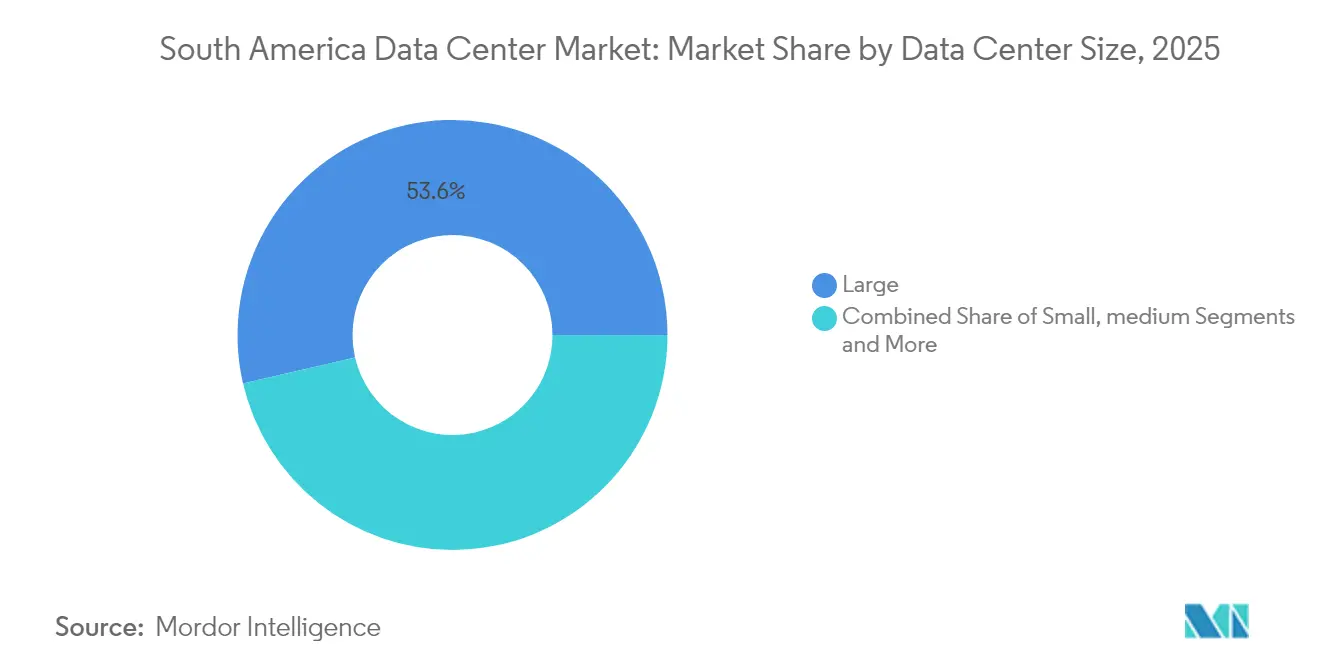
- By data center size, large facilities led with 53.62% revenue share in 2025; massive and mega campuses are advancing at an 7.78% CAGR through 2031.
- By tier standard, Tier 3 captured 30.12% of the South America data center market share in 2025, while Tier 4 is projected to post the fastest 7.95% CAGR to 2031.
- By data center type, colocation accounted for 76.02% share of the South America data center market size in 2025; hyperscale and self-built facilities are rising at an 8.08% CAGR through 2031.
- By end user industry, IT and telecommunications commanded 57.92% share in 2025; BFSI is forecast to record an 8.05% CAGR over the outlook period.
- By geography, Brazil controlled 72.88% of installed capacity in 2025, while Chile is set to grow at a 9.21% CAGR through 2031.
Note: Market size and forecast figures in this report are generated using Mordor Intelligence’s proprietary estimation framework, updated with the latest available data and insights as of 2026.
South America Data Center Market Trends and Insights
Drivers Impact Analysis*
| DRIVER | (~) % IMPACT ON CAGR FORECAST | GEOGRAPHIC RELEVANCE | IMPACT TIMELINE |
|---|---|---|---|
| Explosive growth in cloud and OTT services | +1.8% | Brazil and Chile core | Short term (≤ 2 years) |
| Aggressive hyperscale investments by US technology majors | +2.1% | Brazil, Chile, spillover to Colombia | Medium term (2-4 years) |
| Rapid 5G roll-out accelerating edge demand | +1.2% | Brazil and Chile primary | Medium term (2-4 years) |
| Data-localization mandates in Brazil and Chile | +1.4% | Brazil and Chile | Long term (≥ 4 years) |
| Green-energy PPAs lowering total cost of ownership | +0.9% | Chile and Brazil renewable corridors | Long term (≥ 4 years) |
| Emerging fintech regulations driving in-country processing | +0.7% | Brazil, Chile, Colombia | Medium term (2-4 years) |
| Source: Mordor Intelligence | |||


Explosive Growth in Cloud and OTT Services
Regional cloud consumption soared in 2024 as streaming, gaming, and SaaS workloads migrated from on-premise environments to public cloud platforms. Amazon committed USD 4 billion to build a new AWS region near Santiago, the largest single cloud infrastructure project announced in the region. Google increased Santiago capacity and earmarked USD 850 million for a Uruguay facility that complements its existing network. The adoption curve is reinforced by Brazil’s 45,281 operational 5G sites in 2024, which lowered last-mile latency and widened the addressable market for ultra-high-bandwidth applications.[1]Global Data Alliance Secretariat, “Cross-border data transfers and telecom technologies,” GLOBALDATAALLIANCE.ORG, globaldataalliance.org Compliance obligations under Brazil’s LGPD law and Chile’s pending personal data statute require many global enterprises to process user data locally, ensuring durable demand for in-region capacity.
Aggressive Hyperscale Investments by US Technology Majors
Microsoft, Amazon, and Google collectively disclosed more than USD 8 billion in fresh South American capital outlays between 2024-2025. Microsoft locked in a multi-year renewable-energy agreement with AES Andes that guarantees carbon-free power for future Chilean campuses and mitigates electricity price volatility.[2]Iñigo Echeverría, “Microsoft and AES Andes sign renewable PPA for Chile data centers,” MICROSOFT.COM, microsoft.com Amazon boosted São Paulo region power by 40% in 2024 while executing a dual-hub expansion strategy spanning Portuguese and Spanish-speaking territories. Google’s Humboldt subsea cable will deliver the first direct South America-Asia route by 2027 and substantially reduce dependence on North American transit, a latency break-through that favors Santiago as a regional interconnection nexus.
Rapid 5G Roll-out Accelerating Edge Demand
Brazil met 100% of its regulatory 5G deployment targets in 2024, reaching 47.2 million subscribers and catalyzing use cases ranging from industrial automation to cloud gaming. Enterprise pilots illustrate the trend: Nestlé activated Latin America’s first private 5G network at its Caçapava food facility to streamline manufacturing execution systems. Energy producer Itaipu Binacional deployed a standalone 5G network for predictive maintenance in its cross-border hydroelectric plant. These developments are pushing service providers to site micro-data centers within 50 kilometers of population nodes, an evolution that deepens the South America data center market’s geographic footprint.
Data Localization Mandates in Brazil and Chile
Brazil’s data-protection authority adopted standard contractual clauses for international transfers in 2024, restricting outbound movement of sensitive information without explicit safeguards.[3]Jason Nelson, “Latin American data privacy update,” CROWELL.COM, crowell.com Chile’s Personal Data Protection Bill, approved by Congress in 2024 and pending constitutional review, aligns closely with the EU GDPR and endorses anonymization and pseudonymization for high-risk processing. Financial regulators add further pressure: Brazil’s Central Bank requires payment card clearing data to remain on shore, while Chile’s fintech statute calls for real-time anti-fraud systems based inside national borders. Operators capable of offering audited, high-tier facilities benefit directly as multinational clients seek compliant hosting environments.
Restraints Impact Analysis*
| RESTRAINTS | (~) % IMPACT ON CAGR FORECAST | GEOGRAPHIC RELEVANCE | IMPACT TIMELINE |
|---|---|---|---|
| Volatile electricity tariffs and grid instability | -1.3% | Argentina, secondary Brazilian metros | Short term (≤ 2 years) |
| Slow permitting and land-use bureaucracy | -0.8% | Brazil municipal, Chile improving | Medium term (2-4 years) |
| Water scarcity risks for cooling in drought-prone zones | -1.1% | Northern Chile, northeast Brazil | Long term (≥ 4 years) |
| Political and currency volatility dampening FDI | -0.6% | Argentina, regional spillover | Short term (≤ 2 years) |
| Source: Mordor Intelligence | |||
Volatile Electricity Tariffs and Grid Instability
Currency swings and infrastructure gaps continue to drive double-digit annual tariff variance in Argentina and in Brazil’s non-São Paulo metros, forcing operators to invest in redundant generation that lifts capital intensity. Chile’s deregulated market offers respite via fixed-price renewable PPAs, exemplified by Microsoft’s clean-energy accord with AES Andes. Hyperscalers and regional specialists increasingly sign 10-15-year green-energy contracts to lock in predictable power budgets and satisfy corporate sustainability aims.
Water Scarcity Risks for Cooling
Northern Chile’s drought cycles forced Google to delay construction at Quilicura pending local water authority approval. Evaporative cooling is giving way to closed-loop, air, and liquid-immersion solutions that reduce per-MW water draw by up to 70%. Brazil’s northeast has issued periodic restrictions on industrial water use, compelling data centers to adopt on-site recycling systems and, in one case, leverage treated wastewater from a nearby municipality. Free cooling is viable in Chile’s coastal zones for roughly 65% of annual hours, underscoring the importance of micro-climate analytics in site selection.
*Our forecasts treat driver/restraint impacts as directional, not additive. The impact forecasts reflect baseline growth, mix effects, and variable interactions.
Segment Analysis
By Data Center Size: Large Campuses Anchor Regional Supply
Large facilities accounted for 53.62% of the installed capacity in 2025, reflecting the consolidation of the South America data center market around hyperscale campuses that can secure bulk power and carrier-dense connectivity. Amazon’s Chile project alone earmarks multiple 50 MW halls, while São Paulo’s biggest campus surpassed 200 MW under V.tal’s Tecto initiative. Operators value the operating-expense efficiency that large footprints deliver through optimized power-usage effectiveness, centralized operations, and renewable energy aggregation.
Momentum is shifting further toward mega and massive footprints as cloud AI training clusters demand dense compute blocks. The South America data center market size for large sites is projected to rise at an 7.78% CAGR, outpacing small and medium categories. Secondary metros such as Belo Horizonte and Bogotá are witnessing the first proposals for 20-40 MW builds, signaling that scale economics are expanding beyond traditional hubs. Regulatory scrutiny is higher for mega builds, yet streamlined permitting in Chile and federal incentives in Brazil’s north have reduced lead times by four to six months relative to 2022.


By Tier Standard: Tier 3 Remains Workhorse as Tier 4 Gains Traction
Tier 3 platforms delivered 30.12% of regional capacity in 2025 and continue to serve enterprise colocation, hybrid cloud deployments, and content networks that need robust uptime without the premium of Tier 4. Banking and payment processors, however, drove an 7.95% CAGR forecast for Tier 4, seeking fault-tolerant infrastructure to meet 99.99% availability mandates. The South America data center market share for Tier 4 is growing fastest in Brazil, where São Paulo’s financial district interconnects dozens of critical trading systems.
Chile’s National Data Centers Plan incentivizes both Tier 3 and Tier 4 by offering expedited environmental clearance for sites that conform to ISO 27001 and national seismic standards. Hybrid configurations are appearing inside the same compound, allowing operators to segment racks by resilience level. Lower-tier footprints are gradually phasing out as customers migrate test workloads to public cloud and reserve on-premise space for legacy equipment headed for retirement.
By Data Center Type: Colocation Dominates, Hyperscale Ascends
Colocation retained a 76.02% share in 2025, underscoring the fragmented ownership of IT infrastructure among enterprises and the strong preference for local partners among multinationals. Neutral facilities like Equinix SP5 and SCL1 form the backbone of regional carrier interconnection, complementing submarine landing stations for Firmina, Malbec, and other cables. Growing AI workloads, however, are tilting expansion budgets toward hyperscale self-builds, lifting that category by an 8.08% CAGR.
Retail colocation remains vital for SMEs and regional SaaS vendors that prioritize service bundles over raw power. Wholesale colocation sees the largest average contract sizes as cloud providers pre-lease entire suites to accelerate go-live schedules. Enterprise and edge deployments register a niche yet rising contribution, fueled by the need for private 5G and telco network-function virtualization, which requires sub-10 millisecond latency. The South America data center market size for edge centers will climb faster once national regulators allocate contiguous mid-band spectrum for industry use.

By End User Industry: IT and Telecom Lead, BFSI Surges
IT and telecommunications entities consumed 57.92% of total power in 2025, reflecting the high demand for 100G wavelengths and cross-connect bookings at carrier-neutral sites. Cloud migration, CDN expansion, and telco network transformation underpin steady procurement of additional white space. BFSI workloads, however, are expanding at an 8.05% CAGR to 2031 as digital banking, open-finance APIs, and real-time payment rails necessitate ultra-low-latency, compliant hosting.
Government workloads lag in absolute size yet display rising deal flow as digital-services ministries push “cloud-first” procurement policies. Media and entertainment archives are migrating to object storage clouds, but live streaming still prefers proximate edge caches to minimize last-mile jitter. Manufacturing uptake jumped after the successful 5G private-network proof points in Brazil, propelling a pipeline of brownfield retrofits that integrate edge micro-centers with robotics and analytics stacks.
Geography Analysis
Brazil held 72.88% of South America data center market share in 2025. São Paulo’s dense fiber rings and financial-services concentration make it the default landing point for new submarine systems and the preferred zone for multi-tenant build-outs. Institutional capital’s entry, illustrated by Patria’s USD 1 billion platform, has added professional real-estate execution capacity, shortening delivery cycles in secondary metros such as Campinas and Fortaleza.
Chile registers the fastest 9.21% CAGR ahead of 2031. The government’s USD 2.5 billion investment-attraction roadmap bundles pre-zoned land near solar farms, relaxed diesel storage limits, and fast-track municipal permits. AWS’s USD 4 billion commitment and Google’s Humboldt cable together elevate Santiago to a dual-timezone node that bridges North-South America traffic and future Asia-Pacific flows. High solar and wind capacity enables operators to close 15-year renewable PPAs at discounts to fossil grid tariffs, lifting Santiago’s competitiveness despite seismic-design costs.
The rest of South America presents a mosaic of growth vectors. Colombia’s pro-business data-privacy reform is coaxing Bogotá-based outsourcers to shift from tier-2 facilities to certified tier-3 colocation, while a Bogotá-Cali-Medellín fiber triangle positions the country for edge deployments. Argentina’s liquidity constraints and currency volatility slow greenfield announcements; nonetheless, existing Buenos Aires sites are adding modular extensions to safeguard multinationals’ presence. Peru and Uruguay leverage new cable landings for latency-sensitive mining analytics and fintech hosting, respectively. These markets collectively benefit from nine submarine projects worth over USD 2 billion scheduled for service between 2025-2027, which will ease transit bottlenecks and open new peering options.
Competitive Landscape
Roughly three-quarters of installed megawatts reside in three metro areas—São Paulo, Santiago, and Querétaro—indicating moderate concentration yet leaving ample whitespace across the continent. Hyperscalers such as Amazon, Microsoft, and Google accelerate direct investment to control supply chains, including power procurement and fiber routes. International colocation leaders, notably Equinix and EdgeConneX, pursue M&A and joint-venture structures to secure land pipelines and diversify into edge.
Regional champions Ascenty, Scala, and ODATA capitalize on local permitting expertise and tax-incentive navigation, often delivering capacity faster than global entrants. The most differentiated strategies combine renewable-energy originations, submarine cable equity stakes, and software-defined infrastructure layers that boost utilization rates. Institutional investors now anchor multiproject platforms, exemplified by Patria and Actis, bringing pension and sovereign wealth capital into what was formerly a niche real-estate segment.
Competition is shifting toward sustainability credentials and AI-ready design. Liquid-immersion cooling pilots, 100% renewable commitments, and SOC 2 Type II certifications increasingly influence enterprise RFP shortlists. Providers able to verify Scope 3 emissions and guarantee 24 x 7 carbon-free energy sourcing are beginning to command pricing premiums, a trend likely to intensify as multinational tenants advance net-zero timelines.
South America Data Center Industry Leaders
Google LLC
ODATA S.A.
GTD Manquehue S.A.
Ascenty Data Centers e Telecomunicações S.A.
Equinix, Inc.
- *Disclaimer: Major Players sorted in no particular order


Recent Industry Developments
- May 2025: Patria launched a USD 1 billion data center platform to accelerate Brazilian greenfield and brownfield builds.
- May 2025: Amazon confirmed a USD 4 billion AWS region in Chile, scheduled to enter service in 2026, with three availability zones.
- June 2025: Google signed final agreements with Chile for the Humboldt subsea cable, budgeting USD 300-550 million and targeting readiness by 2027.
- June 2025: Chile raised the diesel-storage threshold for permitting to 1,000 tons, exempting most data centers from environmental review.


South America Data Center Market Report Scope
| Large |
| Massive |
| Medium |
| Mega |
| Small |
| Tier 1 and 2 |
| Tier 3 |
| Tier 4 |
| Hyperscale/Self-built | ||
| Enterprise/Edge | ||
| Colocation | Non-Utilized | |
| Utilized | Retail Colocation | |
| Wholesale Colocation | ||
| BFSI |
| IT and ITES |
| E-Commerce |
| Government |
| Manufacturing |
| Media and Entertainment |
| Telecom |
| Other End Users |
| Brazil |
| Chile |
| Rest of South America |
| By Data Center Size | Large | ||
| Massive | |||
| Medium | |||
| Mega | |||
| Small | |||
| By Tier Standard | Tier 1 and 2 | ||
| Tier 3 | |||
| Tier 4 | |||
| By Data Center Type | Hyperscale/Self-built | ||
| Enterprise/Edge | |||
| Colocation | Non-Utilized | ||
| Utilized | Retail Colocation | ||
| Wholesale Colocation | |||
| By End User Industry | BFSI | ||
| IT and ITES | |||
| E-Commerce | |||
| Government | |||
| Manufacturing | |||
| Media and Entertainment | |||
| Telecom | |||
| Other End Users | |||
| By Country | Brazil | ||
| Chile | |||
| Rest of South America | |||


Market Definition
- IT LOAD CAPACITY - The IT load capacity or installed capacity, refers to the amount of energy consumed by servers and network equipments placed in a rack installed. It is measured in megawatt (MW).
- ABSORPTION RATE - It denotes the extend to which the data center capacity has been leased out. For instance, a 100 MW DC has leased out 75 MW, then absorption rate would be 75%. It is also referred as utilization rate and leased-out capacity.
- RAISED FLOOR SPACE - It is an elevated space build over the floor. This gap between the original floor and the elevated floor is used to accommodate wiring, cooling, and other data center equipment. This arrangement assist in having proper wiring and cooling infrastructure. It is measured in square feet (ft^2).
- DATA CENTER SIZE - Data Center Size is segmented based on the raised floor space allocated to the data center facilities. Mega DC - # of Racks must be more than 9000 or RFS (raised floor space) must be more than 225001 Sq. ft; Massive DC - # of Racks must be in between 9000 and 3001 or RFS must be in between 225000 Sq. ft and 75001 Sq. ft; Large DC - # of Racks must be in between 3000 and 801 or RFS must be in between 75000 Sq. ft and 20001 Sq. ft; Medium DC # of Racks must be in between 800 and 201 or RFS must be in between 20000 Sq. ft and 5001 Sq. ft; Small DC - # of Racks must be less than 200 or RFS must be less than 5000 Sq. ft.
- TIER TYPE - According to Uptime Institute the data centers are classified into four tiers based on the proficiencies of redundant equipment of the data center infrastructure. In this segment the data center are segmented as Tier 1,Tier 2, Tier 3 and Tier 4.
- COLOCATION TYPE - The segment is segregated into 3 categories namely Retail, Wholesale and Hyperscale Colocation service. The categorization is done based on the amount of IT load leased out to potential customers. Retail colocation service has leased capacity less than 250 kW; Wholesale colocation services has leased capacity between 251 kW and 4 MW and Hyperscale colocation services has leased capacity more than 4 MW.
- END CONSUMERS - The Data Center Market operates on a B2B basis. BFSI, Government, Cloud Operators, Media and Entertainment, E-Commerce, Telecom and Manufacturing are the major end-consumers in the market studied. The scope only includes colocation service operators catering to the increasing digitalization of the end-user industries.
| Keyword | Definition |
|---|---|
| Rack Unit | Generally referred as U or RU, it is the unit of measurement for the server unit housed in the racks in the data center. 1U is equal to 1.75 inches. |
| Rack Density | It defines the amount of power consumed by the equipment and server housed in a rack. It is measured in kilowatt (kW). This factor plays a critical role in data center design and, cooling and power planning. |
| IT Load Capacity | The IT load capacity or installed capacity, refers to the amount of energy consumed by servers and network equipment placed in a rack installed. It is measured in megawatt (MW). |
| Absorption Rate | It denotes how much of the data center capacity has been leased out. For instance, if a 100 MW DC has leased out 75 MW, then the absorption rate would be 75%. It is also referred to as utilization rate and leased-out capacity. |
| Raised Floor Space | It is an elevated space built over the floor. This gap between the original floor and the elevated floor is used to accommodate wiring, cooling, and other data center equipment. This arrangement assists in having proper wiring and cooling infrastructure. It is measured in square feet/meter. |
| Computer Room Air Conditioner (CRAC) | It is a device used to monitor and maintain the temperature, air circulation, and humidity inside the server room in the data center. |
| Aisle | It is the open space between the rows of racks. This open space is critical for maintaining the optimal temperature (20-25 °C) in the server room. There are primarily two aisles inside the server room, a hot aisle and a cold aisle. |
| Cold Aisle | It is the aisle wherein the front of the rack faces the aisle. Here, chilled air is directed into the aisle so that it can enter the front of the racks and maintain the temperature. |
| Hot Aisle | It is the aisle where the back of the racks faces the aisle. Here, the heat dissipated from the equipment’s in the rack is directed to the outlet vent of the CRAC. |
| Critical Load | It includes the servers and other computer equipment whose uptime is critical for data center operation. |
| Power Usage Effectiveness (PUE) | It is a metric which defines the efficiency of a data center. It is calculated by: (𝑇𝑜𝑡𝑎𝑙 𝐷𝑎𝑡𝑎 𝐶𝑒𝑛𝑡𝑒𝑟 𝐸𝑛𝑒𝑟𝑔𝑦 𝐶𝑜𝑛𝑠𝑢𝑚𝑝𝑡𝑖𝑜𝑛)/(𝑇𝑜𝑡𝑎𝑙 𝐼𝑇 𝐸𝑞𝑢𝑖𝑝𝑚𝑒𝑛𝑡 𝐸𝑛𝑒𝑟𝑔𝑦 𝐶𝑜𝑛𝑠𝑢𝑚𝑝𝑡𝑖𝑜𝑛). Further, a data center with a PUE of 1.2-1.5 is considered highly efficient, whereas, a data center with a PUE >2 is considered highly inefficient. |
| Redundancy | It is defined as a system design wherein additional component (UPS, generators, CRAC) is added so that in case of power outage, equipment failure, the IT equipment should not be affected. |
| Uninterruptible Power Supply (UPS) | It is a device that is connected in series with the utility power supply, storing energy in batteries such that the supply from UPS is continuous to IT equipment even during utility power is snapped. The UPS primarily supports the IT equipment only. |
| Generators | Just like UPS, generators are placed in the data center to ensure an uninterrupted power supply, avoiding downtime. Data center facilities have diesel generators and commonly, 48-hour diesel is stored in the facility to prevent disruption. |
| N | It denotes the tools and equipment required for a data center to function at full load. Only "N" indicates that there is no backup to the equipment in the event of any failure. |
| N+1 | Referred to as 'Need plus one', it denotes the additional equipment setup available to avoid downtime in case of failure. A data center is considered N+1 when there is one additional unit for every 4 components. For instance, if a data center has 4 UPS systems, then for to achieve N+1, an additional UPS system would be required. |
| 2N | It refers to fully redundant design wherein two independent power distribution system is deployed. Therefore, in the event of a complete failure of one distribution system, the other system will still supply power to the data center. |
| In-Row Cooling | It is the cooling design system installed between racks in a row where it draws warm air from the hot aisle and supplies cool air to the cold aisle, thereby maintaining the temperature. |
| Tier 1 | Tier classification determines the preparedness of a data center facility to sustain data center operation. A data center is classified as Tier 1 data center when it has a non-redundant (N) power component (UPS, generators), cooling components, and power distribution system (from utility power grids). The Tier 1 data center has an uptime of 99.67% and an annual downtime of <28.8 hours. |
| Tier 2 | A data center is classified as Tier 2 data center when it has a redundant power and cooling components (N+1) and a single non-redundant distribution system. Redundant components include extra generators, UPS, chillers, heat rejection equipment, and fuel tanks. The Tier 2 data center has an uptime of 99.74% and an annual downtime of <22 hours. |
| Tier 3 | A data center having redundant power and cooling components and multiple power distribution systems is referred to as a Tier 3 data center. The facility is resistant to planned (facility maintenance) and unplanned (power outage, cooling failure) disruption. The Tier 3 data center has an uptime of 99.98% and an annual downtime of <1.6 hours. |
| Tier 4 | It is the most tolerant type of data center. A Tier 4 data center has multiple, independent redundant power and cooling components and multiple power distribution paths. All IT equipment are dual powered, making them fault tolerant in case of any disruption, thereby ensuring interrupted operation. The Tier 4 data center has an uptime of 99.74% and an annual downtime of <26.3 minutes. |
| Small Data Center | Data center that has floor space area of ≤ 5,000 Sq. ft or the number of racks that can be installed is ≤ 200 is classified as a small data center. |
| Medium Data Center | Data center which has floor space area between 5,001-20,000 Sq. ft, or the number of racks that can be installed is between 201-800, is classified as a medium data center. |
| Large Data Center | Data center which has floor space area between 20,001-75,000 Sq. ft, or the number of racks that can be installed is between 801-3,000, is classified as a large data center. |
| Massive Data Center | Data center which has floor space area between 75,001-225,000 Sq. ft, or the number of racks that can be installed is between 3001-9,000, is classified as a massive data center. |
| Mega Data Center | Data center that has a floor space area of ≥ 225,001 Sq. ft or the number of racks that can be installed is ≥ 9001 is classified as a mega data center. |
| Retail Colocation | It refers to those customers who have a capacity requirement of 250 kW or less. These services are majorly opted by small and medium enterprises (SMEs). |
| Wholesale Colocation | It refers to those customers who have a capacity requirement between 250 kW to 4 MW. These services are majorly opted by medium to large enterprises. |
| Hyperscale Colocation | It refers to those customers who have a capacity requirement greater than 4 MW. The hyperscale demand primarily originates from large-scale cloud players, IT companies, BFSI, and OTT players (like Netflix, Hulu, and HBO+). |
| Mobile Data Speed | It is the mobile internet speed a user experiences via their smartphones. This speed is primarily dependent on the carrier technology being used in the smartphone. The carrier technologies available in the market are 2G, 3G, 4G, and 5G, where 2G provides the slowest speed while 5G is the fastest. |
| Fiber Connectivity Network | It is a network of optical fiber cables deployed across the country, connecting rural and urban regions with high-speed internet connection. It is measured in kilometer (km). |
| Data Traffic per Smartphone | It is a measure of average data consumption by a smartphone user in a month. It is measured in gigabyte (GB). |
| Broadband Data Speed | It is the internet speed that is supplied over the fixed cable connection. Commonly, copper cable and optic fiber cable are used in both residential and commercial use. Here, optic cable fiber provides faster internet speed than copper cable. |
| Submarine Cable | A submarine cable is a fiber optic cable laid down at two or more landing points. Through this cable, communication and internet connectivity between countries across the globe is established. These cables can transmit 100-200 terabits per second (Tbps) from one point to another. |
| Carbon Footprint | It is the measure of carbon dioxide generated during the regular operation of a data center. Since, coal, and oil & gas are the primary source of power generation, consumption of this power contributes to carbon emissions. Data center operators are incorporating renewable energy sources to curb the carbon footprint emerging in their facilities. |


Research Methodology
Mordor Intelligence follows a four-step methodology in all our reports.
- Step-1: Identify Key Variables: In order to build a robust forecasting methodology, the variables and factors identified in Step-1 are tested against available historical market numbers. Through an iterative process, the variables required for market forecast are set and the model is built on the basis of these variables.
- Step-2: Build a Market Model: Market-size estimations for the forecast years are in nominal terms. Inflation is not a part of the pricing, and the average selling price (ASP) is kept constant throughout the forecast period for each country.
- Step-3: Validate and Finalize: In this important step, all market numbers, variables and analyst calls are validated through an extensive network of primary research experts from the market studied. The respondents are selected across levels and functions to generate a holistic picture of the market studied.
- Step-4: Research Outputs: Syndicated Reports, Custom Consulting Assignments, Databases & Subscription Platforms


