Market Overview
| Study Period | 2020 - 2031 |
|---|---|
| Forecast Data Period | 2026 - 2031 |
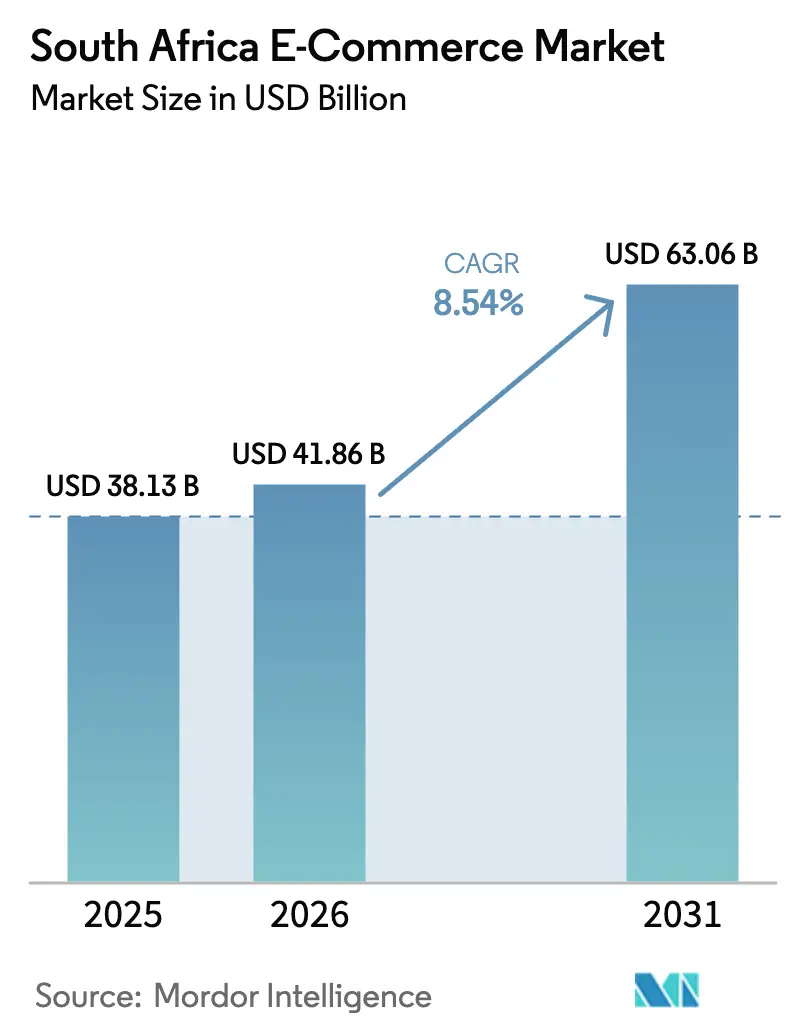
| Base Year Market Size (2025) | USD 38.13 Billion |
| Market Size (2026) | USD 41.86 Billion |
| Market Size (2031) | USD 63.06 Billion |
| Growth Rate (2026 - 2031) | 8.54% CAGR |
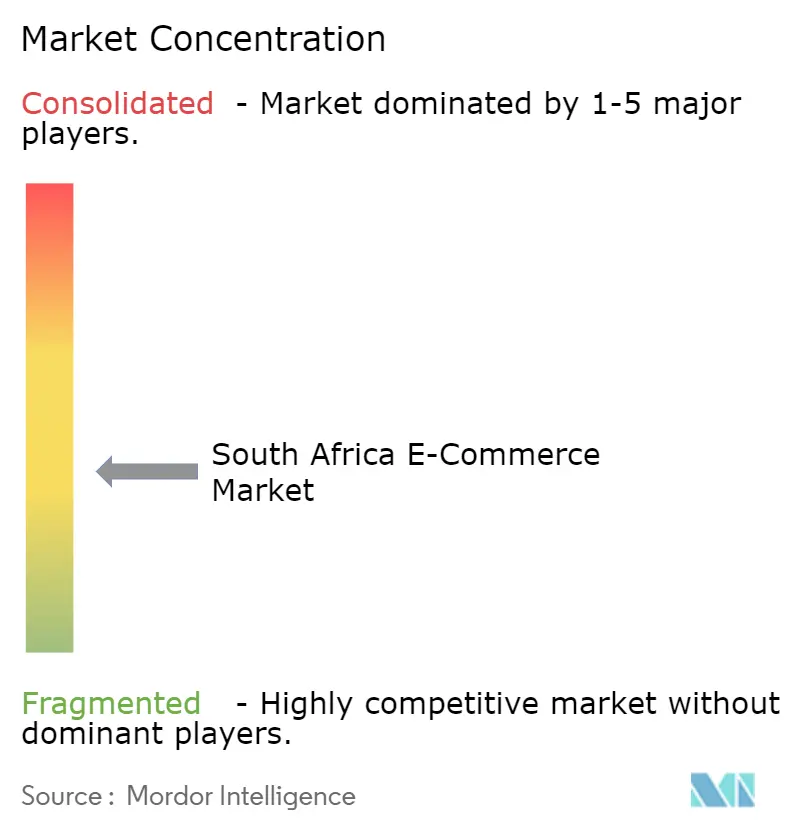
| Market Concentration | Medium |
Major Players *Disclaimer: Major Players sorted in no particular order Image © Mordor Intelligence. Reuse requires attribution under CC BY 4.0. | |
South Africa E-commerce Market Analysis by Mordor Intelligence
The South Africa E-commerce Market size is expected to increase from USD 38.13 billion in 2025 to USD 41.86 billion in 2026 and reach USD 63.06 billion by 2031, growing at a CAGR of 8.54% over 2026-2031. Robust smartphone adoption, the entry of global fast-fashion marketplaces, and sustained investment in last-mile logistics position the sector for durable expansion despite acute load-shedding and customs frictions. Rising Gen-Z spending power, buoyed by buy-now-pay-later (BNPL) options, is widening the addressable consumer base, while government spectrum auctions have lowered data costs enough to make video-rich shopping features commercially viable. Competitive dynamics are intensifying as Amazon, Walmart, and Shein push domestic players to unbundle fulfillment from merchandising and to deepen discounting strategies. Against this backdrop, township economies are emerging as the new demand frontier, where mobile-only users favor WhatsApp catalogs and smart-locker pickups.
Key Report Takeaways
- By business model, the B2C segment held 82.34% of the South Africa E-commerce Market share in 2025, while B2B is forecast to expand at a 10.87% CAGR to 2031.
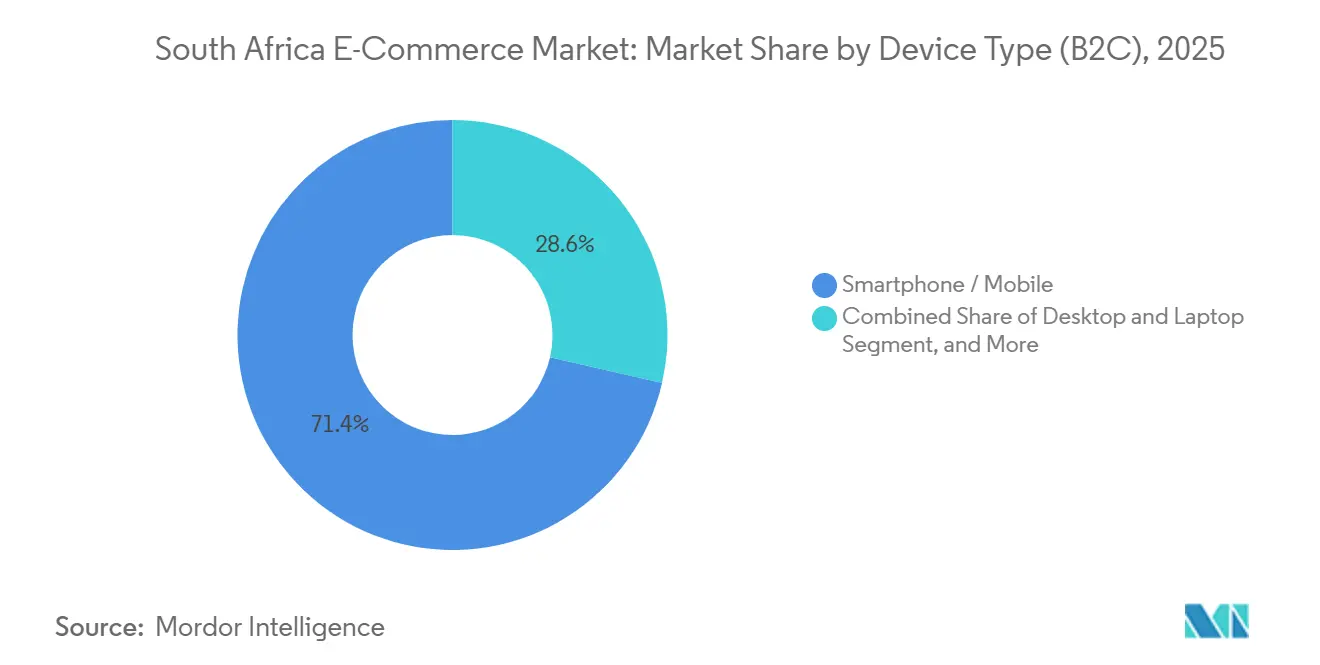
- By device type, smartphones captured 71.42% of the South Africa E-commerce Market size in 2025 and are advancing at a 9.03% CAGR through 2031.
- By payment method, credit and debit cards commanded 44.68% of the South Africa E-commerce Market size in 2025; BNPL is registering the highest projected CAGR at 11.23% to 2031.
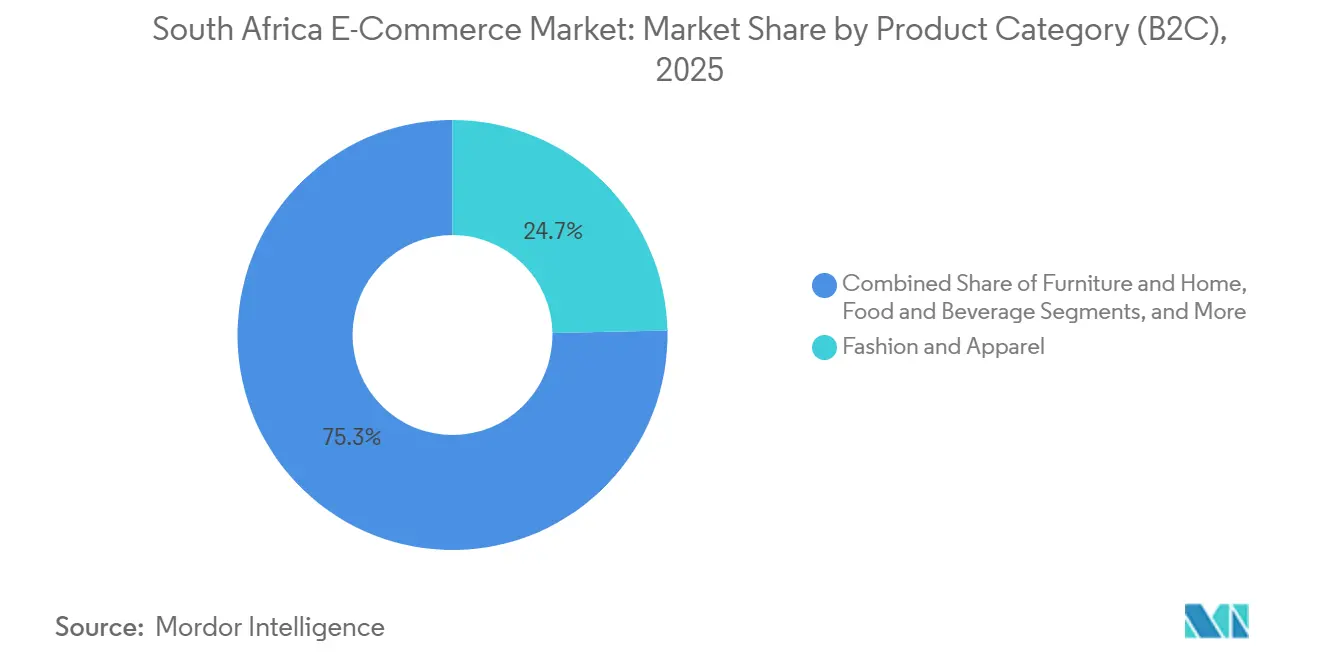
- By product category, fashion and apparel led with 24.67% revenue share in 2025; food and beverages is projected to expand at an 11.68% CAGR through 2031.
Note: Market size and forecast figures in this report are generated using Mordor Intelligence’s proprietary estimation framework, updated with the latest available data and insights as of January 2026.
South Africa E-commerce Market Trends and Insights
Drivers Impact Analysis*
| Driver | (~) % Impact on CAGR Forecast | Geographic Relevance | Impact Timeline |
|---|---|---|---|
| Rising Mobile-Only Shoppers in Township Economies Fueled by Low-Cost Android Handsets | +2.1% | Gauteng, Western Cape, KwaZulu-Natal townships | Medium term (2-4 years) |
| Expansion of Domestic Logistics Networks into Rural and Township Last-Mile | +1.8% | National, early gains in Eastern Cape and Limpopo | Long term (≥ 4 years) |
| Rapid Adoption of BNPL by Gen-Z Consumers Boosting Average Order Value | +1.5% | Gauteng and Western Cape urban centers | Short term (≤ 2 years) |
| Entry of Global Fast-Fashion Marketplaces Catalyzing Cross-Border Volumes | +1.3% | National with spillover into SADC neighbors | Short term (≤ 2 years) |
| Government Spectrum Auction and 5G Roll-Out Lowering Data Costs | +0.9% | Major metros, gradual rural expansion | Medium term (2-4 years) |
| Retailers' Partnerships with Smart-Lockers in Taxi Ranks Improving Convenience | +0.7% | High-footfall taxi ranks nationwide | Short term (≤ 2 years) |
| Source: Mordor Intelligence | |||
Rising Mobile-Only Shoppers in Township Economies Fueled by Low-Cost Android Handsets
Entry-level smartphones priced below ZAR 1,500 (USD 91.54), supported by affordable connectivity solutions from South Africa MNO MVNO providers, have democratized access for first-time internet users in Soweto, Khayelitsha, and Umlazi. These shoppers generated a rising share of B2C transactions in 2025, with average session lengths 40% shorter than desktop sessions, signaling comfort with streamlined, mobile-optimized checkouts. Takealot’s township initiative recruited 2,500 personal shoppers by late 2025 to assist low-literacy users, and WhatsApp catalogs have flourished as informal sales channels where peer recommendations carry more weight than brand advertising.[1]Independent Communications Authority of South Africa, “Spectrum Licensing and 5G Rollout,” ICASA.org.za
Expansion of Domestic Logistics Networks into Rural and Township Last-Mile
Partnerships between e-commerce platforms and third-party logistics firms have pushed last-mile coverage into 240 towns, delivering 1.8 million parcels monthly at 98.5% on-time performance. Smart-locker deployments at taxi ranks reduced failed deliveries by 30%, and Checkers Sixty60 placed dark stores within 10 kilometers of 85% of urban households, extending coverage to peri-urban nodes.[2]DSV, “E-Commerce Logistics Solutions in South Africa,” DSV.com
Rapid Adoption of BNPL by Gen-Z Consumers Boosting Average Order Value
BNPL penetration grew fastest among shoppers aged 18-27, lifting average order value to ZAR 1,850 (USD 112.89), 67% higher than cash-on-delivery. Payflex surpassed 1.2 million active users in 2024 with default rates below 4%, demonstrating effective risk segmentation outside traditional credit bureaus. Fashion marketplaces embedding four-installment plans converted browsers who previously abandoned carts at payment stage.[3]Payflex, “Buy Now Pay Later Solutions,” Payflex.co.za
Entry of Global Fast-Fashion Marketplaces Catalyzing Cross-Border Volumes
Shein and Temu seized 37.1% of online apparel revenue in 2024 by leveraging direct-from-factory supply and price points that outweighed a 45% import levy. SARS removed the small-parcel VAT exemption, yet consumers continued absorbing additional costs for greater assortment breadth, signaling limited price elasticity in fast-fashion demand.[4]South African Revenue Service, “Customs and Excise Policy Updates,” SARS.gov.za
Restraints Impact Analysis*
| Restraint | (~) % Impact on CAGR Forecast | Geographic Relevance | Impact Timeline |
|---|---|---|---|
| Persistent Digital Payment Fraud Driving Cart Abandonment | -1.2% | Gauteng and Western Cape metros | Short term (≤ 2 years) |
| High Reverse-Logistics Cost for Fashion Returns | -0.9% | National, severe in cross-border and rural deliveries | Medium term (2-4 years) |
| Load-Shedding Disruptions to Fulfillment Centers' Uptime | -0.7% | Johannesburg, Durban, Port Elizabeth | Short term (≤ 2 years) |
| Customs Clearance Delays for Cross-Border Parcels | -0.5% | OR Tambo, Cape Town, Durban hubs | Short term (≤ 2 years) |
| Source: Mordor Intelligence | |||
Persistent Digital Payment Fraud Driving Cart Abandonment
Card-not-present fraud losses reached ZAR 1.2 billion (USD 0.073 billion) in 2024, prompting banks to deploy biometric authentication and device fingerprinting. Yet older and rural consumers lag in adopting these safeguards, keeping cart abandonment above 20% in high-value categories. Regulations mandate breach disclosure within 72 hours, but small merchants lack resources for end-to-end encryption, perpetuating consumer distrust.
High Reverse-Logistics Cost for Fashion Returns
Return expenses consumed up to 19% of order value in 2024, with Superbalist’s 26% return rate contrasting Shein’s sub-3% due to buyer-borne shipping fees. Domestic players trialed augmented-reality fitting tools, yet adoption remains below 5% of transactions on budget devices. The absence of pooled return networks forces retailers to absorb premium courier tariffs, hindering margin improvement.
*Our forecasts treat driver/restraint impacts as directional, not additive. The impact forecasts reflect baseline growth, mix effects, and variable interactions.
Segment Analysis
By Device Type (B2C): Smartphones Cement Transactional Primacy
Smartphones generated 71.42% of 2025 B2C sales and will advance at 9.03% CAGR to 2031, extending their lead as the device of choice for the South Africa E-commerce Market. The South Africa E-commerce Market size attached to mobile channels widens every quarter as entry-level Android handsets drop below ZAR 1,500 (USD 91.54). Platforms prioritizing lightweight code, offline carts, and one-tap payment convert at rates 30% higher than rivals relying on heavy scripts. Desktop transactions, 28% of sales in 2025, persist in high-consideration categories but continue ceding share as multi-screen shoppers finalize purchases on mobile.
5G coverage in Johannesburg, Cape Town, and Durban by mid-2025 unlocked video-rich discovery and live-stream shopping formats once bandwidth-constrained. Takealot’s personal-shopper program for mobile-only users and the uptick in WhatsApp catalog commerce underscore the cultural shift toward handheld retail. Tablet, smart-TV, and console commerce collectively represent less than 1% of sales, constrained by limited native applications and payment integrations.


By Payment Method (B2C): BNPL Gains from Credit-Access Gaps
Credit and debit cards retained 44.68% value share in 2025, but BNPL growth at 11.23% CAGR is set to outpace all alternatives. The South Africa E-commerce Market size linked to installment payments hinges on algorithmic credit scoring that circumvents traditional bureau data, widening access for unbanked youth. Digital wallets captured 18% of sales through tokenized security and QR-code ubiquity, while cash-on-delivery endured among first-time buyers wary of card fraud.
Regulatory ambiguity allows BNPL providers to avoid National Credit Act scrutiny for now, lowering compliance costs and enabling rapid product iteration. Fashion and electronics merchants report 60% higher average order values when BNPL is selected, illustrating its role in demand stimulation. Expect wallet and BNPL providers to converge through shared loyalty ecosystems, further squeezing interchange fees.
By Product Category (B2C): Quick-Commerce Propels Food and Beverages
Fashion and apparel held 24.67% revenue share in 2025, buoyed by Shein and Temu’s 37.1% hold on online clothing sales. However, food and beverages is forecast to grow at 11.68% CAGR, the fastest of any category, as dark-store networks slash fulfillment times to under 60 minutes in major metros. The South Africa E-commerce Market size attached to groceries expanded sharply after Checkers Sixty60 recorded ZAR 18.9 billion (USD 1.15 billion) sales in 2024 and extended web ordering in 2025.
Electronics, beauty, and furniture followed in the 12-16% share range, each benefiting from influencer marketing and warranty bundling. Toys and DIY remain seasonal, while niche categories such as pet care gain traction through curated subscription boxes. The 45% duty on fashion imports has not curbed demand, highlighting consumer willingness to absorb higher landed costs for greater assortment breadth.
By Business Model: B2B Platforms Accelerate Procurement Efficiency
B2C sales dominated 82.34% of the South Africa E-commerce Market in 2025, reflecting mature consumer platforms, yet B2B transactions are forecast to grow at 10.87% CAGR through 2031. The South Africa E-commerce Market size for B2B procurement is benefiting from wholesalers digitizing catalogs and offering real-time stock visibility. Makro’s 2024 portal reduced procurement lead times by 40%, and Amazon’s ZAR 1 monthly promotional seller fee attracted 10,000 micro-merchants by mid-2025, broadening SKU diversity. Small retailers view B2B marketplaces as a hedge against distributor mark-ups, a trend likely to erode traditional channel margins. Price transparency and embedded logistics are key advantages, while the Competition Commission’s mandate on Takealot is fostering a more level playing field.
Steady B2C expansion still underpins platform revenues, driven by BNPL-enabled spending among unbanked consumers and by deeper smartphone penetration in townships. Household reliance on online grocery delivery surged after Checkers Sixty60 achieved 100 million orders, proving the viability of quick-commerce economics. As discretionary categories mature, value migration toward subscription-based replenishment and private-label goods will shape competitive moats across both models.
Geography Analysis
Gauteng, Western Cape, and KwaZulu-Natal together generated 78% of gross merchandise value in 2025, mirroring income concentration and logistics infrastructure density. Gauteng leads the South Africa E-commerce Market with multiple fulfillment hubs in Johannesburg and Pretoria, and with smartphone penetration above 85%. The Western Cape’s 22% share is anchored in Cape Town’s tech-savvy consumer base that rapidly adopts BNPL and digital wallets. KwaZulu-Natal maintains roughly 15% share, although persistent load-shedding has pressed fulfillment centers to install diesel generators, inflating operating costs by up to 12%.
Rural provinces such as Eastern Cape and Limpopo are narrowing the digital divide as logistics players extend coverage. DSV’s 98.5% on-time delivery across 240 towns illustrates operational gains achievable through network densification, while smart-locker installations at taxi ranks enhance pickup convenience for commuters. ICASA’s allocation of mid-band spectrum has lowered data tariffs by 25% since 2023, though 5G rural roll-out still trails urban adoption.
Cross-border orders from Botswana, Namibia, and Lesotho contributed 3-5% of platform revenues in 2025. Customs throughput improved after the September 2024 single-window system went live, yet delivery lead times remain 2-3 days longer than domestic shipments owing to security screening and currency-conversion friction.
Competitive Landscape
The South Africa E-commerce Market has shifted from a near-duopoly toward a fragmented arena where quick-commerce grocers, global marketplaces, and fashion disruptors vie for share. Takealot’s usage hit 31.9% in 2024, but gross merchandise value slowed to single-digit growth as Checkers Sixty60 seized grocery momentum and Amazon recruited over 10,000 sellers in its first year. Regulatory remedies imposed on Takealot in 2023 forced it to separate its retail and marketplace arms, allowing smaller merchants to access traffic without restrictive price-parity clauses.
Fast-fashion imports remain disruptive. Shein and Temu surpassed a combined 37.1% revenue share in online apparel despite a 45% duty, compelling domestic retailers to accelerate private-label launches and negotiate Asian sourcing discounts. Walmart’s September 2025 launch of branded stores introduces a hybrid model that integrates Massmart’s physical network with direct online fulfillment, further straining incumbent cost structures.
Technology differentiation hinges on dark-store automation, last-mile routing software, and customer-data analytics. Checkers Sixty60 operates micro-fulfillment centers within 10 kilometers of 85% of urban households, while Pick n Pay asap! redesigned its app and web interface in 2025, driving 40% sales growth. Emerging specialists, UCook, SoFresh, and Bash, leverage curated assortments and loyalty ecosystems to defend niche positions, though funding constraints limit aggressive scale-ups.
South Africa E-commerce Industry Leaders
Takealot Online (Pty) Ltd.
Care to beauty
Decathlon South Africa
SoFresh (Pty) Ltd.
Superbalist.com (Pty) Ltd.
- *Disclaimer: Major Players sorted in no particular order

Recent Industry Developments
- January 2026: Takealot launched a same-day delivery guarantee across Johannesburg and Cape Town after integrating Pingo’s routing engine into its fulfillment stack.
- September 2025: Walmart opened its first branded stores in South Africa, signaling an omnichannel push that heightens rivalry in grocery and general merchandise.
- June 2025: Pick n Pay relaunched its asap! website, contributing to 200% growth in weekly orders and a 131% rise in first-time buyers.
- March 2025: Checkers Sixty60 introduced a web interface, broadening access beyond mobile users after surpassing 100 million cumulative orders.


South Africa E-commerce Market Report Scope
The South Africa E-commerce Market Report is Segmented by Business Model (B2C, B2B), Device Type (Smartphone/Mobile, Desktop and Laptop, Other Device Types), Payment Method (Credit and Debit Cards, Digital Wallets, Buy Now Pay Later, Other Payment Methods), Product Category (Beauty and Personal Care, Consumer Electronics, Fashion and Apparel, Food and Beverages, Furniture and Home, Toys, DIY and Media, Other Product Categories), and Geography. The Market Forecasts are Provided in Terms of Value (USD).
By Business Model
| B2C |
| B2B |
By Device Type (B2C)
| Smartphone / Mobile |
| Desktop and Laptop |
| Other Device Types |
By Payment Method (B2C)
| Credit and Debit Cards |
| Digital Wallets |
| Buy Now Pay Later (BNPL) |
| Other Payment Methods |
By Product Category (B2C)
| Beauty and Personal Care |
| Consumer Electronics |
| Fashion and Apparel |
| Food and Beverages |
| Furniture and Home |
| Toys, DIY and Media |
| Other Product Categories |
| By Business Model | B2C |
| B2B | |
| By Device Type (B2C) | Smartphone / Mobile |
| Desktop and Laptop | |
| Other Device Types | |
| By Payment Method (B2C) | Credit and Debit Cards |
| Digital Wallets | |
| Buy Now Pay Later (BNPL) | |
| Other Payment Methods | |
| By Product Category (B2C) | Beauty and Personal Care |
| Consumer Electronics | |
| Fashion and Apparel | |
| Food and Beverages | |
| Furniture and Home | |
| Toys, DIY and Media | |
| Other Product Categories |


Key Questions Answered in the Report
How large is the South Africa E-commerce Market in 2026?
The market is valued at USD 41.86 billion in 2026 and is projected to reach USD 63.06 billion by 2031.
Which segment is growing fastest within South African online retail?
The B2B procurement segment is forecast to expand at a 10.87% CAGR through 2031, outpacing consumer channels.
What role does BNPL play in consumer spending?
BNPL accounts for a rising share of payments, forecast to grow at an 11.23% CAGR through 2031, and drives average order values 60-70% higher than single-payment purchases.
Where is geographic growth most pronounced?
Gauteng leads in absolute value, but rural provinces are catching up as logistics networks and mobile coverage expand.
Which companies dominate online grocery delivery?
Checkers Sixty60 and Pick n Pay asap! command the largest shares, with Checkers Sixty60 surpassing 100 million cumulative orders by early 2025.
How are global fast-fashion platforms affecting local retailers?
Shein and Temu hold more than one-third of online apparel revenue despite higher import duties, forcing domestic players to adjust pricing and supply chains.
Page last updated on:


