Market Overview
| Study Period | 2020 - 2030 |
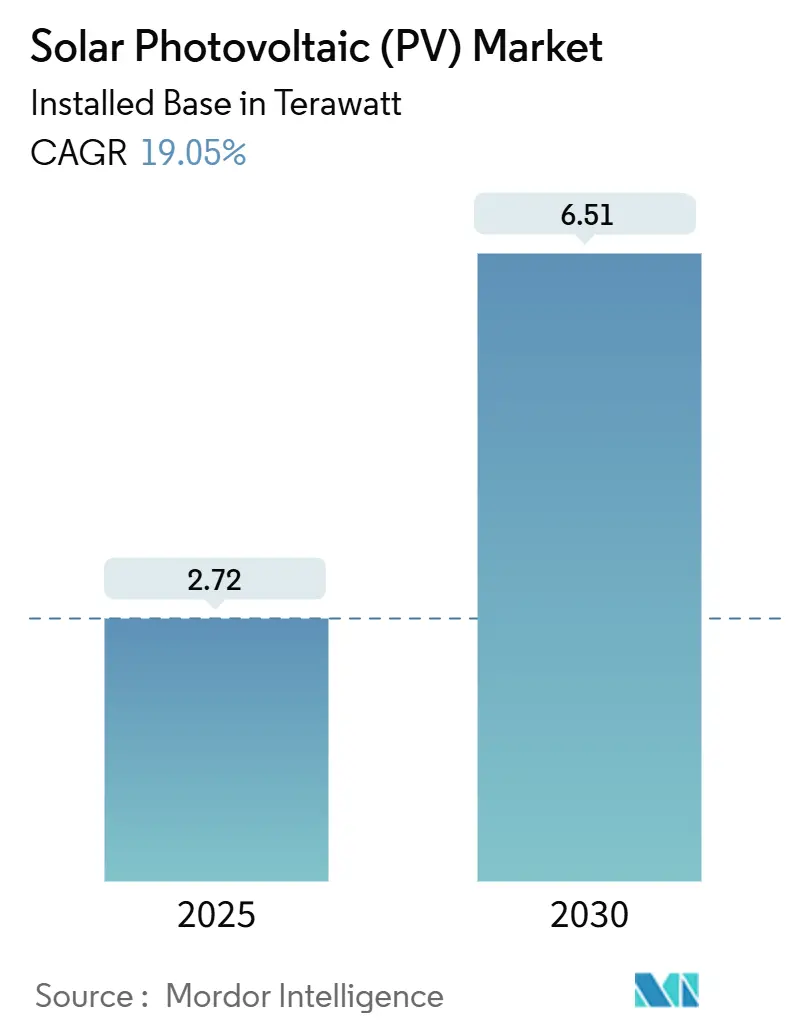
| Market Volume (2025) | 2.72 Terawatt |
| Market Volume (2030) | 6.51 Terawatt |
| Growth Rate (2025 - 2030) | 19.05% CAGR |
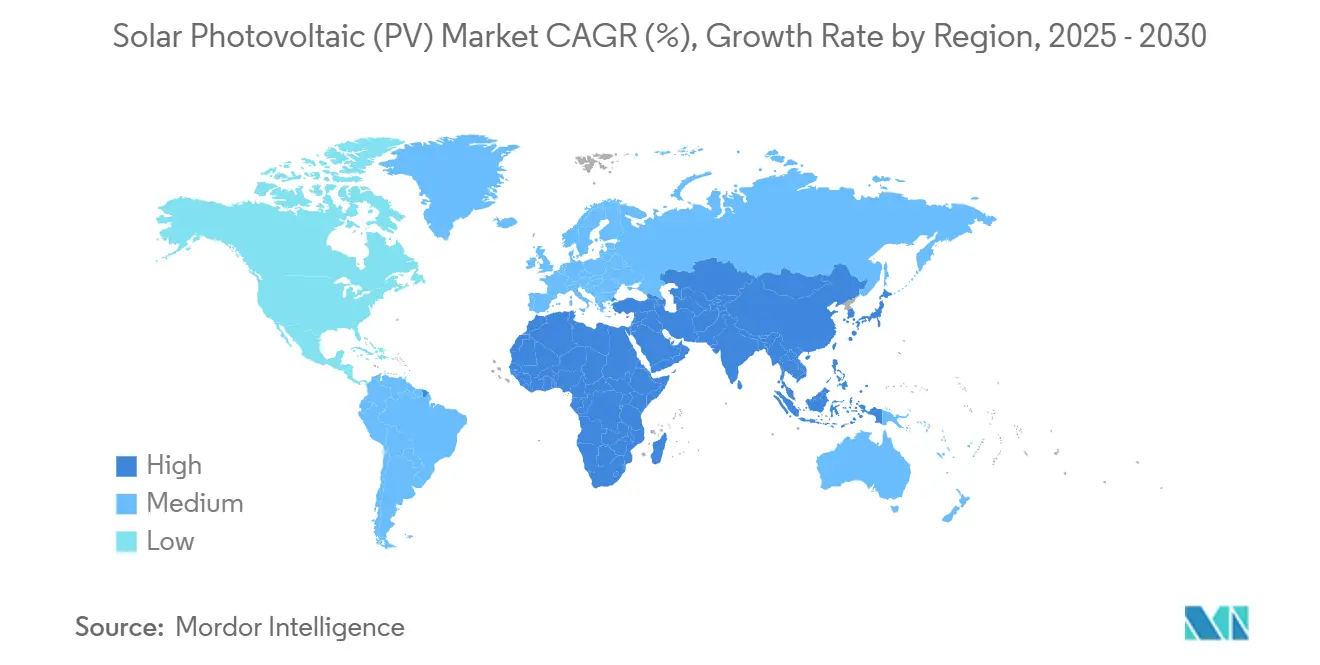
| Fastest Growing Market | Middle-East and Africa |
| Largest Market | Asia Pacific |
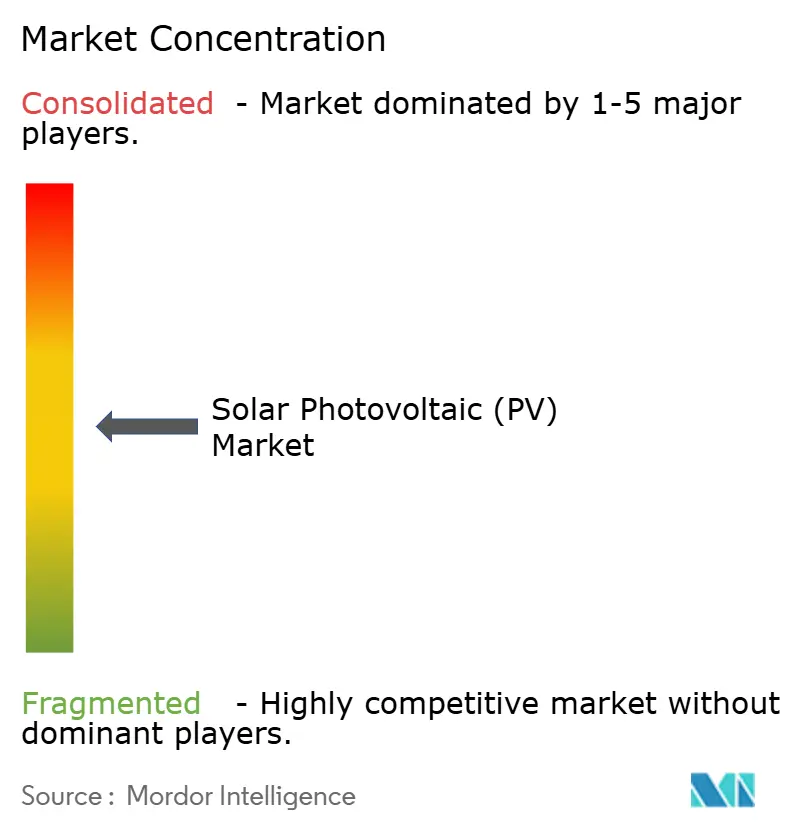
| Market Concentration | Medium |
Major Players*Disclaimer: Major Players sorted in no particular order Image © Mordor Intelligence. Reuse requires attribution under CC BY 4.0. |
|
Solar Photovoltaic (PV) Market Analysis by Mordor Intelligence
The Solar Photovoltaic Market size in terms of installed base is expected to grow from 2.72 Terawatt in 2025 to 6.51 Terawatt by 2030, at a CAGR of 19.05% during the forecast period (2025-2030).
Module cost declines, record-high cell efficiencies, and supportive policies have enabled the technology to undercut conventional generation across diverse geographies. Manufacturing capacity has climbed to 1.8 TW, underpinning robust supply even as demand accelerates. Monocrystalline cells remain the benchmark, though tandem and perovskite innovations are poised to disrupt the status quo. Strategic supply-chain reshoring—driven by the US Inflation Reduction Act, the EU Net-Zero Industry Act, and similar initiatives—introduces new regional growth vectors while tempering dependence on single-region production. Grid-integration hurdles, price volatility in polysilicon, and shifting trade regimes pose near-term risks, yet rising corporate 24/7 clean-power contracts and green-hydrogen ambitions anchor long-term demand. Across segments, utility-scale assets dominate today’s solar photovoltaic market, but residential and floating systems capture an expanding share as land constraints and energy-autonomy preferences intensify.
Key Report Takeaways
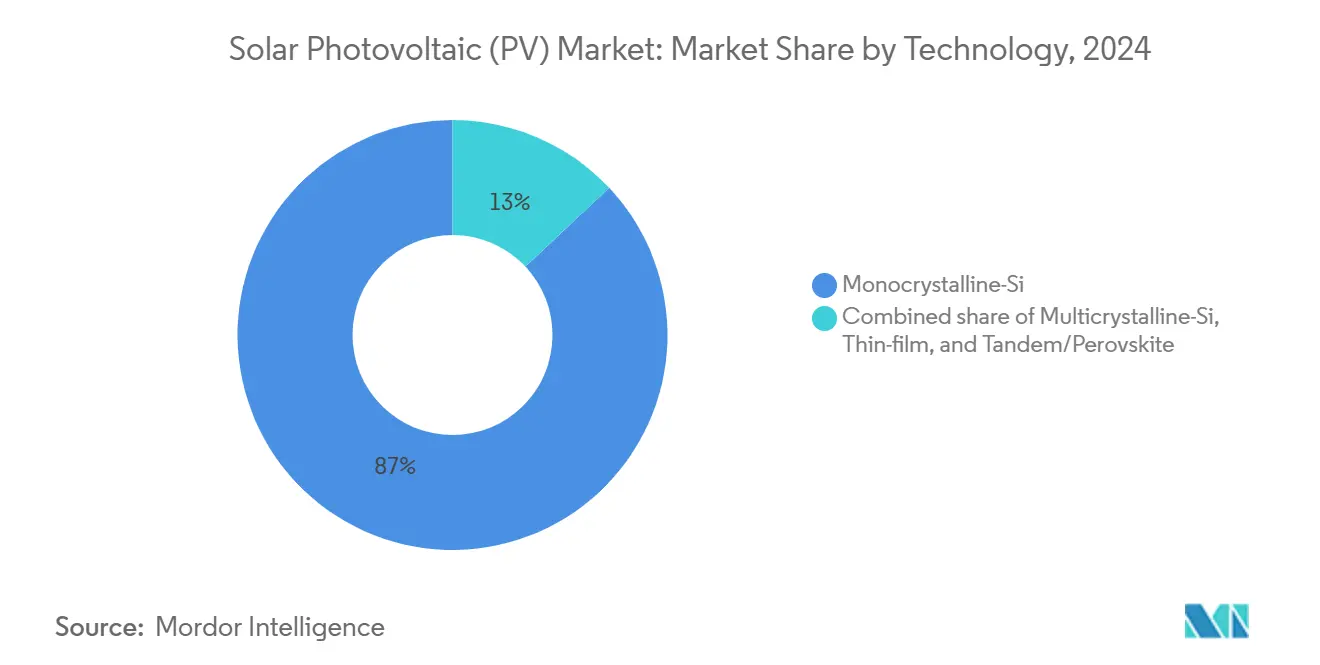
- By technology, monocrystalline-Si commanded 87% of the solar photovoltaic market share in 2024; tandem/perovskite cells are projected to grow at a 31% CAGR to 2030.
- By end-user, utility-scale systems held 63% revenue share in 2024, while residential installations are advancing at a 22% CAGR through 2030.
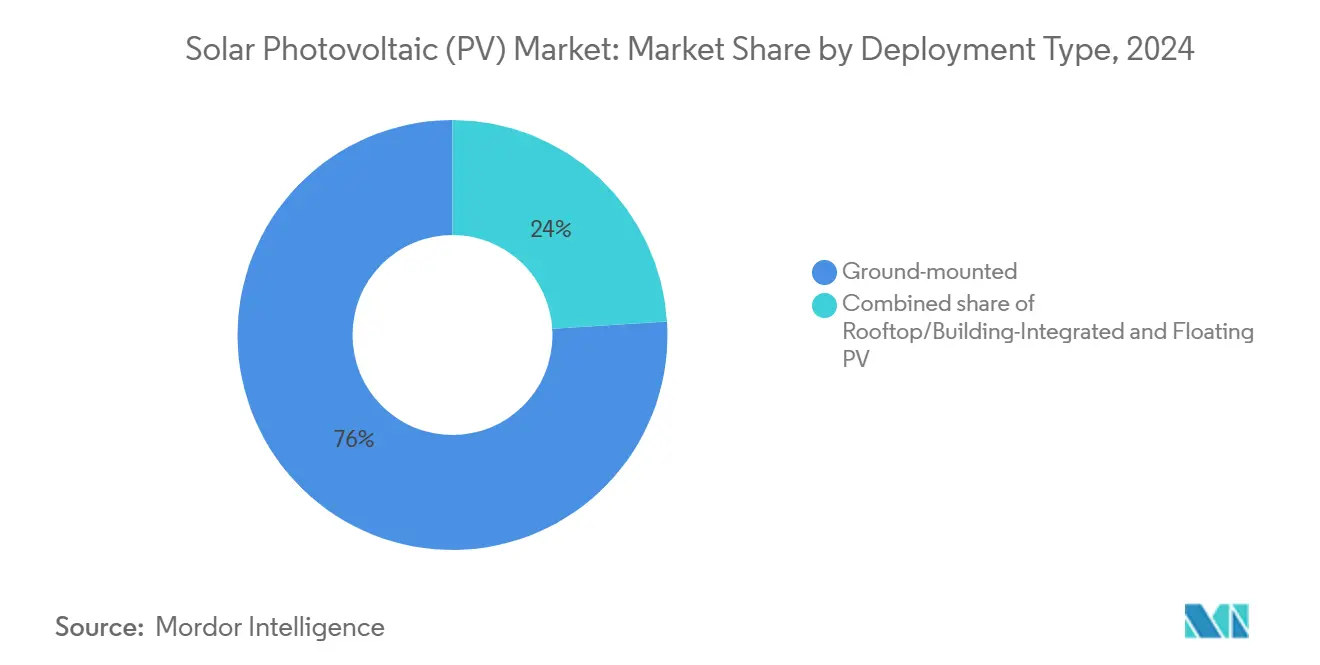
- By deployment type, ground-mounted arrays accounted for 76% of the solar photovoltaic market size in 2024; floating PV is expanding at a 30% CAGR between 2025–2030.
- By geography, Asia-Pacific maintained a 64% share of the solar photovoltaic market in 2024; the Middle East and Africa region is the fastest-growing, charting a 22% CAGR to 2030.
Global Solar Photovoltaic (PV) Market Trends and Insights
Drivers Impact Analysis
| Driver | ( ~ ) % Impact on CAGR Forecast | Geographic Relevance | Impact Timeline |
|---|---|---|---|
| Falling module ASPs widen grid-parity zones | +4.2% | Global, with accelerated adoption in emerging markets | Medium term (2-4 years) |
| IRA-driven on-shoring of PV manufacturing in the U.S. | +2.8% | North America, with spillover effects to allied markets | Long term (≥ 4 years) |
| AI-enabled solar forecasting cuts balancing costs | +1.5% | OECD markets with advanced grid infrastructure | Short term (≤ 2 years) |
| Demand from green-hydrogen electrolyzer projects | +2.1% | Middle East, Australia, Chile with renewable resource abundance | Long term (≥ 4 years) |
| Corporate 24/7 clean-power PPA commitments | +3.4% | Global, concentrated in North America and Europe | Medium term (2-4 years) |
| Agrivoltaics unlocks dual-land use revenues | +1.8% | Land-constrained regions: Europe, Japan, densely populated areas | Medium term (2-4 years) |
Source: Mordor Intelligence
Understand The Key Trends Shaping This Market
Download PDF
Falling Module ASPs Widen Grid-Parity Zones
Module prices fell 51.8% year-over-year in 2024, pushing several Chinese producers below break-even and prompting supply reductions that stabilize the trajectory of further declines. Grid parity is now achieved in 70% of global electricity markets, unlocking solar photovoltaic market penetration in regions once considered uneconomic. Saudi Arabia recorded a levelized cost of electricity of USD 10.4/MWh, illustrating cost leadership under strong irradiance.[1]Rystad Energy Analysts, “Solar Costs Hit Record Low in the Gulf,” Rystad Energy, rystadenergy.com Sub-Saharan Africa stands to gain as cost reductions converge with rising mini-grid demand. Trade actions and localized content rules may introduce regional price spreads, yet global median prices trend lower through 2026 as efficiencies climb.
IRA-Driven On-Shoring of PV Manufacturing in the US
Announced commitments exceeding USD 100 billion will quadruple US cell and module output and realign global supply networks. Hanwha Qcells is building an integrated ingot-to-module complex, and First Solar’s new thin-film line in Alabama boosts domestic capacity to 11 GW. Domestic content bonuses shave 10-20% from project costs, neutralizing historic Asian cost advantages. The initiative mitigates geopolitical risk but hinges on sustained policy continuity and incremental scale-driven learning curves.
AI-Enabled Solar Forecasting Cuts Balancing Costs
Machine-learning models deliver 89% irradiance-forecast accuracy, allowing grid operators to trim balancing reserves by 15-25% and accommodate higher variable output without additional storage.[2]U.S. Energy Information Administration, “California Curtailments Annual Update 2024,” U.S. Department of Energy, eia.gov CAISO avoided 274,000 MWh of curtailments in 2024 by deploying such tools. Beyond dispatch gains, generative AI supports predictive maintenance that can lift plant uptime and lower O&M expense by 10-15%. Deployment in emerging markets lags due to data-infrastructure gaps, suggesting a staged global rollout.
Demand from Green-Hydrogen Electrolyzer Projects
Electrolyzer schemes generally require 4–6 MW of dedicated solar per MW of hydrogen capacity, linking gigawatt-scale solar aspirations to industrial decarbonization agendas. Oman’s 450 MW solar plant for green ammonia epitomizes this synergy.[3]FuelCellsWorks Editors, “Oman Green Ammonia Project,” FuelCellsWorks, fuelcellsworks.com Only 7% of the global project pipeline met schedule milestones in 2024, underscoring execution risks. Nonetheless, premium offtake contracts and emerging carbon-pricing regimes enhance project viability, signposting a sizeable future load for the solar photovoltaic market once reforms accelerate.
Restraints Impact Analysis
| Restraint | (~) % Impact on CAGR Forecast | Geographic Relevance | Impact Timeline |
|---|---|---|---|
| Grid-congestion & curtailment risks in high-penetration regions | -2.8% | California, Texas, Germany, Australia with high renewable penetration | Short term (≤ 2 years) |
| Rapid polysilicon price swings squeeze producer margins | -1.9% | Global, with concentrated impact on Chinese manufacturers | Medium term (2-4 years) |
| Anti-dumping trade actions fragment supply chains | -2.1% | US, EU markets with trade protection measures | Long term (≥ 4 years) |
| Rising rooftop-fire regulations add balance-of-system costs | -0.8% | Developed markets with stringent safety standards | Medium term (2-4 years) |
Source: Mordor Intelligence
Grid Congestion and Curtailment in High-Penetration Regions
California curtailed 3.4 million MWh in 2024, a 29% jump that spotlights the mismatch between generation growth and transmission expansion. Texas could see solar curtailment rates rise to 19% by 2035 without major grid upgrades. Europe’s redispatch volumes may increase sixfold by 2040, costing operators and consumers alike. Regional coordination frameworks—such as the Western Energy Imbalance Market—demonstrate curtailment-reduction potential, yet typical lead times of seven to ten years for new lines keep the constraint front-of-mind for investors.
Rapid Polysilicon Price Swings Squeeze Producer Margins
A 51.8% price collapse in 2024 squeezed high-cost furnaces out of the market and triggered supply rationalization.[4]Gavin Maguire, “Polysilicon Market Volatility,” Reuters, reuters.com Although downstream buyers benefited, thin producer margins elevate default risk, threatening orderly supply. Forward-contracting and diversified sourcing partially mitigate exposure, but low-cost leaders continue to dictate pricing, creating periodic turbulence.
Segment Analysis
By Technology: Monocrystalline Dominance Faces Efficiency Disruption
Monocrystalline-Si modules supplied 87% of 2024 capacity and delivered system-level learning-curve gains that reinforce their cost leadership. This technology sits at the heart of the solar photovoltaic market size for the technology segment, which is projected to grow at a 19.05% CAGR to 2030. TOPCon cells captured 70% of new production lines because they raise efficiency without large capital retooling. Thin-film solutions like CdTe and CIGS retain niches in space-constrained or high-temperature applications. Tandem and perovskite architectures, with LONGi’s 30.1% lab-scale efficiency and Qcells’ 28.6% module milestone, attract venture funding that accelerates pilot lines and pushes theoretical yield ceilings higher. Heterojunction offers high open-circuit voltages but encounters metallization cost hurdles, while back-contact cells target aesthetics for building-integrated photovoltaics. Technology competition thus pivots on efficiency advancements, material availability, and production scalability—factors that collectively steer procurement decisions across the solar photovoltaic market.
Continued R&D ensures performance gains translate to lower balance-of-system costs, reinforcing monocrystalline leadership in the near term. Yet every 1 percentage-point efficiency jump trims active area by roughly 2%, a saving critical in urban or agrivoltaic settings. Investment momentum behind tandem cells indicates disruption potential, and first commercial shipments are plausible before 2027. The eventual diffusion pace will hinge on durability proofs and capex intensity. Until then, incremental upgrades—such as metallization pastes with higher silver fraction efficiency or bifacial enhancements—keep current lines competitive.
Note: Segment shares of all individual segments available upon report purchase
By End-User: Utility-Scale Leadership Challenged by Residential Acceleration
Utility-scale arrays delivered 63% of 2024 installations and benefit from superior land utilization, project finance structures, and grid-service provision. Corporate 24/7 clean-power contracts add predictable offtake that derisks large plants, giving hyperscalers significant influence over the solar photovoltaic market. Residential uptake, however, is growing at a 22% CAGR, driven by improved loan products and supportive net-metering frameworks. The residential segment accounted for 21% of the solar photovoltaic market size in 2024 and gains share steadily as digital platforms slash customer-acquisition costs and as energy-independence narratives resonate with homeowners.
Commercial and industrial rooftops occupy the middle ground, bundling tax advantages with lease financing. Rising interest rates moderated residential demand in late 2024, yet securitization of loan portfolios stabilizes lender appetite. Utility portfolios continue to integrate storage to match 24/7 commitments, while community-solar programs extend access to renters and low-income subscribers. Diverse end-user dynamics collectively sustain broad-based growth across the solar photovoltaic market.
By Deployment Type: Ground-Mounted Supremacy Meets Floating Innovation
Ground-mounted systems captured 76% of the 2024 deployment and remain the backbone of large-scale generation. High-throughput pile-driving, string inverters, and automated cleaning maintain CapEx advantages. Floating PV, though accounting for a single-digit share, is expanding at 30% CAGR as reservoirs, mining pits, and hydropower dams unlock idle water surfaces. Comparative studies show energy yields exceed land-based counterparts by up to 15% due to evaporative cooling. JinkoSolar’s proposed 1,440 MWh floating solar-plus-storage project underscores the scale potential. Rooftop and building-integrated arrays absorb rising demand where land is scarce, and vertical installations offer fire-safety and snow-shedding benefits.
Agrivoltaics bridges energy and agriculture, occupying 62,000 US acres and delivering 10 GW by 2024. Policy frameworks that link agricultural productivity metrics to permit approval influence project cadence but also assure co-benefit credibility. Ground-mounted dominance will persist, yet floating and agrivoltaic models open fresh addressable markets, ensuring the solar photovoltaic market keeps evolving.
Note: Segment shares of all individual segments available upon report purchase
Geography Analysis
Asia-Pacific contributed 64% of global installations in 2024, driven by China’s integrated supply chain and sustained policy support. Domestic Chinese additions, plus exports into Southeast Asian assembly hubs, kept the global module supply abundant. India’s production-linked incentive program draws gigawatt-scale fabs as firms hedge against US and EU trade barriers. Japan pilots floating PV arrays atop irrigation ponds, while Australia intensifies rooftop adoption, boosting distributed capacity. These developments anchor Asia-Pacific’s role as the historical and ongoing nucleus of the solar photovoltaic market.
The Middle East and Africa region is growing at a 22% CAGR through 2030, propelled by Vision 2030 frameworks and green-hydrogen strategies. Saudi Arabia’s 58 GW target, the UAE’s 14 GW ambition, and Omani green-ammonia projects illustrate the shift from pilot programs to gigawatt build-outs. Africa exceeded 16 GW cumulative capacity in 2023; investment pipelines exceed 100 GW for 2030, contingent on concessional finance. Local module-assembly lines and bilateral power-purchase contracts with mining firms mitigate currency-risk exposure and strengthen bankability.
North America leverages IRA incentives to restore domestic production and attract downstream investment. Corporate procurement remains the region’s prime demand driver, with hyperscaler data-center growth elevating baseload renewable requirements. Europe intensifies focus on energy security and de-risking Chinese dependency; coordinated tenders accelerate rooftop adoption and hybrid plants that blend storage with PV. South America capitalizes on stellar irradiation; Chile’s Atacama Desert records capacity factors above 30%, enabling record-low tariffs. Across regions, policymaking, resource endowments, and financing ecosystems collectively sculpt uptake trajectories in the solar photovoltaic market.
Competitive Landscape
Market concentration is moderate. The combined share of the top five suppliers approaches above 50% as Chinese incumbents dominate polysilicon, ingots, and modules. Trade remedies and domestic-content mandates open space for regional challengers in the US, India, and the Middle East. Technology supremacy, evidenced by TOPCon’s 70% capture of new lines, drives differentiation. Litigation—such as Maxeon’s TOPCon patent suit—highlights intellectual-property salience and the shifting nature of competitive advantage.
Vertical integration is rising: Hanwha Qcells reallocates USD 2.5 billion toward a fully integrated US value chain, while DAS Solar’s 3 GW French facility aligns with EU strategic-tech goals. Cost volatility in polysilicon catalyzes backward integration by tier-one firms, insulating them against input shocks. Emerging players focus on niches—floating arrays, agrivoltaic trackers, or AI-enabled performance platforms—where service stacking yields margins beyond module commoditization. Venture capital targets software-defined assets, while traditional project finance favors proven component suppliers. Overall, rivalry intensifies as upstream consolidation meets downstream proliferation.
Solar Photovoltaic (PV) Industry Leaders
-
LONGi Green Energy Technology Co. Ltd.
-
Trina Solar Co. Ltd.
-
JinkoSolar Holding Co. Ltd.
-
JA Solar Technology Co. Ltd.
-
First Solar Inc.
- *Disclaimer: Major Players sorted in no particular order
Need More Details on Market Players and Competitors?
Download PDF
Recent Industry Developments
- June 2025: Hanwha Qcells has unveiled EcoRecycle by Qcells, a new business unit dedicated to overseeing the disposal of expired solar panels in the U.S. This move seeks to lessen the solar industry's environmental impact through the recycling of solar modules. EcoRecycle will kick off its operations at a site in Cartersville, Georgia, with ambitions to broaden its reach nationwide.
- April 2025: Corning expanded Michigan wafer-plant investment to USD 1.5 billion, scaling advanced wafer production.
- April 2025: Boviet Solar opened a 2 GW module factory in North Carolina, planning to double capacity by 2026.
- April 2025: Canadian Solar secured a 228 MW/912 MWh storage contract for Colbún’s project in Chile, deploying SolBank 3.0 technology.
Global Solar Photovoltaic (PV) Market Report Scope
Photovoltaic solar energy is a clean, renewable energy source that uses solar radiation to produce electricity. It is based on the so-called photoelectric effect, by which certain materials can absorb photons (light particles) and release electrons, generating an electric current.
The Solar Photovoltaic (PV) Market is segmented by product type, end-user, deployment and geography. By product, the market is segmented by thin film, multi-si, and mono-si. By end-user, the market is segmented by residential, commercial, and utility. By deployment, the market is segmented into ground-mounted and rooftop solar. The report also covers the market size and forecasts for the solar photovoltaic (PV) market across major regions. The market sizing and forecasts for each segment have been done based on installed capacity.
| By Technology | Monocrystalline-Si | ||
| Multicrystalline-Si | |||
| Thin-film (CdTe, CIGS, a-Si) | |||
| Tandem/Perovskite | |||
| By End-User | Residential | ||
| Commercial and Industrial | |||
| Utility-scale IPPs | |||
| By Deployment Type | Ground-mounted | ||
| Rooftop/Building-Integrated (BIPV) | |||
| Floating PV | |||
| By Geography | North America | United States | |
| Canada | |||
| Mexico | |||
| Europe | Germany | ||
| United Kingdom | |||
| France | |||
| Italy | |||
| Russia | |||
| Rest of Europe | |||
| Asia-Pacifc | China | ||
| India | |||
| Japan | |||
| South Korea | |||
| ASEAN Countries | |||
| Australia | |||
| Rest of Asia-Pacifc | |||
| South America | Brazil | ||
| Argentina | |||
| Rest of South America | |||
| Middle East and Africa | Saudi Arabia | ||
| United Arab Emirates | |||
| South Africa | |||
| Nigeria | |||
| Rest of Middle East and Africa | |||
By Technology
| Monocrystalline-Si |
| Multicrystalline-Si |
| Thin-film (CdTe, CIGS, a-Si) |
| Tandem/Perovskite |
By End-User
| Residential |
| Commercial and Industrial |
| Utility-scale IPPs |
By Deployment Type
| Ground-mounted |
| Rooftop/Building-Integrated (BIPV) |
| Floating PV |
By Geography
| North America | United States |
| Canada | |
| Mexico | |
| Europe | Germany |
| United Kingdom | |
| France | |
| Italy | |
| Russia | |
| Rest of Europe | |
| Asia-Pacifc | China |
| India | |
| Japan | |
| South Korea | |
| ASEAN Countries | |
| Australia | |
| Rest of Asia-Pacifc | |
| South America | Brazil |
| Argentina | |
| Rest of South America | |
| Middle East and Africa | Saudi Arabia |
| United Arab Emirates | |
| South Africa | |
| Nigeria | |
| Rest of Middle East and Africa |
Need A Different Region or Segment?
Customize Now
Key Questions Answered in the Report
How large is the solar photovoltaic market in 2025?
The solar photovoltaic market stands at 2,722.23 GW of installed capacity in 2025 and is on course to reach 6,511.11 GW by 2030.
Which region controls the largest solar photovoltaic market share today?
Asia-Pacific leads with a 64% share in 2024, reflecting China’s manufacturing and installation dominance.
What is driving the fastest growth in the solar photovoltaic market through 2030?
The Middle East and Africa region grows at a 22% CAGR, buoyed by ambitious national targets and green-hydrogen initiatives.
Which technology is poised to disrupt monocrystalline leadership?
Tandem and perovskite cells, already achieving 30% efficiency in the lab, are expected to enter commercial production before 2027.
How are trade actions affecting supply chains?
US and EU tariffs and forced-labor regulations spur reshoring and diversification, raising short-term costs but enhancing regional supply security.
What role do corporate PPAs play in solar demand?
Corporate 24/7 clean-power agreements added 46 GW in 2024 alone, securing offtake for utility-scale projects and encouraging storage integration.
Page last updated on: July 4, 2025

