
Smart City Communication Services Market Size and Share
Market Overview
| Study Period | 2020 - 2031 |
|---|---|
| Market Size (2026) | USD 45.22 Billion |
| Market Size (2031) | USD 90.13 Billion |
| Growth Rate (2026 - 2031) | 14.79 % |
| Fastest Growing Market | Asia-Pacific |
| Largest Market | North America |
| Market Concentration | Low |
Major Players *Disclaimer: Major Players sorted in no particular order Image © Mordor Intelligence. Reuse requires attribution under CC BY 4.0. | |
Smart City Communication Services Market Analysis by Mordor Intelligence
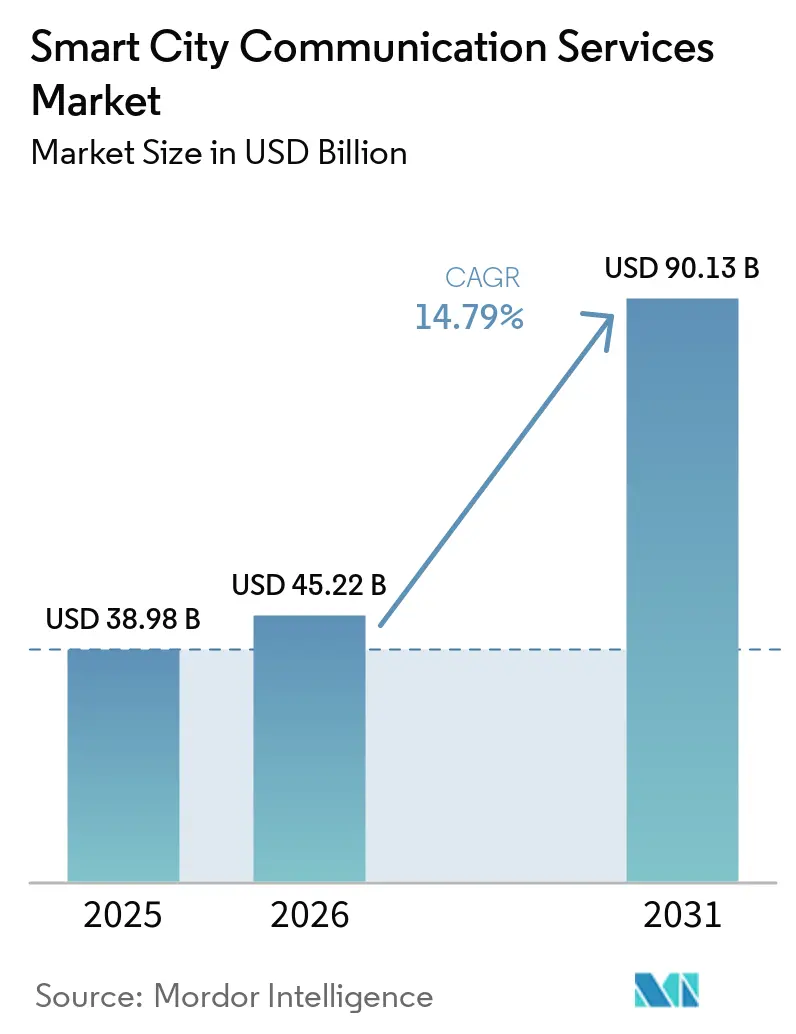
The Smart City Communication Services Market size was valued at USD 38.98 billion in 2025 and estimated to grow from USD 45.22 billion in 2026 to reach USD 90.13 billion by 2031, at a CAGR of 14.79% during the forecast period (2026-2031). Public authorities are moving from one-time notices toward continuous digital communication that supports service delivery, public safety, and resident participation. Government funding, 5G networks, cloud platforms, and artificial intelligence are making these systems more practical across city operations. Procurement increasingly favours platforms that join back-office processes with resident-facing channels and show whether people completed a service or received a needed alert. Competition, therefore, depends on dependable integration, inclusive design, and measurable service results rather than communication volume alone. Budget uncertainty, difficult legacy integration, cybersecurity exposure, and declining response to repeated digital messages remain material constraints for the smart city communication services market.
Key Report Takeaways
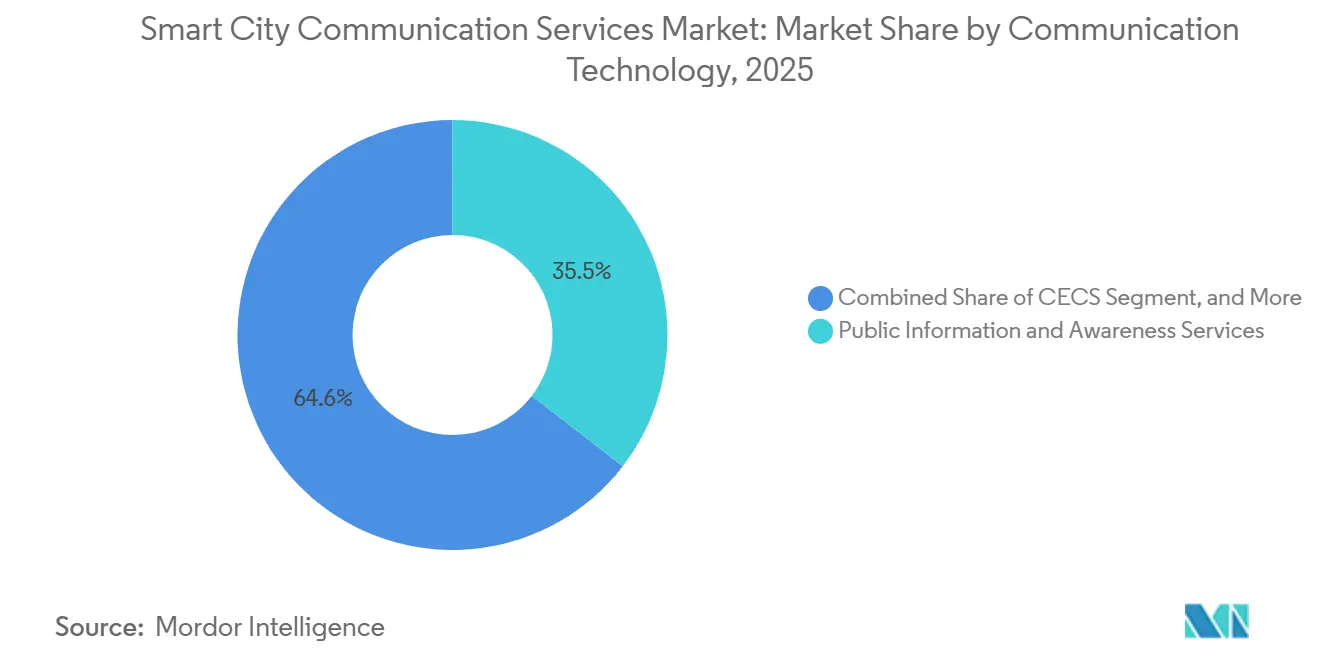
- By communication technology, Public Information and Awareness Services led the Smart City Communication Services Market with 35.45% revenue share in 2025, while Citizen Engagement and Consultation Services is forecast to expand at a 16.36% CAGR through 2031.
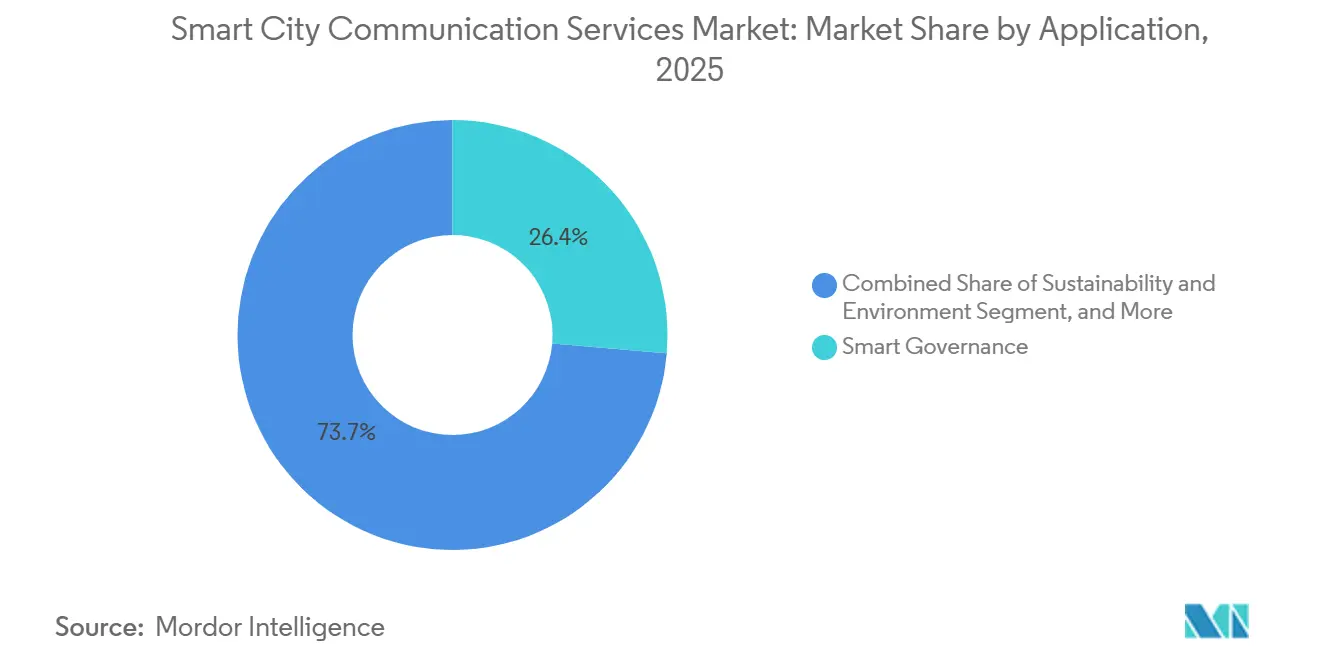
- By application, Smart Governance held the largest share in the Smart City Communication Services Market with 26.35% revenue share in 2025, while Sustainability and Environment recorded the highest projected CAGR at 16.57% through 2031.
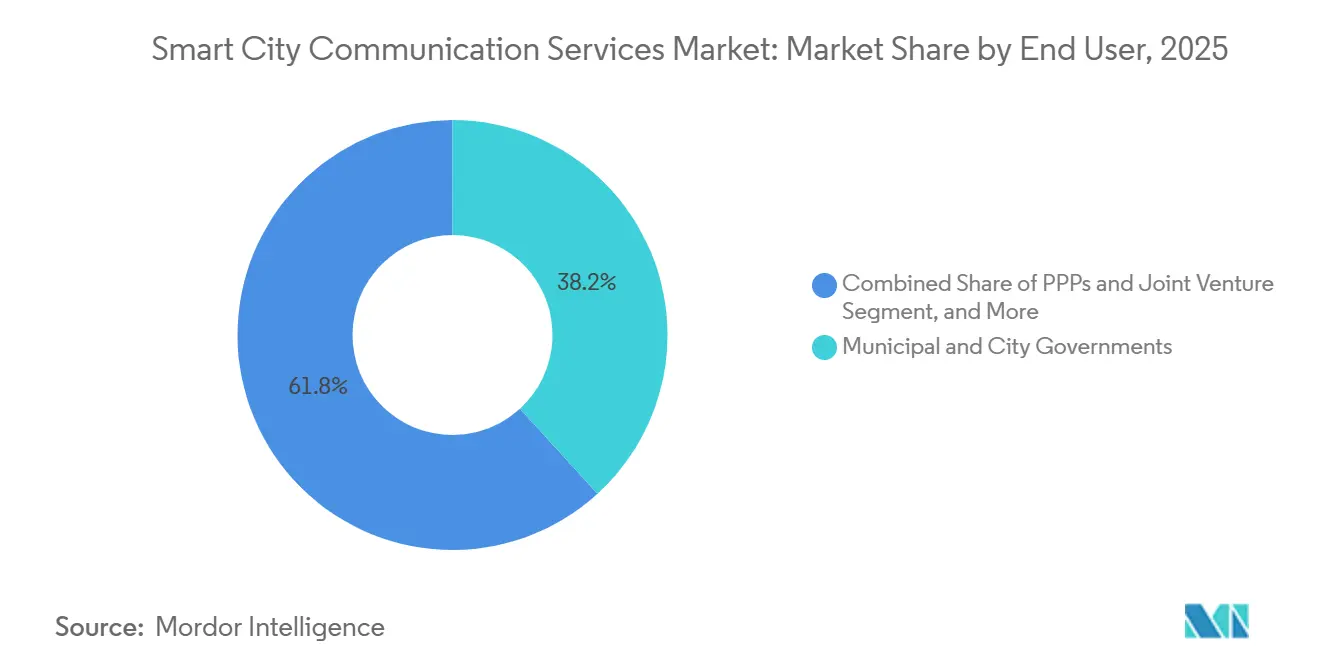
- By end user, Municipal and City Governments held 38.22% revenue share in the Smart City Communication Services Market in 2025, while Public-Private Partnerships and Joint Ventures recorded the highest projected CAGR at 16.24% through 2031.
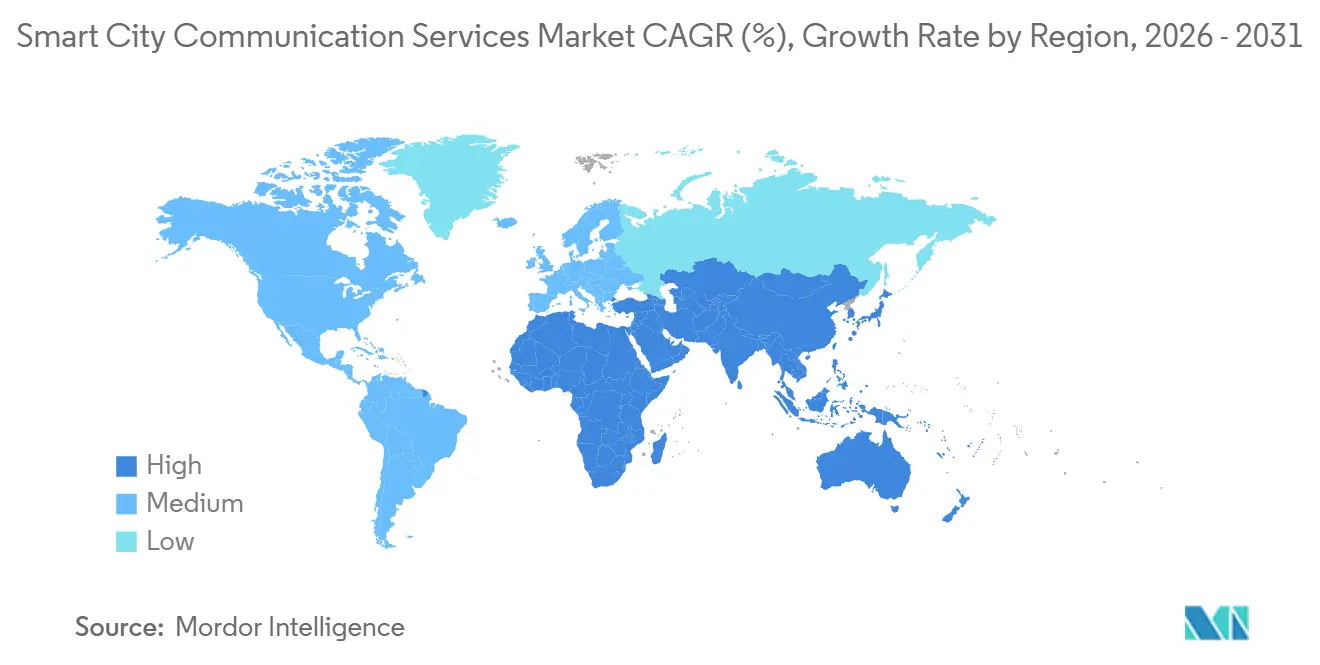
- By geography, North America held 38.42% revenue share in the Smart City Communication Services Market in 2025, while Asia-Pacific recorded the highest projected CAGR at 16.05% through 2031.
Note: Market size and forecast figures in this report are generated using Mordor Intelligence’s proprietary estimation framework, updated with the latest available data and insights as of January 2026.
Market Trends and Insights
Drivers Impact Analysis of Smart City Communication Services Market*
| Driver | (~) % Impact on CAGR Forecast | Geographic Relevance | Impact Timeline |
|---|---|---|---|
| Government-Funded Digital Governance and Smart City Programs | +3.5% | Global | Short term (≤ 2 years) |
| Shift to Cloud-Native, AI-Enabled, and Omnichannel Citizen Communication | +3.0% | Global, with leading adoption in North America and Asia-Pacific | Short term (≤ 2 years) |
| Rising Need for Emergency Alerts and Real-Time Public Safety Messaging | +2.0% | Global, acute in Europe and North America | Medium term (2-4 years) |
| Demand for Measurable Citizen Experience and Service Adoption Outcomes | +1.5% | North America and Europe | Medium term (2-4 years) |
| Accessibility Compliance Deadlines Create Budgeted Spend | +1.2% | North America, European Union | Short term (≤ 2 years) |
| Misinformation Response and Trust Rebuilding Elevate Official City Channels | +0.8% | Global, concentrated in Europe and North America | Short term (≤ 2 years) |
| Source: Mordor Intelligence | |||
Government-Funded Digital Governance and Smart City Programs
Government investment in urban digital infrastructure remains a durable source of demand for the Smart city communication services market. Spain launched the RedCyTI program in December 2025, providing EUR 89 million, USD 96.3 million, for 59 local smart city digitalization initiatives supported by the European Regional Development Fund.[1] South Korea is running its 2026 AI City Innovation Technology Exploration Program with KRW 30 billion (USD 21.74 million) for AI-enabled urban transportation, environmental, and citizen safety services.[2] In the United States, H.R. 4649 authorizes USD 100 million each year for smart city technology demonstration grants, including communication services. Such programs support multi-year procurement and reduce dependence on annual local budget decisions. This funding structure gives vendors clearer renewal opportunities while allowing cities to plan broader service platforms.
Cloud-Native, AI-Enabled, and Omnichannel Citizen Communication
The shift from separate government portals to connected communication platforms is reshaping supplier priorities in the Smart city communication services market. Granicus released its January 2026 platform update with Government Experience Agent capabilities and planned voice, SMS, and WhatsApp support, alongside a customer data platform for segmentation across email, service requests, and public meetings.[3] CivicPlus launched 6 AI products under its CivicPlus Intelligence initiative for more than 12,000 government organizations that serve 340 million residents in the United States and Canada. The UK Government Digital Service launched GOV.UK Chat in May 2026, providing a government-controlled conversational channel within the GOV.UK app. These offerings shift attention toward channel coordination, resident preferences, and reliable handoffs to public service workflows. Cities that use several channels without shared data face a higher risk of duplicate messaging and uneven service quality.
Emergency Alerts and Real-Time Public Safety Messaging
Emergency warning upgrades create recurring demand for the Smart city communication services market because public authorities must maintain reliable alert coverage. Finland signed an agreement with Erillisverkot Group in May 2026 to implement FI-Alert, a cell broadcast warning system planned for activation by the end of October 2026. France's FR-Alert used 4G and 5G networks with an LB-SMS fallback and had recorded 93 activations and more than 400 test exercises by December 2025. Australia contracted for a National Messaging System in February 2025, with initial testing scheduled for mid-to-late 2026. A peer-reviewed urban alert prototype reported latency below 450 milliseconds, detection accuracy above 95%, and 99.1% delivery success across 12,000 concurrent devices. These programs raise expectations for interoperability, device coverage, and tested operational performance.
Measurable Citizen Experience and Service Adoption Outcomes
Public buyers increasingly expect the Smart city communication services market to support service completion rather than only awareness. Granicus reported that top-quartile agencies using detailed segmentation and preference-based personalization reached 58% citizen engagement, compared with an 11% sector median. Its report also stated that connecting communications to workflow automation reduced average permitting time from 14 days to 4 days and reduced project overruns by 40%. Tyler Technologies expanded its Resident AI Assistant in South Carolina after it handled more than 38,000 questions from over 10,800 users with an 82.2% first-contact resolution rate. These results make service outcomes more important in contract evaluation and renewal discussions. They also encourage cities to use targeted notices and preference management instead of sending more general messages.
Restraints Impact Analysis of Smart City Communication Services Market*
| Restraint | (~) % Impact on CAGR Forecast | Geographic Relevance | Impact Timeline |
|---|---|---|---|
| Budget Constraints and Long Public Procurement Cycles | -2.5% | Global, most pronounced in South America and Middle East and Africa | Long term (≥ 4 years) |
| Cybersecurity, Privacy, and Legacy Integration Risk | -1.8% | Global | Medium term (2-4 years) |
| Digital-Only Outreach Fatigue and Trust Gaps Reduce Participation Quality | -1.0% | North America and Europe | Medium term (2-4 years) |
| Multilingual and Inclusive Communication Mandates Raise Delivery Complexity | -0.7% | Global | Long term (≥ 4 years) |
| Source: Mordor Intelligence | |||
Budget Constraints and Long Public Procurement Cycles
Budget pressure and prolonged procurement processes can slow deployment in the Smart city communication services market, especially where digital programs are not yet part of regular operating budgets. Bitkom identified permanent financing beyond project periods and innovation-friendly procurement as priority needs for smart cities in Germany. A gap between project grants and renewal funding can disrupt multi-year platform contracts. European Union and North American procurement cycles may take 18-36 months from defining requirements to launch. That timing can leave cities using older systems while vendor product plans move ahead. Rules intended to provide accountability can also favour established suppliers with prior public-sector references.
Cybersecurity, Privacy, and Legacy Integration Risk
Cybersecurity and integration requirements can delay buying decisions in the Smart city communication services market. A 2025 peer-reviewed review identified scalability, interoperability, regulatory compliance, and real-time threat detection as continuing security challenges for smart city data systems. The International Telecommunication Union approved Recommendation X.2013 in May 2025, setting security measures for digital twin federation in smart cities and communities. Municipal systems often combine legacy telephony, cloud engagement tools, and sensor networks. Each connection creates governance and operating responsibilities that standard service agreements may not fully address. Providers that demonstrate secure integration and clear data controls are therefore better positioned for complex public-sector projects.
*Our forecasts treat driver/restraint impacts as directional, not additive. The impact forecasts reflect baseline growth, mix effects, and variable interactions.
Smart City Communication Services Market Segment Analysis
By Communication Technology:
Awareness Services Lead While Consultation ExpandsPublic Information and Awareness Services held 35.45% of Smart city communication services market share in 2025, making them the largest communication technology category. Legally required emergency alerts, official information portals, and government notification networks create stable demand for these services. Their contracts often run over multiple years because cell broadcast nodes, notification middleware, and mass messaging platforms require ongoing maintenance. The Smart city communication services market continues to rely on these authoritative channels during emergencies and routine public information campaigns. GOV.UK Chat handled more than 15,000 questions during its first weeks after the May 2026 launch, showing how official information services are becoming conversational while remaining government-controlled.
Citizen Engagement and Consultation Services (CECS) is projected to grow at a 16.36% CAGR from 2026 to 2031. Digital participation tools support consultation on local projects, service plans, and community priorities. Germany's Smart City Index 2025 found that 89% of surveyed cities used online participation platforms and 45% had deployed chatbots for citizen inquiries. Go Vocal operates across 14 countries, while Salt Lake City's deployment reached more than 10% of residents and supported more than 25 projects in its first year. Behavioural and Community Outreach Services support public health, sustainability, and neighbourhood campaigns. Their steadier development reflects demand for evidence that outreach changes behaviour rather than only generating interactions.

By Application:
Smart Governance Remains Central While Sustainability Grows FasterSmart Governance accounted for 26.35% revenue share in 2025. Municipal administrations use these platforms for permitting budget transparency, case routing, and resident support. OpenGov expanded its AI-native Public Service Platform in April 2026, linking human capital management, budgeting, permitting, and workflow agents on a shared data foundation for 2,000 state and local government customers. Smart Mobility supports traffic notices and multimodal travel communication. Public Safety supports emergency notifications and coordination among first responders. Together, these applications show that communication services have become part of core operational workflows rather than a separate public relations function.
Sustainability and Environment is forecast to grow at a 16.57% CAGR from 2026 to 2031. City climate commitments require environmental data, targeted alerts, and clear guidance for residents on air quality, flooding, and energy use. The European Commission's SENSE project received EUR 3.86 million, USD 4.2 million, through the Digital Europe Programme to build inclusive CitiVerses connected with Climate-Neutral and Smart Cities Mission goals. Utilities and Resource Management also use dashboards and notifications to explain service activity. Urban Planning and Development uses similar channels to communicate infrastructure decisions and gather local feedback. These uses favour platforms that can present technical information in direct and accessible language.
By End User:
Municipal Governments Account for Most Spending While PPPs Gain GroundMunicipal and City Governments captured 38.22% revenue share in 2025. Local authorities own many resident-facing services and control a large share of digital governance budgets. They use communication systems for local information, complaints, permits, public meetings, and emergency updates. Specialized Public Agencies make up a second buyer group that includes transportation, environmental, and public health authorities. Regional and National Government Bodies also procure national portals and large emergency warning infrastructure. India's National Urban Digital Mission targets accessible digital governance across 4,400 towns and cities, demonstrating the scale of national programs that can support local service delivery.
Public-Private Partnerships and Joint Ventures is projected to grow at a 16.24% CAGR from 2026 to 2031. These arrangements allow private capital and operational expertise to support digital communications infrastructure. Kuwait signed a 50-year agreement in May 2026 with Beyon for a national fixed telecommunications network with investment above KWD 825 million, USD 2.69 billion, to support smart cities, AI applications, and digital government services. India's Vadodara smart pole project used a public-private model in which the private partner recovered costs through digital advertising and telecommunications equipment leasing. Such models can reduce direct municipal funding needs for public alert and surveillance capability. They also require clear service standards and governance arrangements to protect public accountability.
Geography Analysis
North America Smart City Communication Services Market
North America accounted for 38.42% of Smart city communication services market share in 2025. Mature civic technology procurement, high smartphone use, and federal and state digital requirements support regional demand. The U.S. Department of Justice finalized its ADA Title II web accessibility rule in 2024, with an April 26, 2027, deadline for local governments serving more than 50,000 people. This requirement makes accessibility spending a dated procurement priority, while T-Mobile's February 2025 New York City agreement supports public safety departments and first responders. California's AB-2474 also requires a statewide master contract for interoperable alert and early warning software by July 1, 2027.
APAC Smart City Communication Services Market
Asia-Pacific is forecast to expand at a 16.05% CAGR from 2026 to 2031, the highest regional rate in the Smart city communication services market. Government-led smart city programs in India, Japan, and South Korea are creating repeated demand for digital service platforms. India launched the AI-powered Samadhan Didi voice chatbot in May 2026 so residents can register grievances in their preferred regional language. Tokyo's 2025 Smart City Plan aims for a Full Digital city hall by 2030, while South Korea's 2026 Smart City Data Hub project supports government data sharing for citizen communication platforms. These programs respond to language, scale, and access needs that differ across cities.
EMEA and South America Smart City Communication Services Market
Europe maintains substantial demand through its Digital Decade goals and the eGovernment Benchmark, which assessed digital transformation across 100 key public services in 2025. Germany's Smart City Index 2025 found that 71% of municipal services were available online and 45% of cities used AI chatbots. Stuttgart launched its revised participation portal in April 2026 with SUMM AI plain-language translation and 12 language versions through DeepL. South America and the Middle East and Africa are earlier-stage regions, although Brazil's 2026 Cidades Mais Inteligentes call and Kuwait's long-term network agreement point to growing public commitment.
Competitive Landscape
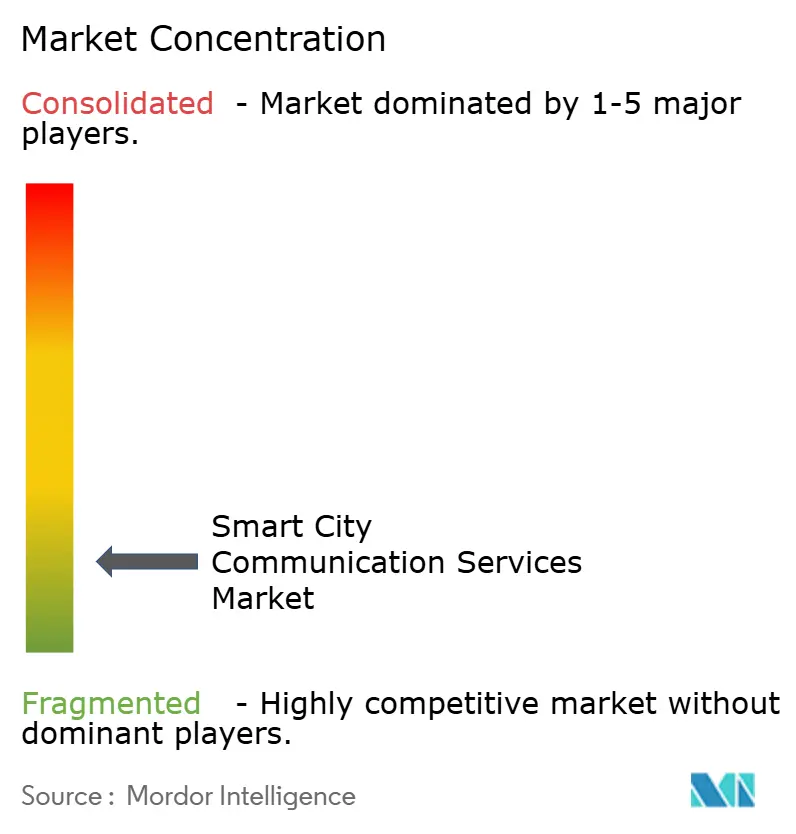
The Smart city communication services market is highly fragmented. Granicus, CivicPlus, Go Vocal, Bang the Table, Social Pinpoint, and PublicInput focus on citizen engagement and consultation. Microsoft, IBM, Cisco, Siemens, NEC, and Huawei compete for larger infrastructure, governance, public safety, and cloud programs. Amazon Web Services and Oracle provide cloud layers for municipal and civic technology applications. The Smart city communication services market favours providers that can connect communications with reliable government workflows.
Granicus introduced Government Experience Agent capabilities, planned voice, SMS, and WhatsApp support, and a customer data platform in January 2026. CivicPlus launched 6 AI products in January 2026, adding AI functions across its government software portfolio. Tyler Technologies expanded Resident AI Assistant Bradley across South Carolina in June 2026 after the service showed an 82.2% first-contact resolution rate. OpenGov expanded its Public Service Platform in April 2026 with human capital management, AI review for permitting, and an embedded AI assistant. These moves focus on connected workflows, channel coverage, and better use of first-party public service data.
Opportunities remain in predictive outreach and coordination across municipal departments. New suppliers offer low-code participation tools and multilingual communication for mid-sized cities that cannot support enterprise licensing costs. Interoperability standards and procurement transparency requirements raise technical and legal expectations for entrants.
Smart City Communication Services Industry Leaders
-
Granicus, LLC
-
CivicPlus, LLC
-
Tyler Technologies, Inc.
-
Microsoft Corporation
-
OpenGov, Inc.
- *Disclaimer: Major Players sorted in no particular order
Smart City Communication Services Market Companies Covered in this Report
- Granicus, LLC
- CivicPlus, LLC
- CitizenLab NV
- Bang the Table Pty Ltd
- Social Pinpoint Pty Ltd
- PublicInput, Inc.
- Nextdoor Holdings, Inc.
- Tyler Technologies, Inc.
- OpenGov, Inc.
- Microsoft Corporation
- International Business Machines Corporation
- Cisco Systems, Inc.
- NEC Corporation
- Siemens AG
- Huawei Technologies Co., Ltd.
- Oracle Corporation
- Amazon Web Services, Inc.
- SAP SE
- Schneider Electric SE
- Honeywell International Inc.
Recent Industry Developments in Smart City Communication Services Market
- July 2026: Andhra Pradesh, India, expanded its Mana Mitra WhatsApp governance platform to 1,126 state government services, embedding AI-powered grievance redressal, data integration, and citizen decision-support tools, establishing one of the largest conversational government service deployments by any state administration globally.
- June 2026: Tyler Technologies officially expanded its Resident AI Assistant "Bradley" across South Carolina state government. Since its September 2025 soft launch, Bradley answered over 38,000 questions from more than 10,800 unique users at an 82.2% first-contact resolution rate and supports 54 languages, making it the most publicly benchmarked AI communication assistant in U.S. state government.
- May 2026: Finland's Ministry of the Interior and Erillisverkot Group signed the FI-Alert implementation agreement for a new cell broadcast emergency warning system operational by October 2026, aligning Finland with the EU Alert standard and marking a significant national emergency communication infrastructure upgrade.
- May 2026: Kuwait's Ministry of Communications, the Kuwait Authority for Partnership Projects, and Beyon signed a 50-year PPP agreement for the Fixed Telecommunications Network Development Project, with total investment exceeding KWD 825 million, USD 2.69 billion, targeting smart city and digital government service enablement as primary use cases.
Global Smart City Communication Services Market Report Scope
The Smart City Communication Services Market Report is segmented by Communication Technology (Public Information and Awareness Services, Citizen Engagement and Consultation Services, and Behavioral and Community Outreach Services), Application (Smart Governance, Smart Mobility, Sustainability and Environment, Utilities and Resource Management, Public Safety, and Urban Planning and Development), End User (Municipal and City Governments, Specialized Public Agencies, Regional and National Government Bodies, Public-Private Partnerships (PPPs) and Joint Ventures, and Other End Users), and Geography (North America, South America, Europe, Asia-Pacific, and Middle East and Africa). Market Forecasts are provided in terms of Value (USD).
Segmentation Overview
| Public Information and Awareness Services |
| Citizen Engagement and Consultation Services |
| Behavioral and Community Outreach Services |
| Smart Governance |
| Smart Mobility |
| Sustainability and Environment |
| Utilities and Resource Management |
| Public Safety |
| Urban Planning and Development |
| Municipal and City Governments |
| Specialized Public Agencies |
| Regional and National Government Bodies |
| Public-Private Partnerships (PPPs) and Joint Ventures |
| Other End Users |
| North America | United States |
| Canada | |
| Mexico | |
| South America | Brazil |
| Argentina | |
| Rest of South America | |
| Europe | Germany |
| United Kingdom | |
| France | |
| Italy | |
| Spain | |
| Rest of Europe | |
| Asia-Pacific | China |
| Japan | |
| India | |
| South Korea | |
| Rest of Asia-Pacific | |
| Middle East and Africa | Saudi Arabia |
| United Arab Emirates | |
| South Africa | |
| Rest of Middle East and Africa |
| By Communication Technology | Public Information and Awareness Services | |
| Citizen Engagement and Consultation Services | ||
| Behavioral and Community Outreach Services | ||
| By Application | Smart Governance | |
| Smart Mobility | ||
| Sustainability and Environment | ||
| Utilities and Resource Management | ||
| Public Safety | ||
| Urban Planning and Development | ||
| By End User | Municipal and City Governments | |
| Specialized Public Agencies | ||
| Regional and National Government Bodies | ||
| Public-Private Partnerships (PPPs) and Joint Ventures | ||
| Other End Users | ||
| By Geography | North America | United States |
| Canada | ||
| Mexico | ||
| South America | Brazil | |
| Argentina | ||
| Rest of South America | ||
| Europe | Germany | |
| United Kingdom | ||
| France | ||
| Italy | ||
| Spain | ||
| Rest of Europe | ||
| Asia-Pacific | China | |
| Japan | ||
| India | ||
| South Korea | ||
| Rest of Asia-Pacific | ||
| Middle East and Africa | Saudi Arabia | |
| United Arab Emirates | ||
| South Africa | ||
| Rest of Middle East and Africa | ||
Key Questions Answered in the Report
What is the projected size of the smart city communication services market by 2031?
The Smart city communication services market is forecast to reach USD 90.1 billion by 2031, growing at a 14.79% CAGR from 2026.
Which communication technology category leads smart city communication services?
Public Information and Awareness Services led with 35.45% revenue share in 2025 and remain the largest category in the Smart city communication services market.
Which application is growing fastest in smart city communication services?
Sustainability and Environment is projected to grow at a 16.57% CAGR through 2031 as the Smart city communication services market supports environmental alerts and resident guidance.
Which region is expanding fastest for smart city communication services?
Asia-Pacific is forecast to grow at a 16.05% CAGR from 2026 to 2031, supporting a faster-growing Smart city communication services market in the region.
Why are emergency alert systems important to city communication programs?
National warning upgrades in Finland, France, and Australia show why the Smart city communication services market needs tested, interoperable systems that can reach residents quickly.
What factors can constrain adoption of smart city communication services?
Budget limitations, lengthy procurement, cybersecurity needs, legacy integration, and lower response to repeated digital outreach can slow the Smart city communication services market.