Market Overview
| Study Period | 2020 - 2031 |
|---|---|
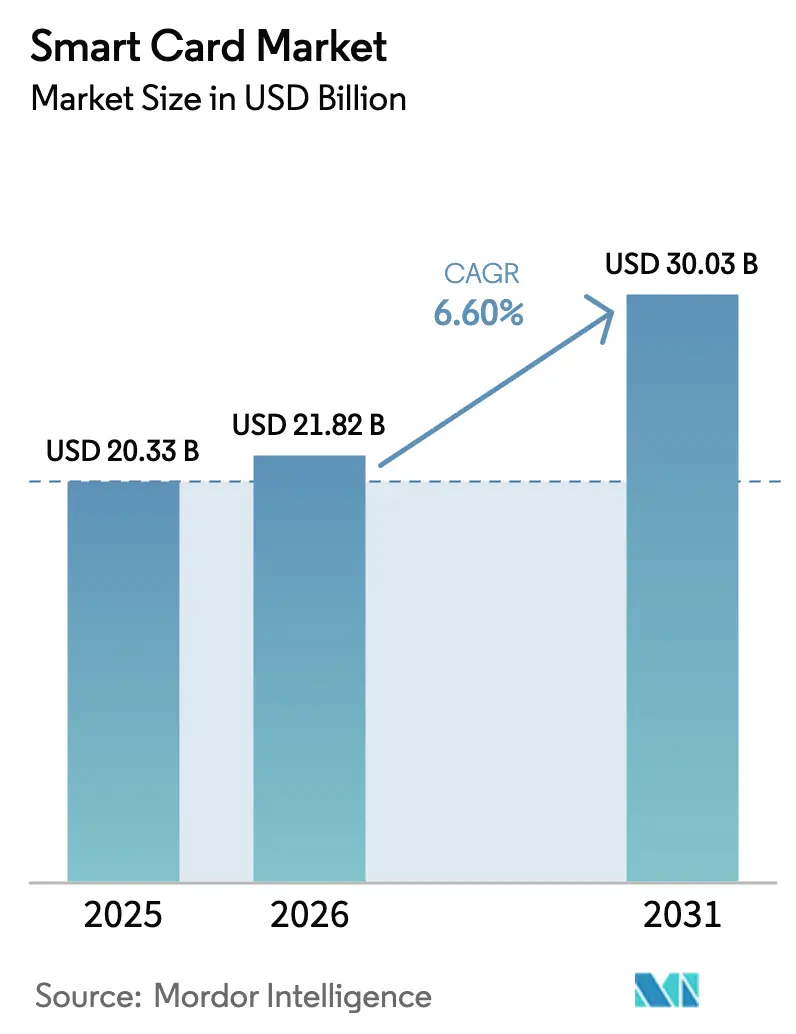
| Market Size (2026) | USD 21.82 Billion |
| Market Size (2031) | USD 30.03 Billion |
| Growth Rate (2026 - 2031) | 6.60% CAGR |
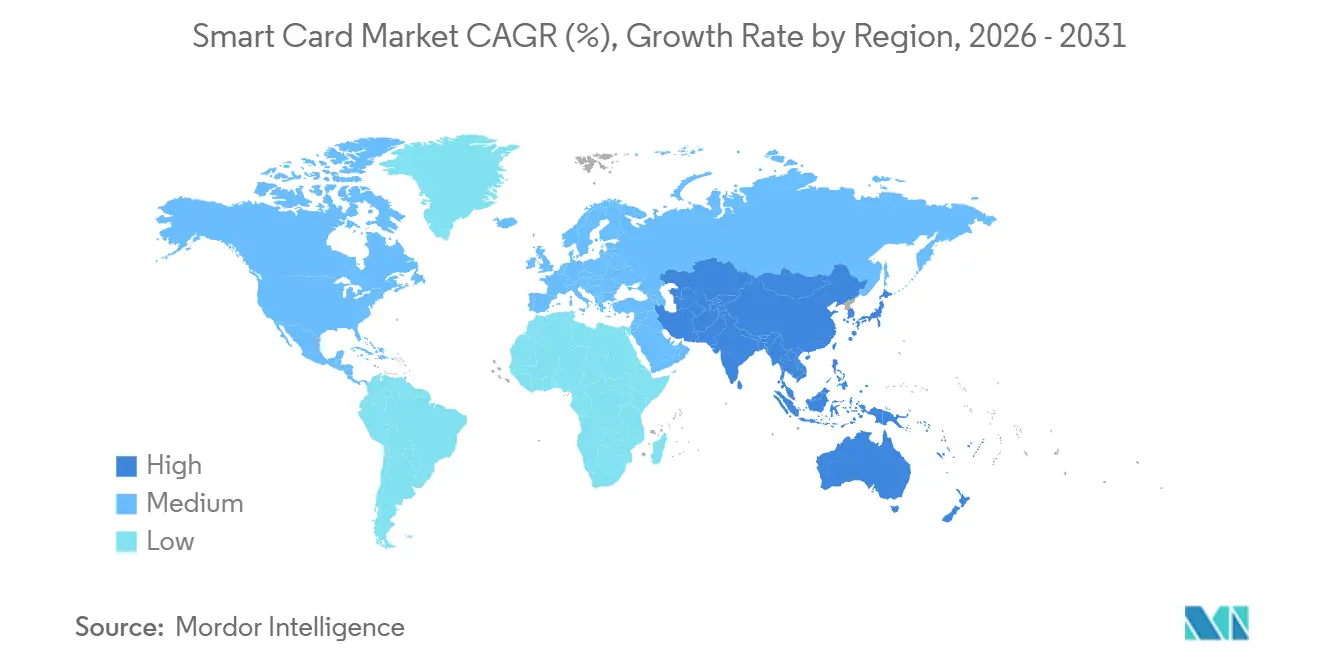
| Fastest Growing Market | Asia Pacific |
| Largest Market | Asia Pacific |
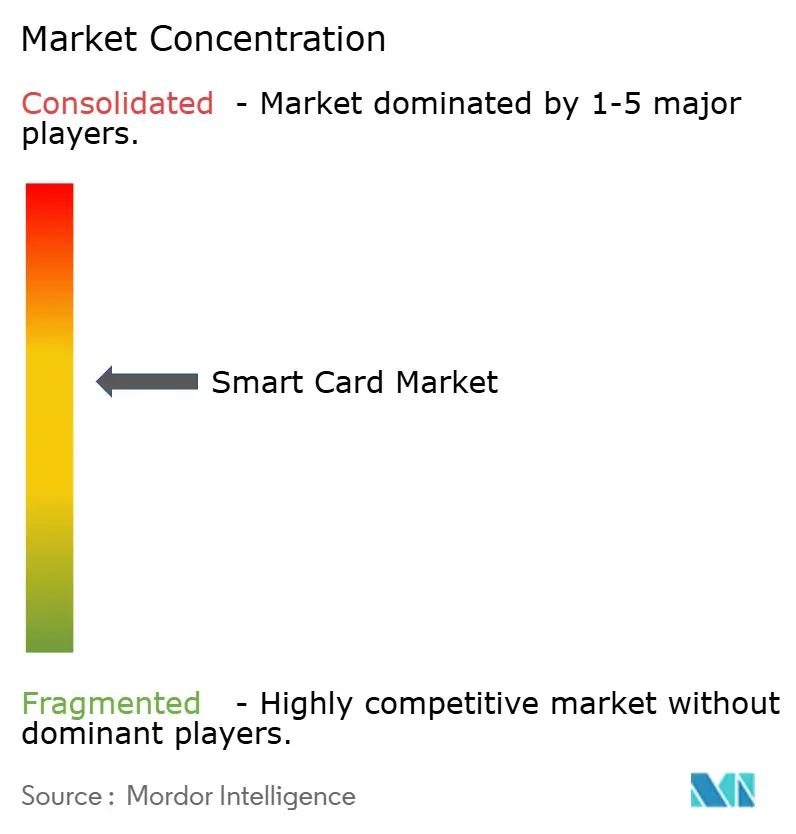
| Market Concentration | Medium |
Major Players *Disclaimer: Major Players sorted in no particular order Image © Mordor Intelligence. Reuse requires attribution under CC BY 4.0. | |
Smart Card Market Analysis by Mordor Intelligence
The smart cards market size is USD 21.82 billion in 2026 and is projected to reach USD 30.03 billion in 2031, registering a 6.6% CAGR during 2026-2031. Mandatory contactless EMV migration in emerging Asian economies, eIDAS 2.0 digital-wallet rules in the European Union, and corporate sustainability targets that favor polycarbonate substrates collectively pull demand beyond the payment sector into national digital-identity infrastructure. Unlike the pre-pandemic cycle, in which magnetic-stripe replacement dominated, today’s growth hinges on sovereign eID programs and decarbonization commitments that embed secure elements across transportation, healthcare, and welfare systems. Competitive intensity is rising as vertically integrated semiconductor vendors offer turnkey card modules, compressing margins for pure-play card bureaus but also lowering entry barriers for issuers in price-sensitive markets. These trends open multi-year opportunities for vendors that can balance regulatory compliance, material innovation, and supply-chain resilience.
Key Report Takeaways
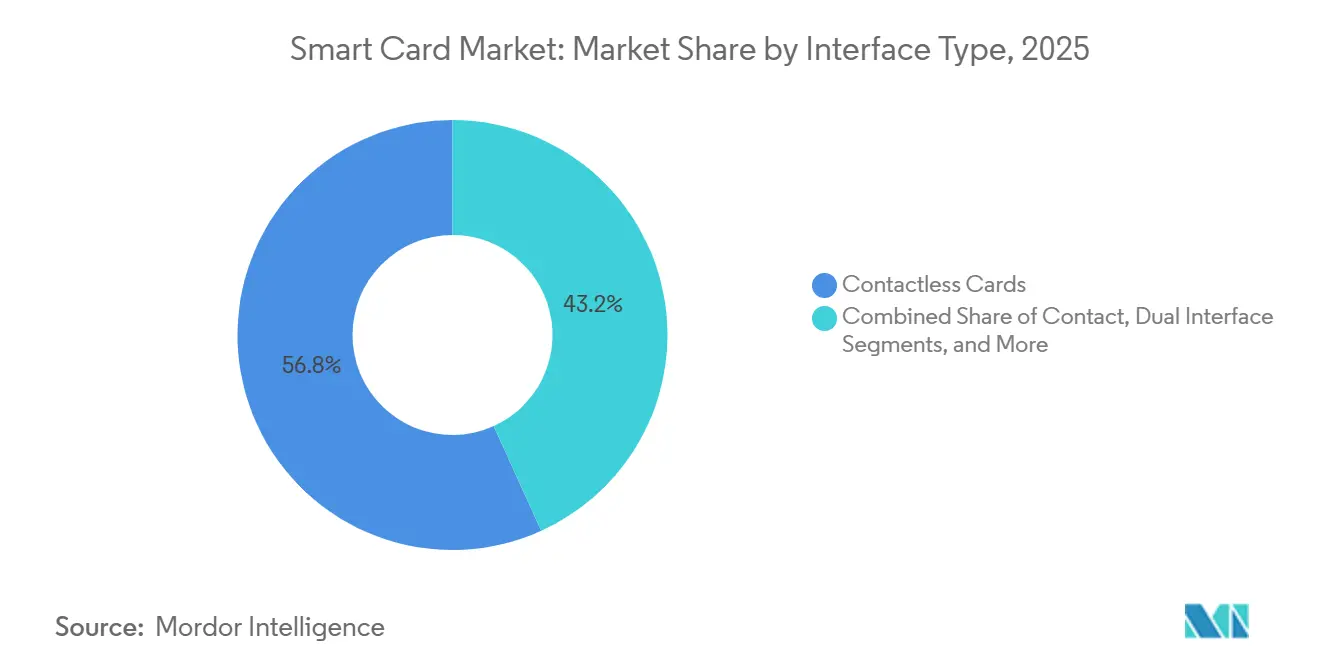
- By interface type, contactless cards captured 56.78% of the smart cards market share in 2025; dual-interface cards are projected to expand at a 6.82% CAGR.
- By chip type, microcontroller-based cards accounted for 66.59% of the smart card market in 2025, and secure-element cards are advancing at a 7.21% CAGR.
- By material, PVC retained a 38.17% share in 2025; however, polycarbonate cards are expected to grow at a 7.36% CAGR.
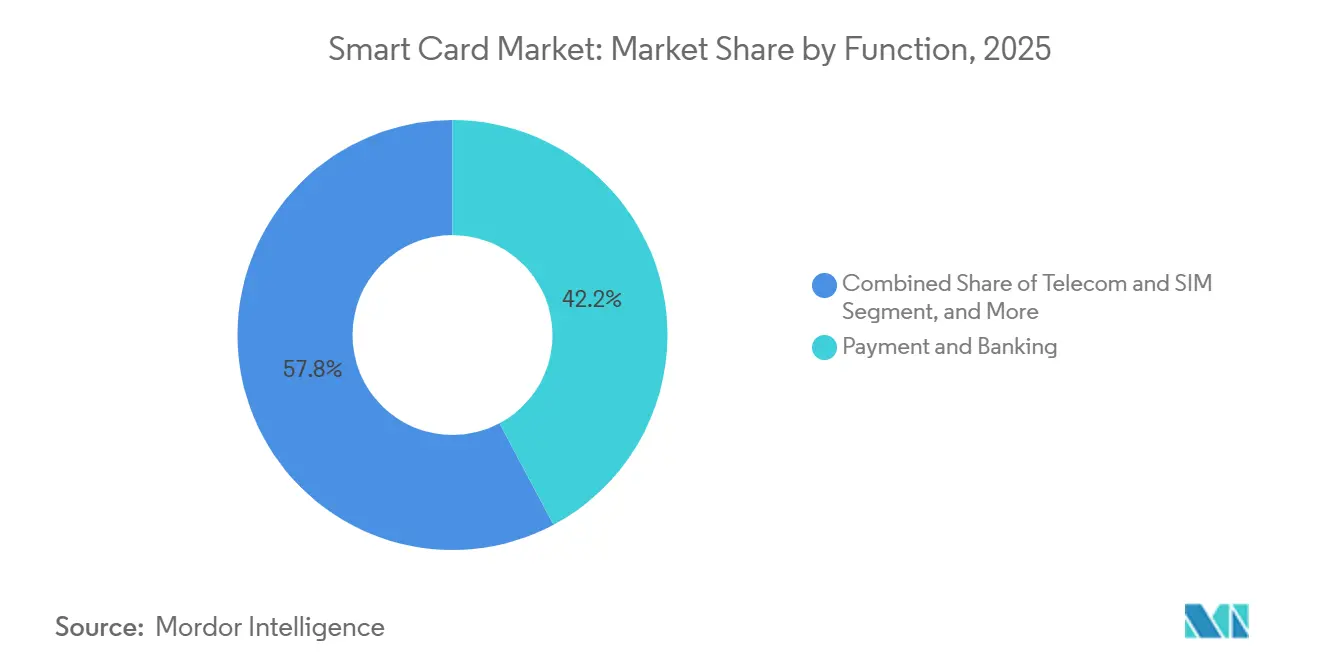
- By application, payment and banking accounted for 42.21% in 2025; identification and eID functions are projected to show the highest CAGR of 7.03% from 2026 to 2031.
- By end user, telecom commanded 58.47% of revenue in 2025, while BFSI recorded the strongest CAGR at 6.93% through 2031.
- By geography, the Asia-Pacific region led with a 54.11% revenue share of the smart cards market in 2025, while Asia-Pacific is projected to grow at around a 7.44% CAGR through 2031
Note: Market size and forecast figures in this report are generated using Mordor Intelligence’s proprietary estimation framework, updated with the latest available data and insights as of January 2026.
Global Smart Card Market Trends and Insights
Drivers Impact Analysis*
| Contactless EMV migration in emerging Asian economies | +1.8% | Asia-Pacific core, spill-over to South America and Africa | Medium term (2-4 years) |
|---|---|---|---|
| EU and GCC national eID and digital-health roll-outs | +1.5% | Europe and Middle East, pilot adoption in North Africa | Long term (≥ 4 years) |
| EU eIDAS 2.0 digital-wallet regulation adoption | +1.3% | Europe, early gains in Germany, France, Netherlands | Long term (≥ 4 years) |
| Pre-paid SIM expansion driving secure elements in LATAM | +1.2% | South America, especially Brazil, Argentina, Mexico | Medium term (2-4 years) |
| Sustainability-driven shift to recycled and bio-plastic cards | +0.9% | Global, led by North America and Europe | Long term (≥ 4 years) |
| Biometric FIDO2 on-card authentication uptake in Nordics | +0.7% | Sweden, Norway, Denmark, Finland | Short term (≤ 2 years) |
| Source: Mordor Intelligence | |||


Contactless EMV Migration in Emerging Asian Economies
Regulators in India, Indonesia, the Philippines, and Vietnam have set hard deadlines that push issuers to replace hundreds of millions of legacy magnetic-stripe cards with contactless dual-interface variants. India alone is upgrading 450 million RuPay debit cards by December 2026, synchronized with point-of-sale terminal mandates that guarantee acceptance. Similar moves in Indonesia and the Philippines pair regulatory compulsion with financial incentives, driving issuer adoption rates beyond 60% of new cards. Vietnam’s banks pre-ordered 35 million contactless cards in Q3 2025 to front-run a 2027 government deadline. These mandates accelerate volume demand, sustain antenna and inlay supply chains, and favor manufacturers that can bundle personalization services locally. The result is a predictable multi-year demand curve that lifts baseline volumes for the smart cards market.
EU & GCC National eID and Digital Health Card Roll-outs
Europe’s eIDAS 2.0 regulation requires every member state to issue digital wallets by 2026, pushing Germany, France, and others to distribute polycarbonate cards with embedded biometrics. Germany plans 45 million replacements, while France has a 30 million-card contract with IDEMIA. In the Gulf Cooperation Council, Saudi Arabia issued 12 million Absher Digital ID cards in 2025, and the United Arab Emirates shipped 8.5 million multi-application Emirates IDs. These programs embed payment, health, and travel credentials on a single secure element, locking in higher-value bill-of-materials and creating 8- to 10-year replacement cycles. Vendors that already hold Common Criteria certifications capture the first mover advantage, while laggards face long qualification timelines.
Pre-paid SIM Expansion Driving Secure Elements in Latin America
Brazil recorded 142 million active prepaid subscriptions in 2025, and Argentina now mandates eSIM-capable prepaid cards, forcing operators to adopt dual-interface secure elements.[1]ANATEL-Brazil, “Prepaid Mobile Subscription Statistics 2025,” anatel.gov.br Mexico’s biometric registration rule replaced 68 million SIM cards with secure-element variants, while Colombia cleared mobile money on SIM cards, generating orders for dual-application telecom-payment credentials. LATAM’s high churn rates exceeding 25% annually drive steady card replacement, shielding manufacturers from price erosion. Secure-element demand also positions telecom card suppliers to pivot into payment and ID markets as converged credentials gain traction.
EU eIDAS-2.0 digital wallet regulation adoption
Offline authentication, qualified electronic signatures, and cross-border interoperability make secure-element cards indispensable in the European digital-wallet stack. The Netherlands issued 8 million dual-interface eID cards in 2025, Spain ordered 20 million DNI electrónico cards, and Italy shipped 14 million Carta d’Identità Elettronica units. Qualified-signature cards command premiums of 40-60% over standard payment cards, padding margins for vendors that maintain European personalization hubs. As legal workflows digitize, enterprises purchase professional-grade cards for contract signing, expanding addressable demand beyond public-sector tenders.
Restraints Impact Analysis*
| Restraint | (~) % Impact on CAGR Forecast | Geographic Relevance | Impact Timeline |
|---|---|---|---|
| Rise of tokenised virtual cards reducing physical demand | -1.1% | North America and Europe, early adoption in urban Asia-Pacific | Short term (≤ 2 years) |
| Secure MCU supply-chain volatility | -0.8% | Global, acute impact in Asia-Pacific hubs | Medium term (2-4 years) |
| GDPR-driven delays in cross-border issuance platforms | -0.5% | Europe, spill-over to data-adequate partners | Long term (≥ 4 years) |
| Fraud migration to CNP channels curtailing NA card upgrades | -0.6% | North America, early signs in Western Europe | Short term (≤ 2 years) |
| Source: Mordor Intelligence | |||
Rise of Tokenised Virtual Cards Reducing Physical Demand
Visa, Mastercard, and American Express each reported double-digit growth in virtual-only commercial cards during 2025, with Amex issuing more virtual than physical corporate cards for the first time. Travel and procurement platforms prefer single-use tokens for real-time spend controls, reducing the need for bulk plastic. While consumer reissuance remains regulated, commercial volumes once 20% of issuer output are shrinking 8-12% annually in mature markets. Issuers counter by embedding token provisioning inside physical cards, yet that hybrid model extends card life, delaying reorders. Vendors that rely heavily on North American and European corporate issuance face the steepest volume erosion.
Secure MCU Supply-chain Volatility
Lead times for secure microcontrollers stretched to 38 weeks in 2024 and stayed elevated through 2025 as specialized fabs in Europe and Taiwan struggled with certification bottlenecks. Export-control rules under the United States CHIPS Act further delayed capacity additions in China, squeezing supply for SIM and ID card programs. Dual-sourcing raises per-unit chip costs by up to 18% and forces issuers to prematurely freeze specifications, limiting their agility in adopting new cryptographic standards. Supply risk, therefore, tempers near-term growth even as demand signals remain robust.
*Our forecasts treat driver/restraint impacts as directional, not additive. The impact forecasts reflect baseline growth, mix effects, and variable interactions.
Segment Analysis
By Interface Type: Dual-Interface Cards Bridge Legacy And Contactless Infrastructure
Contactless cards dominated the smart cards market with a 56.78% share in 2025. Dual-interface variants are rising at a 6.82% CAGR, reflecting issuers' need for backward compatibility with contact-only terminals in Eastern Europe, South America, and parts of Asia. The smart cards market size for dual-interface products is forecast to climb steadily as banks avoid transaction failures at merchants that still rely on chip-and-PIN readers. Germany’s Sparkassen and Japan’s megabanks ordered more than 40 million dual-interface cards in 2025 to straddle the infrastructure divide. Manufacturers benefit from 25-35% price premiums that outpace the 15-20% cost increase, thereby improving their gross margins. Contact-only cards are locked into niche welfare or closed-loop programs and will continue falling at a 2.1% CAGR. Hybrid cards used for converged payment, access, and IT authentication hold a 4.2% share and grow at a 5.8% CAGR, remaining attractive to corporate buyers that seek a single credential for multiple services.
The issuer's appetite for contact-only cards persists in government and defense, where a physical interface adds a security layer against relay attacks. Hybrid cards, embedding multiple technologies on a single substrate, satisfy niche enterprise requirements for logical and physical access convergence. The competitive narrative, therefore, shifts from mere interface type to value-added capabilities, such as biometric match-on-card and post-issuance personalization, themes that enable vendors to defend their margins in the smart card market.


By Card Chip Type: Secure Elements Gain Share As Biometrics Scale
Microcontroller cards commanded 66.59% market share in 2025, but secure-element and system-on-card designs are expanding at 7.21% CAGR as biometric authentication becomes mandatory in South Korea and popular across Europe. The smart cards market share for secure elements rises because they enable FIDO2-compliant fingerprint matching inside the card, avoiding backend verification. France’s Carte Vitale 2 and South Korea’s resident registration card exemplify migration away from server-dependent architectures. Memory cards decline as low-security loyalty programs move to mobile apps. Chip vendors that own foundry capacity, such as Infineon and Samsung, capture disproportionate value by bundling post-quantum cryptography roadmaps with silicon supply guarantees.
Memory-only cards remain relevant for mass transit and prepaid gift applications where cost sensitivity outweighs processing needs. Ultra-thin modules such as NXP’s MOB10 unlock new passport applications by improving durability against bending stress. Overall, the product-mix shift toward secure elements benefits semiconductor suppliers with certified Common Criteria product lines, sustaining a technology-led competitive moat within the smart card market.
By Material: Polycarbonate Substrates Rise On Sustainability And Durability
PVC kept a 38.17% share in 2025; polycarbonate is growing at a 7.36% CAGR as Mastercard and Visa mandate a phase-out of first-use PVC by 2028.[2]Mastercard-Newsroom, “Sustainable Card Materials Initiative,” mastercard.com Polycarbonate lasts 8-10 years, lowers the total cost of ownership, and meets EU Single-Use Plastics rules, making it the preferred upgrade path for mass-market issuers. Premium programs adopt metal substrates that deliver 3.2-times higher transaction volumes for issuers like JPMorgan Chase, justifying USD 25-35 per-unit costs. Bio-based PLA cards enter Scandinavian banks through Giesecke and Devrient’s 85% renewable product, signaling that the smart cards market will further segment by carbon intensity.
Metal and composite cards occupy the premium segment, serving affluent consumer propositions that emphasize perceived value and durability. Vendors such as CompoSecure have shipped more than 200 million metal units since 2010, signaling scalable demand for differentiated materials. Material choice thus becomes a lever for issuers to align sustainability, branding, and security objectives in an increasingly segmented smart card market.
By Function/Application: eID Outpaces Payment As Governments Digitize Credentials
Payment and banking retained 42.21% of the smart cards market in 2025, yet identification and eID cards are expanding at 7.03% CAGR as 28 countries scale chip-enabled national IDs. Qualified signature requirements lift average selling prices, offsetting the payment sector’s maturation. Telecom cards hold 18.3% share and still grow nearly 6% annually because prepaid SIM churn remains high in emerging markets. Transportation ticketing and healthcare credentials each post solid mid-single-digit growth, while retail loyalty cards slide as mobile applications cannibalize plastic.
Telecom SIM cards remain essential despite eSIM gains, as emerging markets still rely on removable form factors for device compatibility. Transit operators across 1,000 cities have adopted open-loop fare systems, embedding payment applets directly onto general-purpose cards. Diversified applications secure baseline growth even as digital alternatives proliferate.
By End-User Industry: BFSI Gains Revenue Share As Magnetic-Stripe Portfolios Expire
Telecom end-users contributed 58.47% revenue in 2025, anchored by 5.2 billion SIM cards. The BFSI segment, however, grows fastest at 6.93% CAGR as banks in Latin America and Eastern Europe transition expiring magnetic-stripe portfolios to EMV contactless formats. Government programs account for an 11.4% share and are expected to climb 7.1% CAGR on the back of digital-identity mandates. Healthcare providers are following with electronic health cards that integrate insurance and medical data, while retail and hospitality continue to move toward mobile wallets, reducing demand for physical cards.
Government projects expand steadily with national ID and social-security programs. Healthcare is gaining momentum through digital health card initiatives designed to unify insurance data and vaccination records. Retailers leverage co-branded loyalty cards with contactless payment capabilities, reinforcing omnichannel engagement and data collection strategies in the smart card market.
Geography Analysis
Asia-Pacific accounted for 54.11% of the smart card market revenue in 2025 and is growing at a 7.44% CAGR. India’s card base hit 1.08 billion, with contactless representing 64% of new issues. China upgraded 420 million SIM cards to secure elements to authenticate 5G networks. Japan processed 22 million dual-interface bank cards, and South Korea mandated biometric payment cards by 2027. Regulatory mandates, not discretionary spend, underpin this trajectory.
Europe accounted for a 23.7% share in 2025, advancing at a 6.8% CAGR as eIDAS 2.0 mandates universal digital wallet support. Germany produced 12 million eID cards in 2025, France issued 30 million eID cards, and the United Kingdom issued 9.2 million biometric residence permits. Eastern Europe benefits from EU cohesion funds, which accelerate EMV migration and lift dual-interface volumes. High security standards and the adoption of polycarbonate enhance average selling prices.
North America delivered 14.8% revenue share in 2025 and is forecast at a modest 5.9% CAGR. The United States completed EMV migration a decade earlier, so replacement now hinges on card expiration rather than technology upgrades. Canada already logs 87% contactless penetration, capping incremental growth. Mexico’s 2025 contactless deadline keeps regional demand steady. South America, the Middle East, and Africa collectively contribute less than 10% today, yet they are growing, as SIM churn and eID programs offset economic headwinds.

Competitive Landscape
Five vendors, Thales Group, IDEMIA, Giesecke and Devrient, Infineon Technologies, and NXP Semiconductors, held roughly 62% revenue share in 2025, reflecting moderate concentration. Western leaders are pivoting toward premium biometric and sustainable cards, while Asian manufacturers, such as Watchdata and Eastcompeace, undercut on price. Thales deepened its European eID moat by acquiring Bundesdruckerei’s personalization assets, adding 12 centers that reduce friction related to freight and data sovereignty. IDEMIA shipped 4.2 million biometric payment cards in Nordic pilots and signed a 150 million-card deal for India’s Aadhaar-linked debit program. Infineon and NXP formed a post-quantum cryptography venture, signaling that silicon ownership is the new strategic high ground. Samsung leveraged its foundry scale to achieve a 6.8% chip share in its first full year, offering integrated antenna-in-module designs that reduce assembly costs for card bureaus.[3]Samsung-Electronics, “Secure Element Market Entry 2024,” news.samsung.comGiesecke and Devrient invested EUR 120 million in a polycarbonate plant, betting that material decarbonization will secure pricing power once PVC bans hit full force. Pure-play bureaus, such as CPI Card Group, answer with a capacity for polycarbonate in North America, but their reliance on third-party chips exposes them to a margin squeeze.
Smart Card Industry Leaders
CardLogix Corporation
Watchdata Technologies
Bundesdruckerei GmbH
IntelCav
Secura Key
- *Disclaimer: Major Players sorted in no particular order

Recent Industry Developments
- December 2025: IDEMIA partnered with India’s government to supply 150 million Aadhaar-linked biometric payment cards over two years.
- November 2025: Thales Group acquired Bundesdruckerei’s card personalization arm for EUR 340 million (USD 384 million).
- October 2025: Infineon and NXP created a USD 180 million joint venture to build post-quantum secure elements, targeting Q4 2026 rollout.
- September 2025: Giesecke and Devrient introduced an 85% renewable PLA card substrate, winning 8 million-card orders from Scandinavian banks.


Research Methodology Framework and Report Scope
Market Definitions and Key Coverage
Our study defines the global smart card market as the annual revenues generated from newly issued, factory-programmed contact, contactless, dual-interface, and hybrid cards that embed a secure microcontroller or memory chip and are supplied for payment, identification, access control, telecommunications (SIM/eSIM), transportation ticketing, and healthcare authentication purposes.
Scope Exclusion: Modules sold as NFC tags, magnetic-stripe-only cards, SIM card service revenues, and purely virtual credentials are not included.
Segmentation Overview
- By Interface Type
- Contact
- Contactless
- Dual Interface
- Hybrid
- By Card Chip Type
- Memory
- Microcontroller
- Secure Element/System-on-Card
- By Material
- PVC
- Polycarbonate (PC)
- ABS
- PETG and Bio-based Plastics
- Metal and Composite
- By Function/Application
- Payment and Banking
- Identification and eID
- Access Control and Physical Security
- Telecom and SIM
- Transportation Ticketing
- Healthcare and Insurance
- Retail and Loyalty
- By End-user Industry
- BFSI
- IT and Telecommunications
- Government and Public Sector
- Transportation and Logistics
- Healthcare
- Retail and Hospitality
- Education and Others
- By Geography
- North America
- United States
- Canada
- Mexico
- Europe
- United Kingdom
- Germany
- France
- Italy
- Rest of Europe
- Asia-Pacific
- China
- India
- Japan
- South Korea
- Rest of Asia-Pacific
- South America
- Brazil
- Argentina
- Rest of South America
- Middle East
- GCC
- Turkey
- Rest of Middle East
- Africa
- South Africa
- Nigeria
- Kenya
- Rest of Africa
- North America
Detailed Research Methodology and Data Validation
Primary Research
We next interview smart card silicon designers, personalization bureaus, payment-scheme integrators, and national ID program managers across Asia, Europe, North America, and the Gulf. These discussions validate shipment seasonality, average selling prices, and migration rates toward dual-interface or biometric formats, allowing us to tighten model assumptions flagged during desk work.
Desk Research
Mordor analysts first build a reference library drawing on public trade statistics from bodies such as EMVCo, the Smart Payment Association, and UN Comtrade to gauge annual smart card unit flows. We complement these with policy papers from central banks, EU Digital ID directives, and transport authorities, plus issuer disclosures in 10-Ks and investor decks detailing card replacement cycles. Where macro context is needed, sources such as the World Bank's Findex database and ITU mobile-subscriber series help benchmark addressable user pools. Paid collections like D&B Hoovers for issuer financials and Dow Jones Factiva for deal news let us spot abnormal surges that may skew year baselines. This list is illustrative; many additional publications underpin our desk work.
Market-Sizing & Forecasting
A top-down reconstruction converts reported production and trade data into a 2024 demand pool, which is then stress-tested with selective bottom-up checks, sampled issuer roll-ups and channel ASP x volume, to refine totals. Key variables include: - annual EMV card shipments, - 4G/5G SIM activations, - contactless payment penetration in POS transactions, - government e-ID issuance targets, and - average smart card ASP trends by chip memory density. Multivariate regression links these drivers to historical revenue, while scenario analysis adjusts for regulatory mandates or chipset shortages. Gaps uncovered in bottom-up issuer samples are bridged using normalized ASP bands from verified purchase orders before final triangulation.
Data Validation & Update Cycle
Outputs pass three-layer variance checks, after which senior reviewers benchmark figures against external shipment tallies and macro indicators. Reports refresh annually; any mid-cycle policy shift, for instance, a large national ID tender, triggers rapid re-validation so clients always receive the most current insight.
Why Mordor's Smart Card Baseline Earns Decision-Maker Trust
Published estimates often diverge because firms apply different card definitions, bundle service revenues, or refresh projections on uneven cadences.
Key gap drivers include: some publishers fold in legacy magnetic-stripe cards, others freeze exchange rates, and a few extrapolate units from limited bank surveys without reconciling with global EMV shipment audits. Mordor's disciplined scope, annual refresh, and dual-path validation guard against those pitfalls.
Benchmark comparison
| Market Size | Anonymized source | Primary gap driver |
|---|---|---|
| USD 20.30 B (2025) | Mordor Intelligence | - |
| USD 15.40 B (2024) | Global Consultancy A | Excludes telecom SIM replacements; uses static FX rate |
| USD 10.20 B (2024) | Industry Analyst B | Omits dual-interface ASP premium; limited regional coverage |
| USD 16.70 B (2023) | Sector Insights C | Combines virtual credentials with physical cards |
In sum, by anchoring revenues to verifiable shipment data, validating with practitioners, and applying transparent variable-level modeling, Mordor Intelligence delivers a balanced, reproducible baseline that executives can depend on for strategic planning.


Key Questions Answered in the Report
What is the current size and growth outlook for the smart cards market?
The market stands at USD 21.82 billion in 2026 and is on track to reach USD 30.03 billion by 2031 at a 6.6% CAGR.
Which region contributes the most revenue to smart-card sales?
Asia-Pacific delivers 54.11% of global revenue, driven by government-mandated contactless payment and eID programs.
Why are dual-interface cards gaining popularity?
They allow issuers to support both contact and contactless terminals, minimizing transaction declines during infrastructure transitions.
How are sustainability mandates shaping card materials?
Polycarbonate and bio-based substrates are replacing PVC due to issuer carbon targets and regulatory pressure, boosting card durability and lowering life-cycle cost.
What technology trend will most affect future smart-card security?
Secure elements with post-quantum cryptography and on-card biometric matching are becoming critical to comply with emerging digital-identity and payments standards.
How concentrated is vendor competition?
The top five vendors hold just over 60% of global revenue, signaling moderate concentration yet leaving room for regional specialists to grow.
Page last updated on:


