Market Overview
| Study Period | 2021 - 2031 |
|---|---|
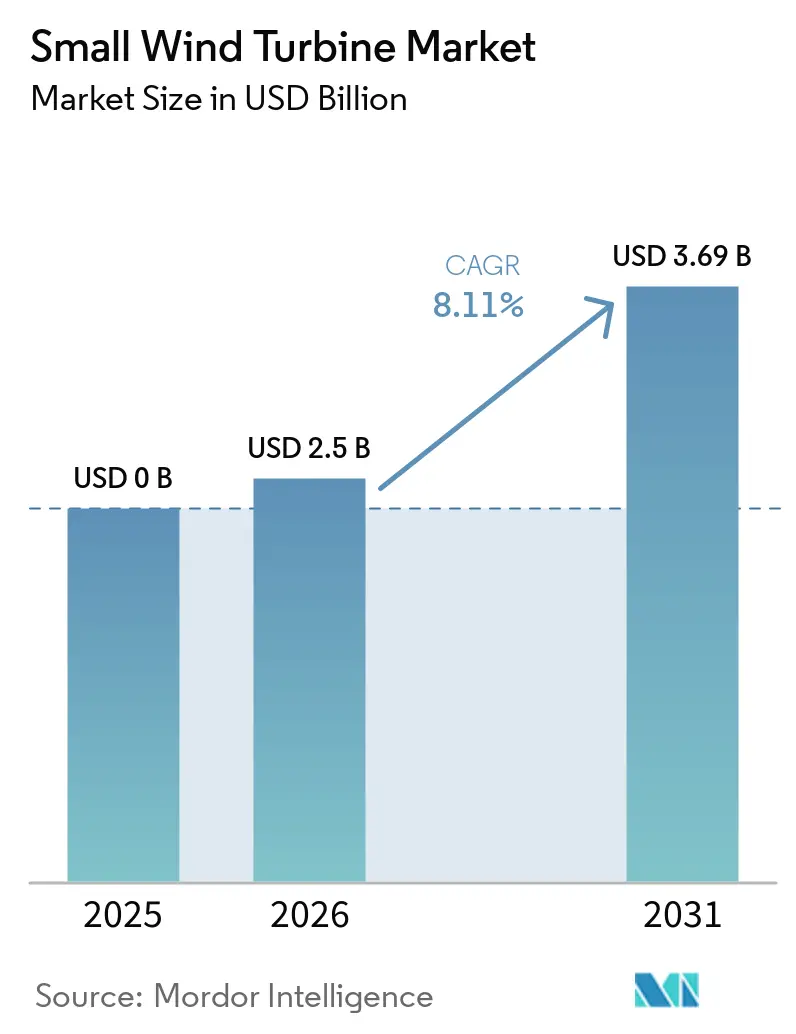
| Market Size (2026) | USD 2.5 Billion |
| Market Size (2031) | USD 3.69 Billion |
| Growth Rate (2026 - 2031) | 8.11% CAGR |
| Fastest Growing Market | Asia Pacific |
| Largest Market | Asia-Pacific |
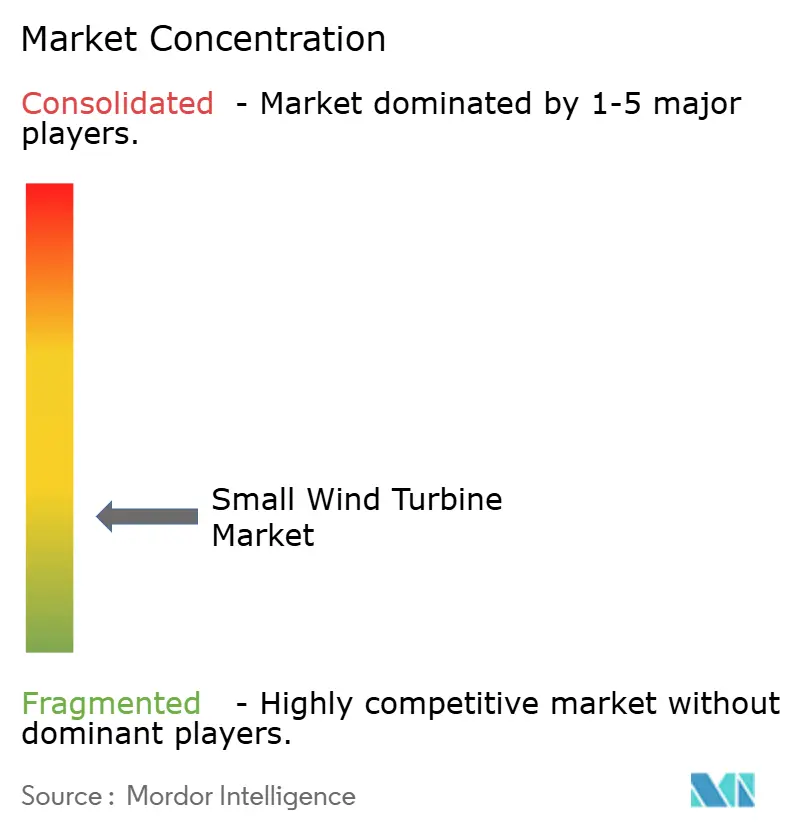
| Market Concentration | Low |
Major Players
*Disclaimer: Major Players sorted in no particular order Image © Mordor Intelligence. Reuse requires attribution under CC BY 4.0. |
|
Small Wind Turbine Market Analysis by Mordor Intelligence
The Small Wind Turbine Market size was valued at USD 2.31 billion in 2025 and estimated to grow from USD 2.5 billion in 2026 to reach USD 3.69 billion by 2031, at a CAGR of 8.11% during the forecast period (2026-2031).
Growth is driven by policy incentives, vertical-axis technology advances, and rising use in telecom, agricultural, and distributed energy systems. Public funding programs in North America, the European Union, and Asia accelerate deployments, while machine-learning-enabled turbine optimization reduces lifetime energy costs and improves reliability. Corporate power purchase agreements expand demand for on-grid projects, and hybrid wind-solar systems extend the addressable market in regions with variable wind resources. Cost rivalry with rooftop solar remains a restraint in the sub-10 kW segment, but efficiency gains and new siting rules narrow the gap.
Key Report Takeaways
- By axis type, horizontal designs led with 67.40% revenue share in 2025; vertical turbines are projected to record a 13.4% CAGR through 2031.
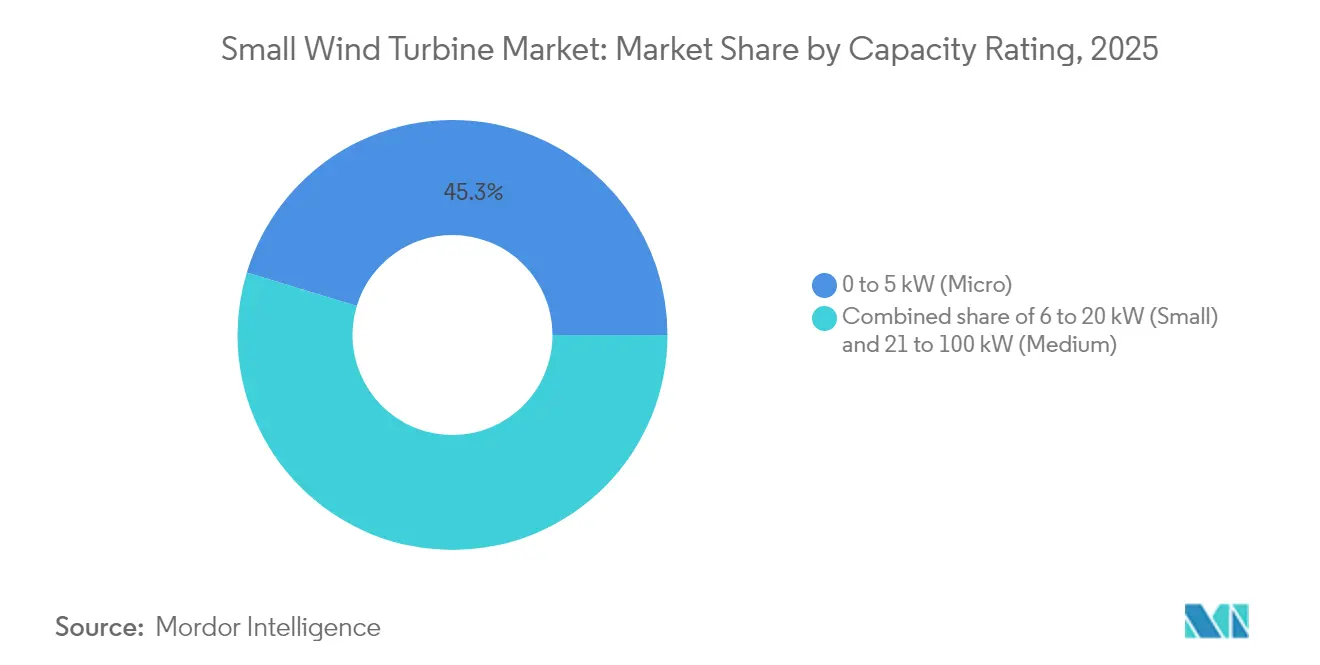
- By capacity rating, the 0 to 5 kW micro class captured 45.30% of the small wind turbine market share in 2025, while the 21 to 100 kW medium class is forecast to expand at 10.83% CAGR to 2031.
- By connectivity, off-grid systems accounted for 55.20% of the small wind turbine market size in 2025; the on-grid segment is set to rise at 11.7% CAGR during the outlook period.
- By installation location, freestanding towers held a 72.60% share of the small wind turbine market size in 2025, whereas rooftop solutions are advancing at 14.4% CAGR.
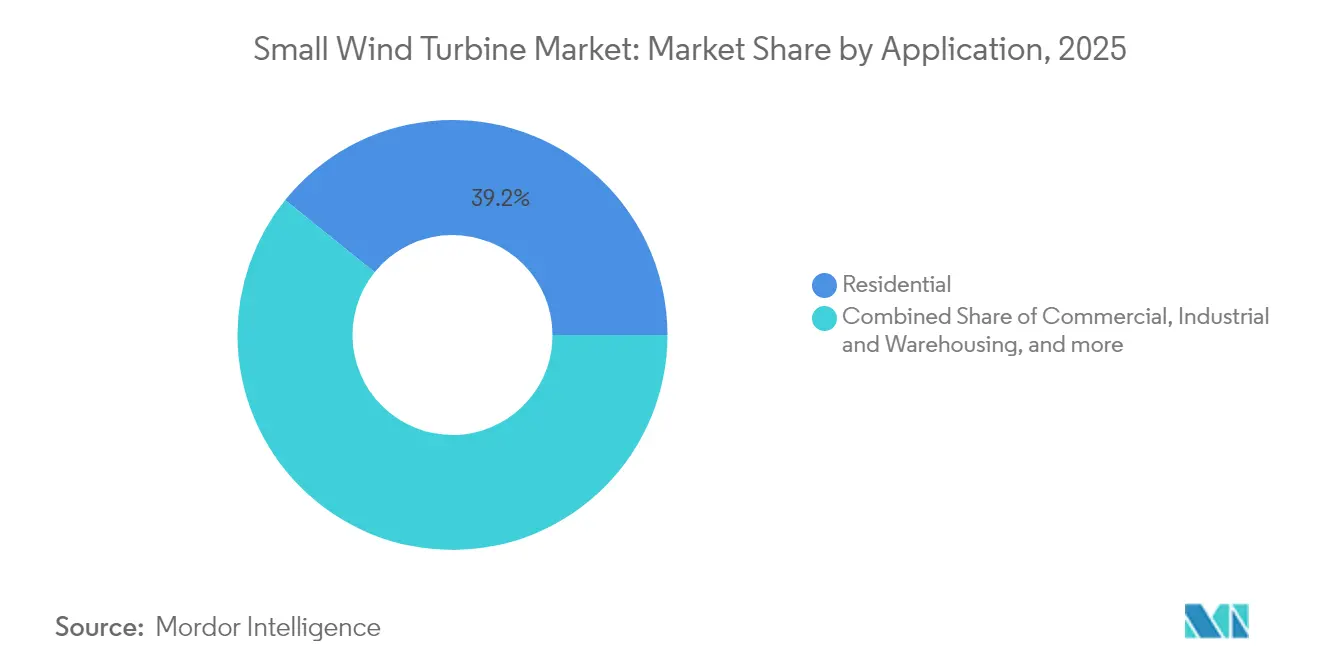
- By end-user, residential use retained a 39.20% share in 2025, and commercial installations are growing at a 9.38% CAGR to 2031.
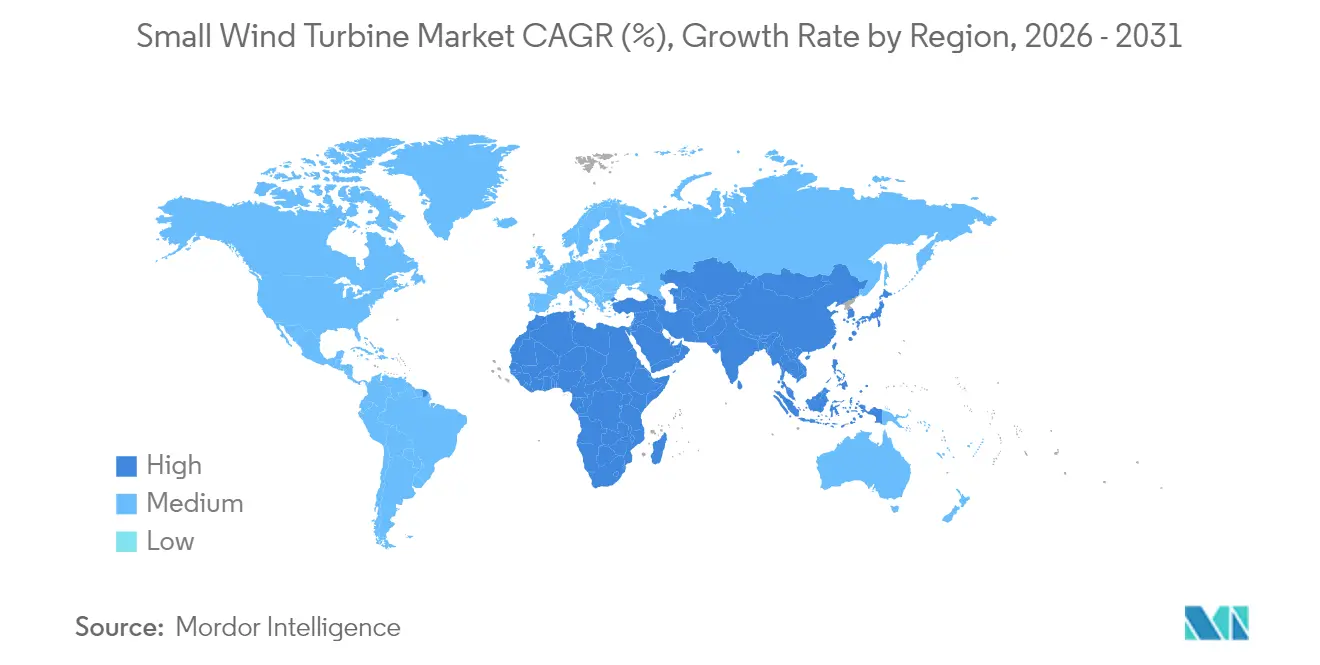
- Asia-Pacific controlled 47.30% of the small wind turbine market in 2025 and is leading regional growth at 9.84% CAGR.
Note: Market size and forecast figures in this report are generated using Mordor Intelligence’s proprietary estimation framework, updated with the latest available data and insights as of 2026.
Global Small Wind Turbine Market Trends and Insights
Drivers Impact Analysis*
| Driver | ( ~ ) % Impact on CAGR Forecast | Geographic Relevance | Impact Timeline |
|---|---|---|---|
| Rapid Electrification of Remote Islands across the Caribbean | +1.2% | Caribbean, Pacific Islands | Medium term (2-4 years) |
| Sub-5 kW Turbine Demand Surge from U.S. USDA "Rural Energy for America" Grants | +1.8% | North America, primarily rural U.S. | Short term (≤ 2 years) |
| China's "Zero-Carbon Industrial Parks" Mandating On-site Renewables | +2.1% | China, expanding to APAC | Long term (≥ 4 years) |
| EU Rooftop-Renewables Directive Boosting Building-Integrated Wind | +1.5% | European Union | Medium term (2-4 years) |
| Telecom Tower Hybridization Agenda in India & ASEAN | +1.4% | India, ASEAN countries | Medium term (2-4 years) |
| Increasing Corporate PPAs for Micro-Wind in Nordics' Data-Center Cluster | +0.8% | Nordic countries, expanding globally | Long term (≥ 4 years) |
| Source: Mordor Intelligence | |||


Rapid Electrification of Remote Islands across the Caribbean
Remote island utilities are replacing diesel systems with hybrid renewable microgrids, including small wind turbines. Governments and multilateral lenders have earmarked concessional finance that reduces upfront project costs and broadens developer participation. Turbine suppliers that offer corrosion-resistant coatings and modular logistics packages gain a competitive advantage in these markets. The average installed capacity per site remains below 50 kW, aligning with 0–20 kW product lines. Steady trade winds support capacity factors above 35%, improving payback periods relative to solar-only designs. Island electrification programs adopt performance-based tariffs that reward high availability, reinforcing the value of digital monitoring platforms integrated into new turbine models.
Sub-5 kW Turbine Demand Surge from USDA Rural Energy Grants
The USD 180 million Rural Energy for America Program allocation in 2025 prioritizes micro wind systems for farms and rural small businesses.[1] United States Department of Agriculture, “Rural Energy for America Program Funding Notice,” usda.gov Grants cover up to 50% of capital costs, enabling paybacks under six years in regions with mean wind speeds above 6 m/s. The National Renewable Energy Laboratory’s Competitiveness Improvement Project funds prototype certification that unlocks third-party financing, addressing historical bankability gaps. More than 400 farms are targeted, driving an incremental 25 MW of cumulative micro-class installations by 2027. Coupling turbines with barn-roof solar arrays allows producers to offset peak daytime loads and evening irrigation demand. Manufacturers that complete UL 6141 certification under the program qualify for preference in federal procurement.
China’s Zero-Carbon Industrial Parks Mandating On-Site Renewables
China requires 40% of industrial output from certified green factories by 2030, spurring demand for on-site renewables inside economic zones.[2]Ministry of Industry and Information Technology, “Green Factory Standards,” miit.gov.cn After integrating small wind turbines with rooftop photovoltaics, Jiangsu’s Changzhou Zhonglou zone cut energy intensity by 26.39% since 2018. Factory clusters favor 20–100 kW turbines that match medium-voltage feeders and supply process loads overnight. Circular economy rules mandate blade recycling, prompting suppliers to adopt thermoplastic resin and recyclable carbon fiber. Provincial subsidies in Guangdong and Shandong reimburse up to CNY 300 per kW for distributed wind, further improving project economics. Long-term industrial power contracts now include variable renewable clauses prioritizing on-site wind output.
EU Rooftop-Renewables Directive Boosting Building-Integrated Wind
The EU Renewables Directive revision streamlines permitting for rooftop renewables and sets a 42.5% renewable share target by 2030. Member states must enact one-stop digital portals, reducing average approval times for small wind projects to three months. North Rhine-Westphalia exempts turbines below 10 m height from planning procedures, expanding viable urban sites. The Accele-RES program assigns at least 5% of new installations to innovative solutions, positioning vertical-axis units with omnidirectional blades for incentives. Building developers integrate turbines into energy-positive designs to meet the 2028 near-zero-energy requirement for new public buildings. Financial institutions bundle rooftop wind and solar under green mortgage products, lowering interest costs for property owners.
Restraints Impact Analysis*
| Restraint | ( ~ ) % Impact on CAGR Forecast | Geographic Relevance | Impact Timeline |
|---|---|---|---|
| Height-Based Zoning Restrictions in Urban Europe | -1.1% | European urban areas | Long term (≥ 4 years) |
| Acoustic-Emission Standards Tightening in Japan | -0.8% | Japan, expanding to Asia-Pacific | Medium term (2-4 years) |
| High LCOE versus Rooftop PV in North America <10 kW segment | -1.5% | North America, particularly residential | Short term (≤ 2 years) |
| Bankability Gaps due to Absence of Long-Term O&M Ecosystem in Africa | -0.9% | Sub-Saharan Africa | Long term (≥ 4 years) |
| Source: Mordor Intelligence | |||
Height-Based Zoning Restrictions in Urban Europe
Municipal height limits constrain turbine hub height to 10 m or less in many historic districts, curbing energy yield. Variance requests often require shadow-flicker and visual assessments that lengthen project timelines. Noise measurement rules rely on modeled rather than empirical data, adding engineering costs. Fragmented jurisdiction means identical projects face divergent rules between adjacent municipalities, discouraging developers from citywide rollouts. EU Wind Power Package guidance seeks harmonization, but local cultural heritage bodies retain veto power. Suppliers respond with stub-mast vertical-axis designs that fit below parapets, though lower swept area reduces annual output.
High Levelized Cost of Energy versus Rooftop Solar in Sub-10 kW Segment
Lazard’s 2024 analysis shows the average residential, small wind LCOE at USD 0.146 per kWh versus USD 0.076 per kWh for rooftop solar in the United States. Balance-of-system costs are higher because cranes, guyed towers, and dynamic load studies add complexity. Net-metering policies originally designed for solar often exclude wind, limiting export revenue. Urban turbulence lowers the capacity factor, further widening the cost gap. Manufacturers invest in machine-learning pitch algorithms that increase low-wind efficiency by 200% and cut vibration by 77%, but component costs rise. Falling battery prices help micro-hybrid systems compete on resilience rather than pure kWh cost, yet the price premium continues to deter many homeowners.
*Our forecasts treat driver/restraint impacts as directional, not additive. The impact forecasts reflect baseline growth, mix effects, and variable interactions.
Segment Analysis
By Axis Type: Vertical Designs Gain Momentum
Horizontal configurations retained 67.40% of 2025 revenue on proven aerodynamics and supply chain maturity. The segment dominated large-farm repowering and rural household replacements. Manufacturers standardize 2–20 kW models to meet USDA and Indian telecom bid specifications, leveraging volume economies. The small wind turbine market size for vertical axis units grew quickly from a lower base and is forecast to post 13.4% CAGR, outpacing horizontal units. Vertical turbines thrive in disrupted wind flows near rooftops and street-level poles, where omnidirectional blades capture multidirectional gusts. Genetic learning algorithms that modulate pitch through each rotation improve power coefficients by up to 0.45, close to Betz-limit benchmarks. Reduced moving parts allow ground-level gearboxes, cutting maintenance truck rolls by 30% and encouraging commercial fleet adopters.
Vertical axis suppliers partner with façade engineers to embed turbines into curtain walls, meeting EU innovative-technology quotas. Savonius and Darrieus hybrids with contra-rotating rotors minimize torque ripple, lowering the acoustic signature to within 35 dB at a 5 m distance. University of Tokyo field tests verify 15-year bearing life even under typhoon gusts, addressing durability perceptions. Developers structure leasing deals that bundle services and recycle obligations, satisfying circular economy rules in China and the EU. The narrative positions vertical turbines as complementary rather than disruptive, allowing mixed arrays that smooth site energy output.
By Capacity Rating: Medium Turbines Capture Commercial Loads
Micro class 0–5 kW systems delivered 45.30% of the small wind turbine market share in 2025, supported by grant-funded installations on farms, cabins, and roadside sensors. Average selling price fell 6% year-on-year as electronics commoditized, yet post-installation service revenues rose. Medium 21–100 kW units expand at 10.83% CAGR through 2031, serving telecom towers, industrial parks, and data-center campuses. Developers favor IEC 61400-2-certified models that integrate fault ride-through and reactive power support, enabling grid connection without separate converters. At 60 kW size, unit cost per kW drops below USD 2,300, closing the gap to rooftop solar plus storage stacks.
The small wind turbine market size for 6–20 kW equipment grows steadily in peri-urban business estates where grid tariffs include demand charges. Farmers with high refrigeration loads choose 15 kW turbines to offset evening peaks. Historical adoption benefits from accumulated installer skillsets that shorten project lead times. Medium-class suppliers bundle extended warranties that guarantee 97% technical availability, unlocking low-cost debt from green banks. Interoperable SCADA links wind output to onsite battery dispatch, optimizing self-consumption and avoiding interconnection curtailments.


By Connectivity: Grid-Tied Systems Accelerate
Off-grid arrays held a 55.20% share in 2025, powering telecommunications, island resorts, and ranch houses beyond utility reach. Diesel displacement savings average USD 0.37 per liter in the Caribbean, reinforcing payback cases. The on-grid category grows at 11.7% CAGR, lifting the small wind turbine market size for interconnected projects. Smart inverter advances synchronize micro-turbines with low-voltage feeders, enabling net metering and ancillary services. In Denmark, 5 kW units participate in local flexibility markets that compensate for voltage support, adding USD 0.012 per kWh revenue. Caribbean hybrid sites that blend 50 kW of wind with 100 kWh lithium storage achieve levelized costs of USD 0.036 per kWh. Utility programs in Minnesota and Ontario offer fixed feed-in adders for wind-solar hybrids, stimulating suburban adoption.
Hybrid architectures bundle rooftop PV with parking-lot wind masts, sharing a common bidirectional inverter that lowers total equipment cost by 18%. Remote monitoring through LTE networks reduces unplanned downtime, which is vital for telecom tower reliability. Grid codes in Australia, Spain, and South Africa now include micro-wind reference profiles, easing permitting. Corporate energy buyers favor hybrid microgrids that de-risk intermittency and meet Science-Based Target commitments, fueling demand for grid-tied small wind capacity.
By Installation Location: Rooftop Integration Scales Quickly
Freestanding towers represented 72.60% of 2025 installs due to superior wind resources at 15 m hub heights. Agricultural lands provide ample space and minimal turbulence, maintaining capacity above 28%. The rooftop niche grows at 14.4% CAGR, elevating its small wind turbine market slice. EU building directives and North American net-metering reforms accelerate site approvals, while modular anchors allow installation without roof penetrations. Compared with fixed-pitch reference units, the Re-COGNITION passive-geometry rotor achieves 12% higher energy capture in chaotic urban flows. Hawaii’s VCCT turbine trial confirms survivability in salt-laden environments and records peak acoustic levels of 38 dB, below residential nighttime limits.
Developers retrofit existing warehouses using self-erecting cranes that minimize road closures. Insurance underwriters publish guidelines that treat rooftop wind like HVAC units, reducing premium surcharges. Building-integrated solutions employ colored composites to blend with façades and mitigate visual objections. Architects integrate turbines into passive ventilation stacks, extracting performance gains from pressure differentials. Rooftop arrays pair with energy-management systems that curtail output during low demand, meeting grid export caps and avoiding clipping losses.
By End-user: Commercial Users Drive Next-Wave Growth
Residential customers retained the largest volume with 39.20% of 2025 units, leveraging rebates and self-installation kits. Yet commercial premises such as retail parks, hotels, and office campuses post 9.38% CAGR, lifting their contribution to the small wind turbine industry revenue mix. Corporate sustainability targets require Scope 2 emission cuts that on-site wind directly delivers. Medium-class turbines supply base-load lighting and HVAC, while solar covers daytime peaks, balancing facility demand. India wind energy sector is accelerating with the telecom subsector planning 50,000 micro-wind retrofits, positioning the country as a critical growth driver for distributed renewable energy infrastructure.
Data-center clusters in Sweden and Finland sign 10–15-year power purchase agreements for campus microgrids, including 30–60 kW wind arrays, supporting critical load resilience. Industrial warehousing adopts 20 kW turbines to shave peak-demand charges that can top 30% of electricity bills. Coastal aquaculture niches deploy floating platforms that pair wind with wave-powered desalination, reducing reliance on diesel generators. Municipal authorities integrate small wind into public lighting networks, using excess generation for EV charging at bus depots. Diversification across end uses stabilizes order books and cushions suppliers against cyclical downturns in any single sector.
Geography Analysis
Asia-Pacific dominated the small wind turbine market with a 47.30% share in 2025 and is growing at a 9.84% CAGR on the back of Chinese industrial decarbonization and Indian telecom electrification. China’s mandate for 40% certified green factory output by 2030 compels economic zones to install rooftop and courtyard turbines, while Jiangsu’s recycling standards promote circular supply chains. India’s tower operators commit to renewable energy for backup power, and hybrid tenders specify 5 kW microturbines alongside PV and lithium packs. Japan maintains stringent acoustic rules yet supports vertical-axis demonstrations near rail corridors. ASEAN island states deploy community microgrids, and Vietnamese manufacturers export 10 kW turbines to regional fishing fleets.
Europe remains a mature base where regulatory clarity supports incremental growth. The Renewables Directive revision cuts permitting delays for projects below 50 kW, boosting urban adoption. Germany exempts sub-10 m turbines from planning approval in selected Länder, cutting soft costs by 25%. Nordic data-center PPAs underpin a robust on-grid pipeline; Norsk Hydro’s 29-year 235 MW wind PPA exemplifies confidence in long-dated offtake. Denmark’s stringent 39 dB noise cap influences product acoustics exported worldwide. The United Kingdom supports island onshore wind expansions, including micro-turbines for community benefit shares.
North America’s policy landscape rejuvenates demand. The USDA’s USD 180 million grant pool accelerates farm deployments, and NREL’s USD 3.2 million competitiveness fund advances certification pathways. Canada’s 247 MW order boom for Nordex utility-scale turbines raises component localization that benefits small wind suppliers through shared transport links. However, residential adoption lags due to rooftop solar price advantage. States such as New York pilot feed-in tariffs specific to small wind, while California trials microgrid tariffs that reward multi-technology systems. Mexico’s rural electrification agency reopens tenders for a hybrid kit, including 1.5 kW wind units for off-grid clinics.

Competitive Landscape
The market displays fragmentation. The top five manufacturers account for nearly 30% of global shipments, leaving room for regional specialists. Firms differentiate through axis designs, integration software, and service packages. Vertical-axis innovators license EPFL’s genetic learning patents to boost power coefficients, offering performance guarantees that lower financing spreads. Established horizontal-axis vendors extend portfolios into medium classes to retain customers migrating toward higher loads. Hitachi’s 2025 acquisition of Joliet Electric Motors broadens aftermarket coverage for generators up to 500 kW, underscoring the strategic value of service revenue.[5]Hitachi Ltd., “Acquisition of Joliet Electric Motors,” hitachi.com
Strategic partnerships focus on hybrid microgrids. Vantage Towers collaborates with turbine OEMs to embed micro wind at base stations, reducing diesel logistics costs and signaling environmental leadership. Chinese suppliers sign joint ventures with provincial investment funds to build domestic recycling facilities, ensuring compliance with blade disposal mandates. European start-ups co-develop building-integrated turbines with façade contractors, tapping EU innovation grants. Financing models evolve toward energy-as-a-service, where developers retain asset ownership and sell power at fixed tariffs indexed to inflation.
Technology roadmaps emphasize digitalization. Cloud SCADA platforms aggregate fleet data, enabling predictive maintenance that raises availability above 98%. Machine-learning algorithms detect yaw misalignment in tower-mounted vertical units and adjust pitch proactively. Manufacturers embed edge computing that controls hybrid inverter operations, synchronizing wind and solar output while prioritizing battery charge schedules. The competitive scene reflects the convergence between small wind and distributed solar ecosystems, with players vying to provide a single integrated energy-management stack.
Small Wind Turbine Industry Leaders
-
Bergey Windpower Co.
-
Shanghai Ghrepower Green Energy Co. Ltd
-
Ryse Energy
-
Kingspan Group Plc (Wind)
-
Eocycle Technologies Inc.
- *Disclaimer: Major Players sorted in no particular order

Recent Industry Developments
- January 2025: USDA announced USD 180 million Rural Energy for America grants covering wind projects for 42 states. This funding, part of President Biden's Inflation Reduction Act, will support 586 projects aimed at expanding biofuels and clean energy systems.
- September 2024: In a significant leap for clean energy technology, VAWT-X Energy, in collaboration with Flinders University, successfully assembled a pioneering 6kW vertical axis wind turbine prototype, marking the first of its kind to be entirely manufactured in South Australia.
- July 2024: NREL awarded USD 3.2 million to 12 small wind R&D projects under the Competitiveness Improvement Project. Targeting rural agriculture markets, the 2024 CIP selections support the U.S. Department of Agriculture (USDA) and DOE’s new Rural and Agricultural Income & Savings from Renewable Energy (RAISE) initiative.
- July 2024: Hawaii Development Authority partnered with Kanoa Winds to test VCCT rooftop turbines in Honolulu. The partnership will study the feasibility of using compact vertical wind turbines, known as VCCTs, in the islands.


Global Small Wind Turbine Market Report Scope
Small wind turbines are low-cost, low-maintenance, and dependable alternative energy generators that can be installed in a short time and require less space. The market size under the report considers the annual sales of wind turbines below 100 kW (in nominal, or nameplate, capacity) globally.
The small wind turbine market is segmented by axis type, application, and geography. By axis type, the market is segmented into horizontal-axis wind turbines and vertical-axis wind turbines. By application, the market is segmented into on-grid and off-grid. The report also covers the market size and forecasts for the small wind turbine market across major regions such as North America, Europe, Asia-Pacific, South America, and Middle East & Africa. For each segment, the market sizing and forecasts were made based on revenue (USD).
By Axis Type
| Horizontal Axis Wind Turbines (HAWT) (Upwind, and Downwind) |
| Vertical Axis Wind Turbines (VAWT) (Savonius, Darrieus and Giromill) |
By Capacity Rating (kW)
| 0 to 5 kW (Micro) |
| 6 to 20 kW (Small) |
| 21 to 100 kW (Medium) |
By Connectivity
| Off-Grid |
| On-Grid |
| Hybrid (Wind + Battery/PV) |
By Installation Location
| Rooftop/Building-Integrated |
| Freestanding Tower (Ground-Mounted) |
By Application
| Residential |
| Commercial (Retail, Offices, Hotels) |
| Industrial and Warehousing |
| Agricultural and Aquaculture |
| Telecom Towers and Remote Monitoring Sites |
By Geography
| North America | United States |
| Canada | |
| Mexico | |
| Europe | United Kingdom |
| Germany | |
| France | |
| Spain | |
| Nordic Countries | |
| Russia | |
| Rest of Europe | |
| Asia-Pacific | China |
| India | |
| Japan | |
| South Korea | |
| ASEAN Countries | |
| Australia | |
| Rest of Asia-Pacific | |
| South America | Brazil |
| Argentina | |
| Colombia | |
| Rest of South America | |
| Middle East and Africa | United Arab Emirates |
| Saudi Arabia | |
| South Africa | |
| Egypt | |
| Rest of Middle East and Africa |
| By Axis Type | Horizontal Axis Wind Turbines (HAWT) (Upwind, and Downwind) | |
| Vertical Axis Wind Turbines (VAWT) (Savonius, Darrieus and Giromill) | ||
| By Capacity Rating (kW) | 0 to 5 kW (Micro) | |
| 6 to 20 kW (Small) | ||
| 21 to 100 kW (Medium) | ||
| By Connectivity | Off-Grid | |
| On-Grid | ||
| Hybrid (Wind + Battery/PV) | ||
| By Installation Location | Rooftop/Building-Integrated | |
| Freestanding Tower (Ground-Mounted) | ||
| By Application | Residential | |
| Commercial (Retail, Offices, Hotels) | ||
| Industrial and Warehousing | ||
| Agricultural and Aquaculture | ||
| Telecom Towers and Remote Monitoring Sites | ||
| By Geography | North America | United States |
| Canada | ||
| Mexico | ||
| Europe | United Kingdom | |
| Germany | ||
| France | ||
| Spain | ||
| Nordic Countries | ||
| Russia | ||
| Rest of Europe | ||
| Asia-Pacific | China | |
| India | ||
| Japan | ||
| South Korea | ||
| ASEAN Countries | ||
| Australia | ||
| Rest of Asia-Pacific | ||
| South America | Brazil | |
| Argentina | ||
| Colombia | ||
| Rest of South America | ||
| Middle East and Africa | United Arab Emirates | |
| Saudi Arabia | ||
| South Africa | ||
| Egypt | ||
| Rest of Middle East and Africa | ||


Key Questions Answered in the Report
What is the current value of the small wind turbine market?
The market will generate USD 2.5 billion in 2026 and is projected to reach USD 3.69 billion by 2031.
Which region leads small wind turbine deployments?
Asia-Pacific holds 47.30% of global installations, driven by Chinese industrial policies and Indian telecom projects.
How fast are vertical-axis turbines growing versus horizontal designs?
Vertical configurations are expected to expand at 13.4% CAGR from 2026 to 2031, outpacing horizontal units that dominate today.
Why are medium-capacity (21–100 kW) turbines gaining traction?
Commercial and industrial users need higher output and grid services, so this class is forecast to grow at 10.83% CAGR.
What policy incentives support small wind adoption in the United States?
The USDA Rural Energy for America Program offers grants covering up to 50% of project cost for farm and rural business installations.
How does small wind compete with rooftop solar on cost?
Residential wind LCOE still trails solar, but efficiency gains, hybrid designs, and specific grant programs narrow the cost gap in wind-rich sites.
Page last updated on:


