Single-Cell Multiomics Market Size and Share
Market Overview
| Study Period | 2020 - 2031 |
|---|---|
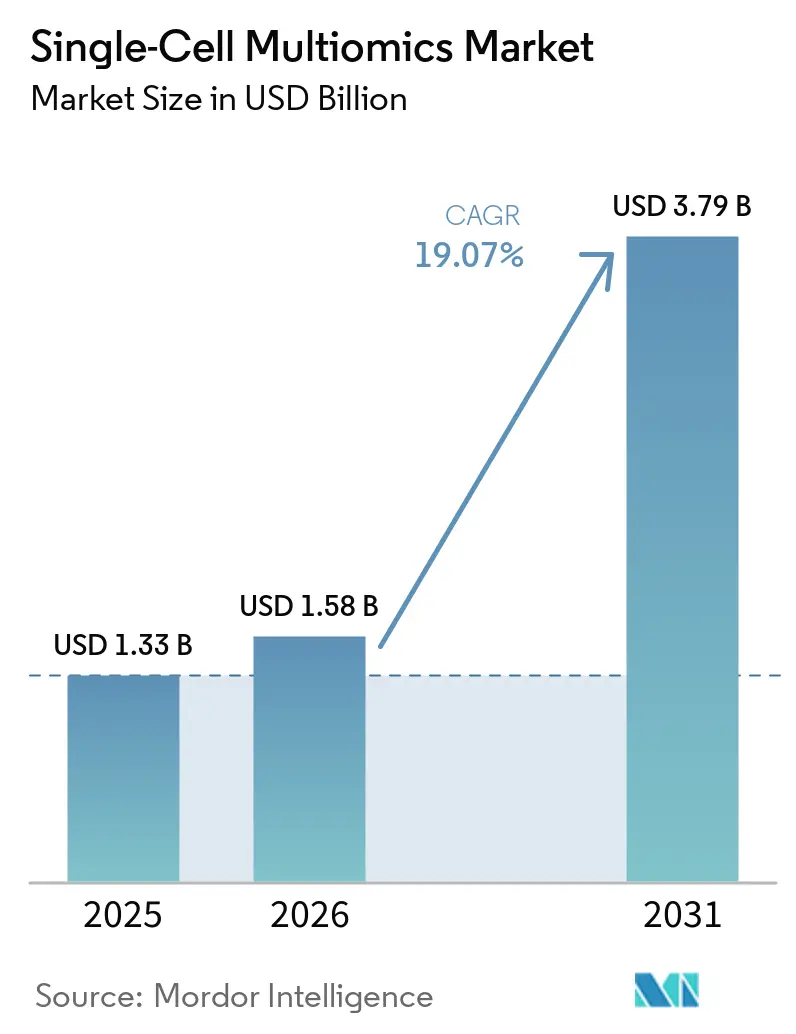
| Market Size (2026) | USD 1.58 Billion |
| Market Size (2031) | USD 3.79 Billion |
| Growth Rate (2026 - 2031) | 19.07% CAGR |
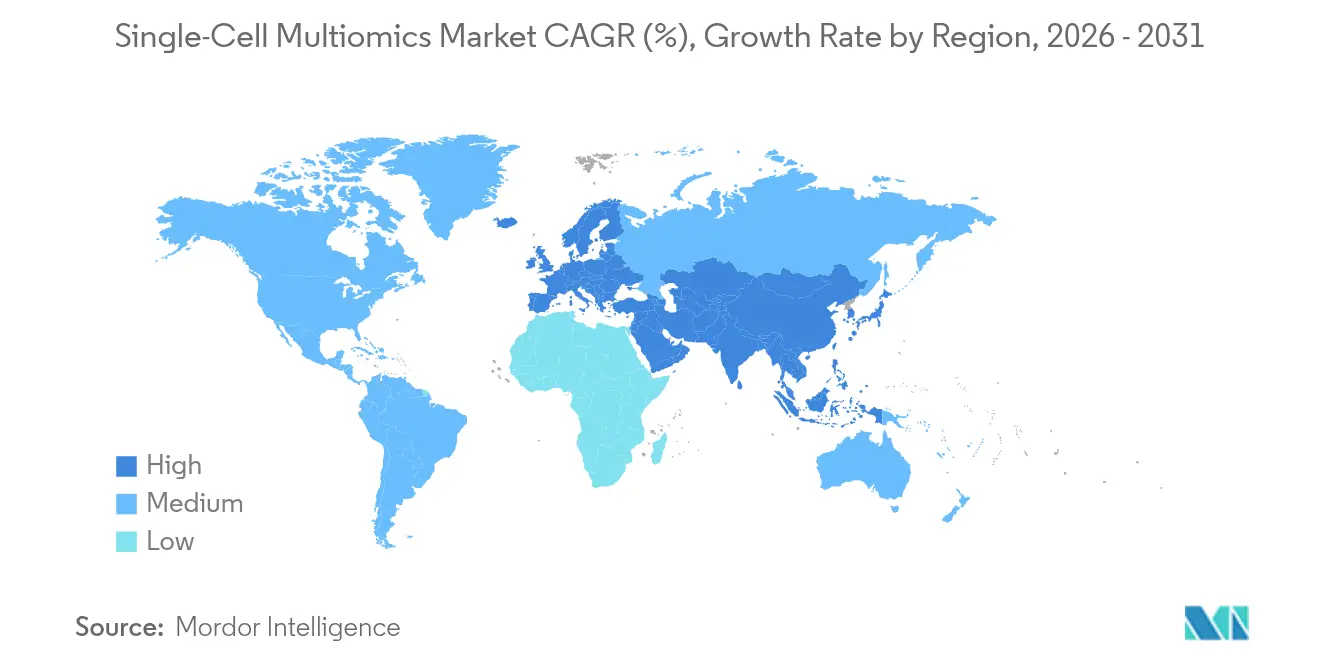
| Fastest Growing Market | Asia-Pacific |
| Largest Market | North America |
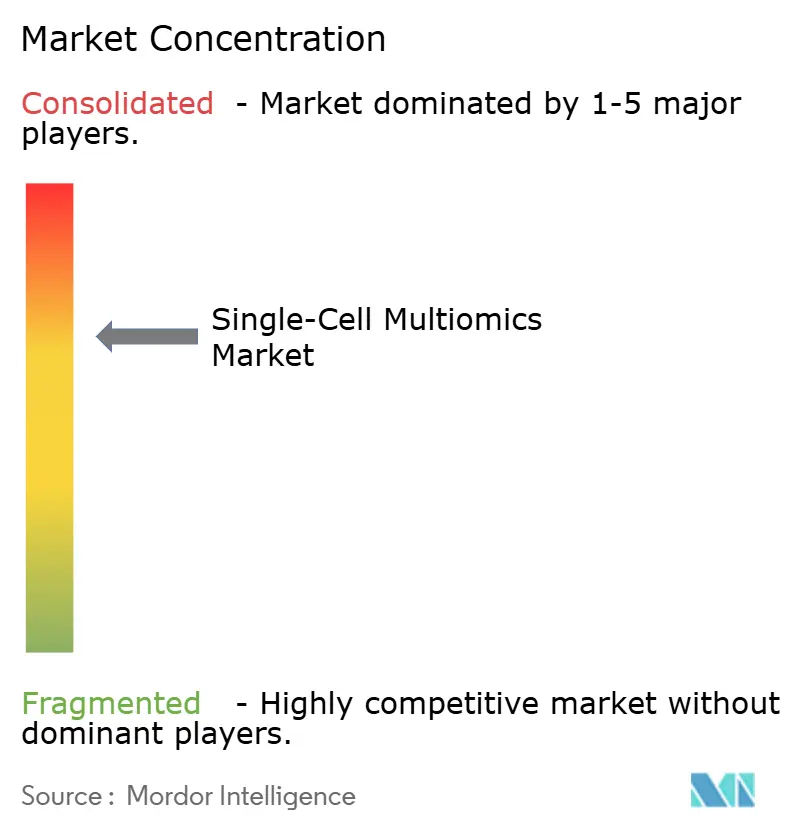
| Market Concentration | Medium |
Major Players *Disclaimer: Major Players sorted in no particular order Image © Mordor Intelligence. Reuse requires attribution under CC BY 4.0. | |
Single-Cell Multiomics Market Analysis by Mordor Intelligence
The single-cell multiomics market size in 2026 is estimated at USD 1.58 billion, growing from 2025 value of USD 1.33 billion with 2031 projections showing USD 3.79 billion, growing at 19.07% CAGR over 2026-2031. Adoption accelerates as spatial biology platforms deliver sub-cellular resolution, long-read sequencers push accuracy thresholds, and AI-enhanced analytics streamline data interpretation. Sustained declines in sequencing costs, coupled with cloud-based bioinformatics, lower the entry barriers for laboratories. Vendors now bundle hardware, reagents, and software into integrated ecosystems, creating switching costs that deepen customer lock-in. Oncology programs dominated early uptake, yet brain-mapping consortia, autoimmune research, and population-scale immunity projects now diversify demand. Regulatory conversations around genomic-data privacy add caution but also encourage investment in secure data-handling frameworks that can unlock cross-border collaborations.
Key Report Takeaways
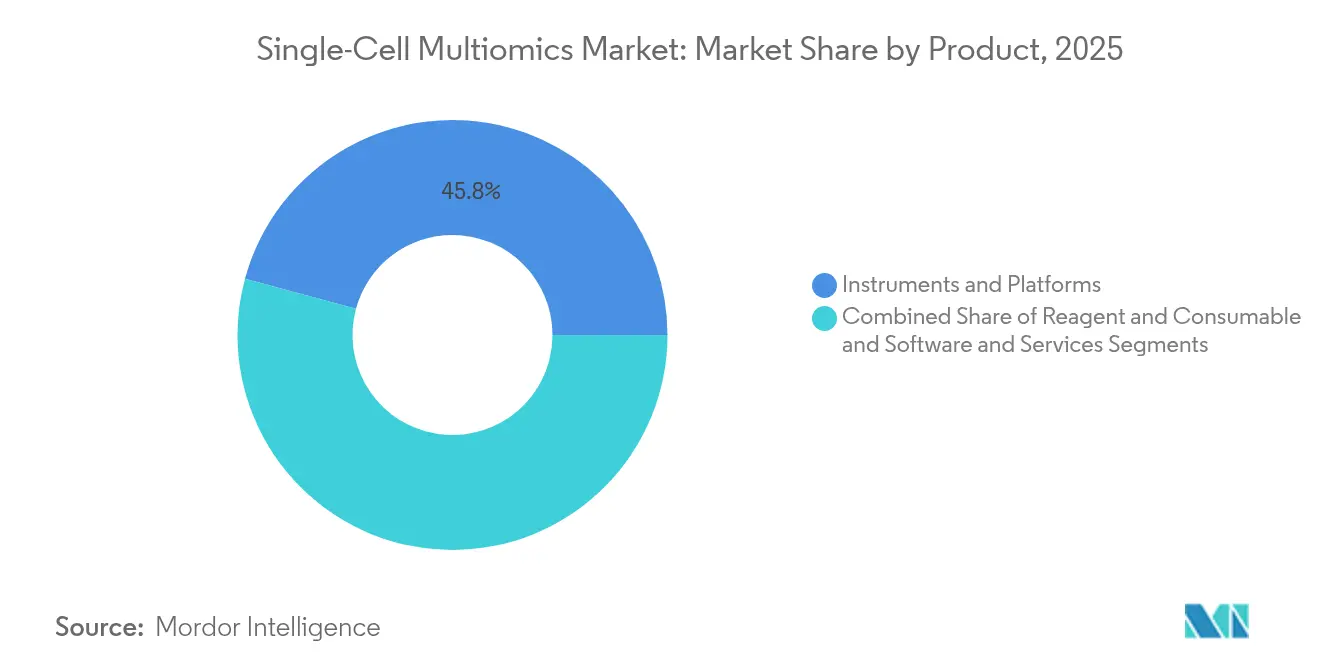
- By product, instruments and platforms commanded 45.78% of the single-cell multiomics market share in 2025, while software and services are projected to grow at a 22.86% CAGR through 2031.
- By technology platform, droplet-based microfluidics held 57.84% of the single-cell multiomics market share in 2025; spatial-omics platforms are forecast to expand at a 23.9% CAGR to 2031.
- By omics modality, single-cell genomics led with 44.11% of the single-cell multiomics market share in 2025, whereas proteomics is advancing at a 23.55% CAGR through 2031.
- By application, oncology accounted for 36.02% of the single-cell multiomics market size in 2025, and neurology is projected to grow at a 21.74% CAGR between 2026-2031.
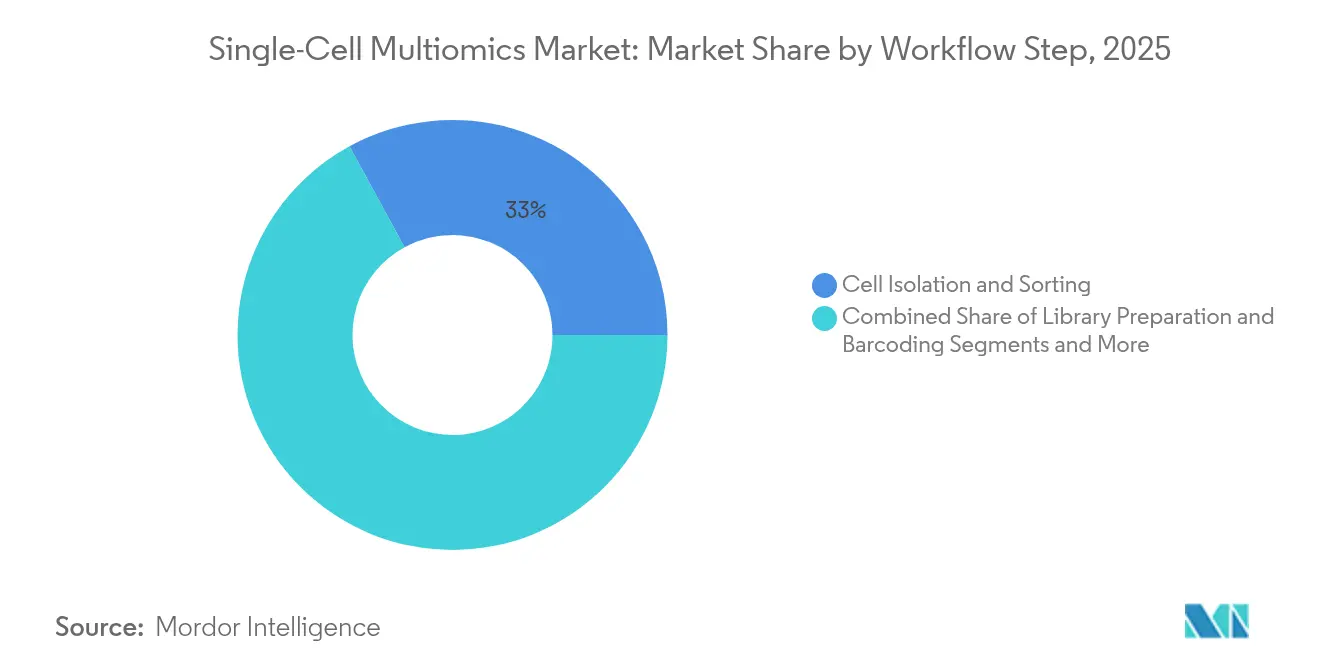
- By workflow step, cell isolation and sorting captured 32.95% of the single-cell multiomics market share in 2025, while data analysis and visualization record the highest projected CAGR at 22.48% to 2031.
- By end user, academic and research institutes held 50.71% of the single-cell multiomics market share in 2025, whereas biotechnology and pharmaceutical companies are expanding fastest at a 21.1% CAGR through 2031.
- By geography, North America led with 40.78% of the single-cell multiomics market share in 2025, while Asia Pacific is forecast to post the quickest growth at a 20.98% CAGR to 2031.
Note: Market size and forecast figures in this report are generated using Mordor Intelligence’s proprietary estimation framework, updated with the latest available data and insights as of 2026.
Market Trends and Insights
Drivers Impact Analysis of Single-Cell Multiomics Market*
| Driver | (~) % Impact on CAGR Forecast | Geographic Relevance | Impact Timeline |
|---|---|---|---|
| Technological advances in single-cell analysis | +4.2% | North America & EU core, global reach | Medium term (2-4 years) |
| Rising burden of chronic and infectious diseases | +3.8% | Global, higher in aging economies | Long term (≥4 years) |
| Precision-oncology & immunology adoption | +3.5% | North America & EU, expanding APAC | Medium term (2-4 years) |
| Sequencing-cost reductions & ultra-high-throughput platforms | +2.9% | Global, fastest in cost-sensitive APAC | Short term (≤2 years) |
| AI-enabled analytics pipelines | +2.7% | North America & EU, emerging China | Medium term (2-4 years) |
| Commercialization of spatial multiomics | +2.4% | North America & EU, selective APAC hubs | Medium term (2-4 years) |
| Source: Mordor Intelligence | |||
Technological Advances in Single-Cell Analysis
New chemistries double detected-gene counts while cutting per-cell costs by half, as illustrated by GEM-X upgrades that also capture fragile neutrophils more efficiently. Spatial workflows now fuse DNA, RNA, protein, and morphology in under 24 hours through AVITI24 systems, closing the gap between histology and molecular profiling elementbiosciences.com. Intelligent microfluidics, enhanced by object-detection algorithms, achieve 98% cell-identification precision and elevate throughput.[1]Zhiqiang Jia, “Intelligent Single-Cell Manipulation: LLMs- and Object Detection-Enhanced Active-Matrix Digital Microfluidics,” Nature Microsystems & Nanoengineering, nature.comThese cumulative gains shorten project timelines, broaden assay menus, and push the single-cell multiomics market deeper into translational research.
Rising Burden of Chronic and Infectious Diseases
Single-cell interrogation uncovers how individual tumor clones or immune subsets drive divergent therapy responses, informing treatment algorithms that improve survival odds.[2]Eytan Ruppin, “PERCEPTION Predicts Patient Response and Resistance to Treatment Using Single-Cell Transcriptomics,” Nature, nature.com During COVID-19, rapid immune-cell profiling demonstrated the technology’s ability to map real-time responses, accelerating vaccine research cycles. Aging populations propel neurology programs that deploy spatial maps to pinpoint Alzheimer’s-linked cell states. Tumor-microenvironment atlases now predict immunotherapy outcomes in hepatocellular carcinoma studies showcased at AACR 2024. The need for granular insight into disease heterogeneity sustains multi-year funding streams that expand the single-cell multiomics market footprint.
Precision-Oncology & Immunology Adoption
Single-cell readouts guide CAR-T design, with ssCART-19 candidates posting 87.5% overall response rates in recent hematology trials.[3]He Huang, “Advances in CAR-T Cell Therapy for Hematologic and Solid Malignancies: Latest Updates From 2024 ESMO Congress,” Journal of Hematology & Oncology, jhoonline.biomedcentral.comMachine-learning models trained on multi-omic markers stratify patients for checkpoint inhibitors, lowering trial attrition. Autoimmune research leverages similar workflows to identify pathogenic T-cell clones, opening new drug-target spaces. Regulatory agencies increasingly accept multi-omic biomarkers for label expansions, prompting pharmaceutical budgets to shift toward in-house single-cell platforms. These trends funnel fresh capital into the single-cell multiomics market and fast-track its clinical integration.
Sequencing-Cost Reductions & Ultra-High-Throughput Platforms
HiFi chemistry kits now process 96 samples in parallel, cutting per-genome expenses while preserving accuracy. Population-scale initiatives such as the Billion Cells Project plan to profile a billion cells and archive reference atlases that will underpin drug discovery. Automated library-prep systems deliver sequencing-ready material in under 10 hours, shrinking labor overheads. Falling costs position the single-cell multiomics market for mainstream diagnostic use in price-sensitive regions.
Restraints Impact Analysis of Single-Cell Multiomics Market*
| Restraint | (~) % Impact on CAGR Forecast | Geographic Relevance | Impact Timeline |
|---|---|---|---|
| High capital and reagent costs | -2.8% | Global, acute in emerging markets | Short term (≤2 years) |
| Bioinformatics-talent shortage | -2.3% | Global, strongest in APAC | Medium term (2-4 years) |
| Sample-prep biases affecting fragile cells | -1.9% | Global, all applications | Medium term (2-4 years) |
| Heightened genomic-data privacy regulations | -1.6% | EU core, spreading worldwide | Long term (≥4 years) |
| Source: Mordor Intelligence | |||
High Capital and Reagent Costs
Turn-key spatial platforms can list above USD 500,000, and full-stack multiomics reagents still range from USD 50-200 per cell, restricting routine implementation. Academic cores adopt shared-instrument models that lengthen queue times. Contract research organizations offset capital burdens but add scheduling delays, prompting labs to prioritize grant-backed projects. Vendors respond by consolidating assays into single instruments to widen amortization bases. Until unit-economics improve, budget constraints temper the near-term expansion speed of the single-cell multiomics market.
Bioinformatics-Talent Shortage
Nearly 2,000 single-cell studies published since 2024 generate complex datasets that overwhelm generic pipelines. Universities struggle to match private-sector salaries, leading to analyst vacancies that slow project completion. Cloud portals like ScRNAbox provide HPC access, yet steep learning curves persist. Automated annotation tools ease bottlenecks but still require expert oversight for regulatory submissions. Talent scarcity therefore moderates adoption curves in the single-cell multiomics market, especially within resource-limited regions.
*Our forecasts treat driver/restraint impacts as directional, not additive. The impact forecasts reflect baseline growth, mix effects, and variable interactions.
Single-Cell Multiomics Market Segment Analysis
By Product:
Platforms Anchor Hardware DominanceInstruments and platforms accounted for 45.78% of the single-cell multiomics market share in 2025, reflecting the indispensable role of precision hardware in assay quality. Broadening assay menus and integration of sequencing and imaging into unified chassis further cement their position. Software and services, though smaller, are growing fastest at 22.86% CAGR as cloud pipelines and AI dashboards become routine. The single-cell multiomics market size for software and services is projected to add USD 0.66 billion between 2026-2031, mirroring lab demand for turnkey analytics. Recurring reagent revenue underpins vendor profitability, funding next-gen platform R&D that widens performance gaps against earlier models.
Continuous hardware innovation—illustrated by platforms that process 20,000 cells per run while capturing transcriptome and protein data—keeps capital budgets directed toward upgrades. On the services front, contract analytics groups scale by offering pay-per-dataset models, allowing small biotech teams to tap advanced pipelines without infrastructure. Synergy between hardware and cloud software fosters ecosystem lock-in, reinforcing the expansion trajectory of the single-cell multiomics market.


By Technology Platform:
Droplets Maintain the StandardDroplet-based workflows captured 57.84% revenue in 2025, benefiting from mature chemistries, abundant reagent kits, and proven scalability. High-throughput labs favor droplet systems for population-scale atlases that demand millions of barcoded cells. Spatial-omics, while newer, is rising at 23.9% CAGR as tumor-microenvironment mapping moves toward the clinic. The single-cell multiomics market size for spatial-omics is expected to triple by 2031, supported by tissue-context biomarkers in oncology.
Hybrid strategies now emerge: instruments inject droplet-partitioned cells onto slides for secondary spatial staining, combining throughput with context. Nanowell and combinatorial indexing platforms remain options where cost or sample type mandates alternative formats. Yet droplet incumbents invest heavily in R&D, extending chemistry lifecycles and defending their hold on the single-cell multiomics market.
By Omics Modality:
Genomics Leads, Proteomics SurgesGenomics retained 44.11% revenue in 2025, a reflection of entrenched sequencing infrastructure and widely accepted variant-calling pipelines. Proteomics, however, posts the fastest 23.55% CAGR as sensitivity breakthroughs bring single-cell protein coverage beyond 2,000 proteins per cell. Transcriptomics sits between the two, offering functional snapshots that complement DNA variation data, while metabolomics lags because of detection-limit challenges.
Proteomics momentum owes to antibody-oligo conjugate panels that plug into existing sequencers, minimizing new-instrument spend. Genomics revenue growth spatial genomics and transcriptomics now leans on long-read detection of structural variants, adding layers of insight to cancer genome studies. As assay multiplexing becomes routine, multi-modal kits push average selling prices upward, elevating the overall single-cell multiomics market.
By Application:
Oncology Holds Ground, Neurology AcceleratesOncology delivered 36.02% of 2025 revenue, buoyed by biomarker-driven immunotherapy trials that require cell-level resolution. Spatial gene-expression maps now inform biopsy grading protocols, embedding single-cell assays in diagnostic algorithms. Neurology’s 21.74% CAGR reflects global brain-mapping initiatives that catalog neuronal subtypes and synaptic circuits. The single-cell multiomics market size for neurology applications could surpass USD 0.76 billion by 2031 if current funding trajectories persist.
Non-oncology immunology has also grown as autoimmune and infectious-disease projects leverage single-cell atlases to deconvolute complex immune landscapes. Developmental-biology studies round out demand, providing insights into congenital disorders and regenerative pathways. Diversification across therapeutic areas reduces revenue concentration risk and broadens the single-cell multiomics market customer base.
By Workflow Step:
Isolation Dominates, Analytics Gains SpeedCell isolation and sorting contributed 32.95% revenue in 2025, underscoring the foundational need for viable single-cell suspensions. Novel acoustic and optical methods now sort 100,000 cells per minute, lowering sample-prep time. Data analysis and visualization, while smaller, expand at 22.48% CAGR as AI pipelines commoditize interpretation tasks. Instruments that automate library prep, sequencing, and primary analytics in a closed loop are redefining standard operating procedures across the single-cell multiomics market.
Integrated workflows decrease error rates tied to manual handling, while cloud dashboards democratize access to high-performance compute clusters. The result is a leveling of analytical capacity between resource-rich academic centers and smaller regional hospitals, fueling downstream adoption and revenue growth.
By End User:
Academia Commands, Pharma Scales UpAcademic and research centers represented 50.71% of 2025 spending, anchored by federal grants and philanthropic initiatives. Core facilities often act as regional hubs, servicing multiple institutes and sharing capital costs. Pharmaceutical and biotech firms, however, post a 21.1% CAGR as translational endpoints validate commercial ROI. The single-cell multiomics industry leverages these corporate budgets to underwrite late-stage validation studies crucial for regulatory acceptance.
Contract research organizations bridge capacity gaps, offering flexible access to platforms and specialized expertise. Their rise accelerates project throughput but exerts pricing pressure on service contracts, prompting differentiation through proprietary analysis pipelines. The shifting user mix keeps the single-cell multiomics market dynamic and expands total addressable demand.
Geography Analysis
North America Single-Cell Multiomics Market
North America accounted for 40.78% revenue in 2025, underpinned by NIH-funded precision-medicine programs, deep venture capital pools, and early technology adoption. Collaborations between sequencer manufacturers and cloud-compute vendors normalize AI-enabled genomics dashboards, positioning the region at the forefront of integrative workflows. Academic–industry consortia translate bench discoveries into clinical assays at a pace unmatched elsewhere, sustaining premium pricing within the single-cell multiomics market.
APAC Single-Cell Multiomics Market
Asia Pacific, projected to grow at 20.98% CAGR, benefits from government-backed cell-atlas projects and domestic instrument manufacturing. China’s multi-billion-cell initiatives harness large-scale sequencing to chart tissue diversity, while Japanese centers target age-related neurological disorders with single-cell resolution. Price-sensitive sub-markets spur demand for cost-optimized kits, prompting global vendors to localize production. These dynamics expand the regional single-cell multiomics market despite infrastructure disparities across countries.
Europe Single-Cell Multiomics Market
Europe occupies a technologically sophisticated but regulation-intensive landscape. Horizon grants sustain academic demand, and pharma clusters in Germany and the United Kingdom integrate single-cell assays into drug-discovery pipelines. Yet GDPR compliance hurdles complicate cross-border data exchanges, slowing multi-site oncology studies and nudging enterprises toward privacy-enhancing computation stacks. Despite these frictions, high-value proteomics acquisitions signal investor confidence, anchoring Europe as a stable, if slower-growing, node in the global single-cell multiomics market.

Competitive Landscape
The market remains moderately concentrated: the top five providers control roughly 45% of global revenue, yielding substantial yet contestable sway. Leaders such as 10x Genomics extend chemistry roadmaps and integrate automation partners, deepening their installed-base moat. Illumina couples new spatial platforms with GPU-accelerated analysis suites, signaling ambitions beyond sequencing. Spatial specialists Vizgen and Ultivue merged to consolidate imaging probes and software stacks, intensifying competition in tissue-context assays.
Start-ups focus on white-space modalities: Deepcell’s AI-based morphology sorting augments label-free workflows, while Scale Biosciences expands high-parameter proteomics kits. Partnerships are a favored route—e.g., BioSkryb with Tecan—to weave complementary competencies and accelerate commercialization. Data-privacy regulation spurs differentiation; providers offering compliant, sovereign-cloud platforms gain footholds in Europe. Collectively, these maneuvers raise the innovation bar and shape the trajectory of the single-cell multiomics market.
Single-Cell Multiomics Industry Leaders
Bio-Rad Laboratories, Inc.
Illumina Inc
BD
Qaigen N.V.
10x Genomics
- *Disclaimer: Major Players sorted in no particular order
Single-Cell Multiomics Market Companies Covered in this Report
- 10x Genomics Inc.
- Illumina
- Beckton Dickinson
- NanoString Technologies Inc.
- Standard BioTools Inc.
- Mission Bio Inc.
- Vizgen Inc.
- QIAGEN
- Takara Bio
- Bio-Rad Laboratories
- BGI Genomics Co. Ltd.
- Parse Biosciences Inc.
- Singular Genomics Systems Inc.
- Pacific Biosciences (PacBio)
- Roche
- Cellenion SAS
- Olink Proteomics AB
- Dolomite Bio
- Fluent BioSciences
- STRATEC SE

Recent Industry Developments in Single-Cell Multiomics Market
- April 2025: Arc Institute partnered with 10x Genomics and Ultima Genomics to evolve the Virtual Cell Atlas for multi-omics data integration.
- April 2025: BioSkryb Genomics and Tecan launched a high-throughput single-cell workflow delivering sequencing-ready libraries in under 10 hours.
- February 2025: Illumina unveiled a spatial transcriptomics platform slated for 2026 release and began collaborating with Broad Institute for large-scale datasets.
- February 2025: Chan Zuckerberg Initiative, 10x Genomics, and Ultima Genomics announced the Billion Cells Project to profile cellular diversity at unprecedented scale.


Global Single-Cell Multiomics Market Report Scope
Single-cell multiomics technologies measure various molecules from the same individual cell, providing deeper biological insights than analyzing separate molecular layers from different cells. Additionally, these technologies uncover cellular heterogeneity across multiple molecular layers within a cell population, highlighting how variations are interconnected or distinct between the captured omic layers.
The single-cell multiomics market is segmented by type, application, end user, and geography. The type segment is further segmented into single-cell genomics, single-cell proteomics, single-cell transcriptomics, and single-cell metabolomics. By application, the market is segmented into cell biology, neurology, oncology, and other applications. The end-user segment is divided into academic & research institutes, biotechnology & pharmaceutical companies, and other end users. The geography segment is further divided into North America, Europe, Asia-Pacific, Middle East and Africa, and South America. The report offers the value (USD) for all the above segments.
Segmentation Overview
| Instruments & Platforms |
| Reagents & Consumables |
| Software & Services |
| Droplet-based Microfluidics |
| Nanowell / Combinatorial Indexing |
| Spatial-omics Platforms |
| Genomics |
| Transcriptomics |
| Proteomics |
| Metabolomics |
| Oncology |
| Neurology |
| Cell Biology & Developmental Biology |
| Immunology & Infectious Disease |
| Cell Isolation & Sorting |
| Library Preparation & Barcoding |
| Sequencing & Imaging Platforms |
| Data Analysis & Visualisation |
| Academic & Research Institutes |
| Biotechnology & Pharmaceutical Companies |
| Contract Research Organisations |
| North America | United States |
| Canada | |
| Mexico | |
| Europe | Germany |
| United Kingdom | |
| France | |
| Italy | |
| Spain | |
| Rest of Europe | |
| Asia-Pacific | China |
| Japan | |
| India | |
| Australia | |
| South Korea | |
| Rest of Asia-Pacific | |
| Middle East and Africa | GCC |
| South Africa | |
| Rest of Middle East and Africa | |
| South America | Brazil |
| Argentina | |
| Rest of South America |
| By Product | Instruments & Platforms | |
| Reagents & Consumables | ||
| Software & Services | ||
| By Technology Platform | Droplet-based Microfluidics | |
| Nanowell / Combinatorial Indexing | ||
| Spatial-omics Platforms | ||
| By Omics Modality | Genomics | |
| Transcriptomics | ||
| Proteomics | ||
| Metabolomics | ||
| By Application | Oncology | |
| Neurology | ||
| Cell Biology & Developmental Biology | ||
| Immunology & Infectious Disease | ||
| By Workflow Step | Cell Isolation & Sorting | |
| Library Preparation & Barcoding | ||
| Sequencing & Imaging Platforms | ||
| Data Analysis & Visualisation | ||
| By End User | Academic & Research Institutes | |
| Biotechnology & Pharmaceutical Companies | ||
| Contract Research Organisations | ||
| By Geography | North America | United States |
| Canada | ||
| Mexico | ||
| Europe | Germany | |
| United Kingdom | ||
| France | ||
| Italy | ||
| Spain | ||
| Rest of Europe | ||
| Asia-Pacific | China | |
| Japan | ||
| India | ||
| Australia | ||
| South Korea | ||
| Rest of Asia-Pacific | ||
| Middle East and Africa | GCC | |
| South Africa | ||
| Rest of Middle East and Africa | ||
| South America | Brazil | |
| Argentina | ||
| Rest of South America | ||


Key Questions Answered in the Report
What is the projected size of the single-cell multiomics market by 2031?
The market is forecast to reach USD 3.79 billion by 2031, expanding at a 19.07% CAGR.
Which product category currently generates the most revenue?
Instruments and platforms lead, holding 45.78% of the single-cell multiomics market share in 2025.
Why are spatial-omics platforms growing so quickly?
Spatial-omics links molecular profiles with tissue context, improving biomarker discovery and thereby driving a 23.9% CAGR for these platforms.
Which region is expected to grow fastest through 2031?
Asia Pacific is projected to advance at 20.98% CAGR, propelled by large-scale cell-atlas projects and expanding research infrastructure.
What is the main barrier to wider adoption of single-cell multiomics in emerging markets?
High capital and reagent costs remain the chief obstacles, subtracting an estimated 2.8% from the global CAGR forecast.
Page last updated on:


