
Refurbished and Reconditioned IT Hardware Market Size and Share
Market Overview
| Study Period | 2020 - 2031 |
|---|---|
| Market Size (2026) | USD 20.86 Billion |
| Market Size (2031) | USD 31.29 Billion |
| Growth Rate (2026 - 2031) | 8.44 % |
| Fastest Growing Market | Asia Pacific |
| Largest Market | North America |
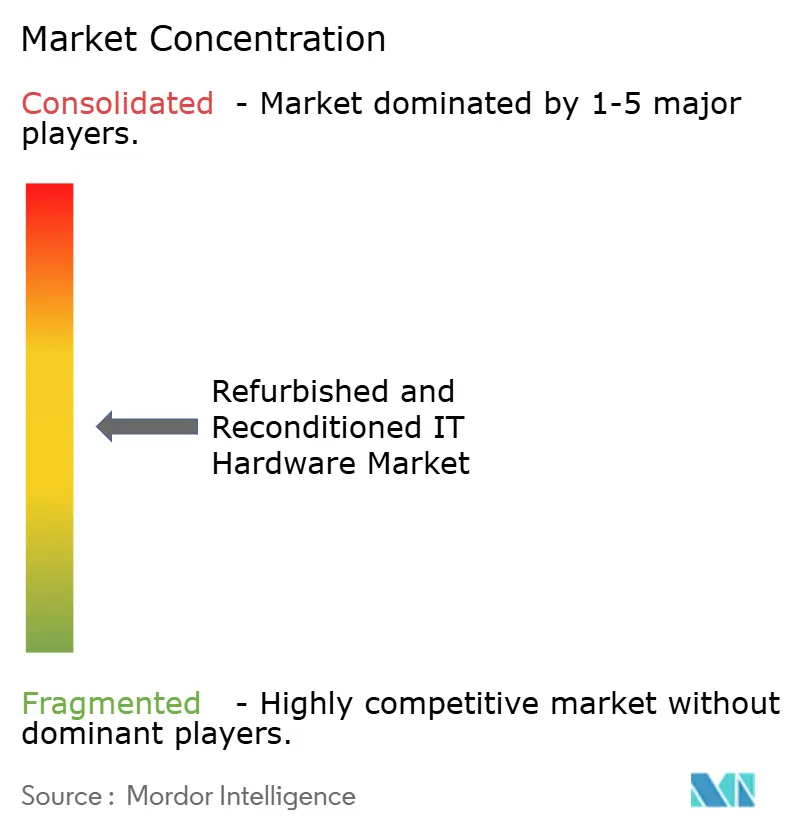
| Market Concentration | Medium |
Major Players *Disclaimer: Major Players sorted in no particular order Image © Mordor Intelligence. Reuse requires attribution under CC BY 4.0. | |
Refurbished and Reconditioned IT Hardware Market Analysis by Mordor Intelligence
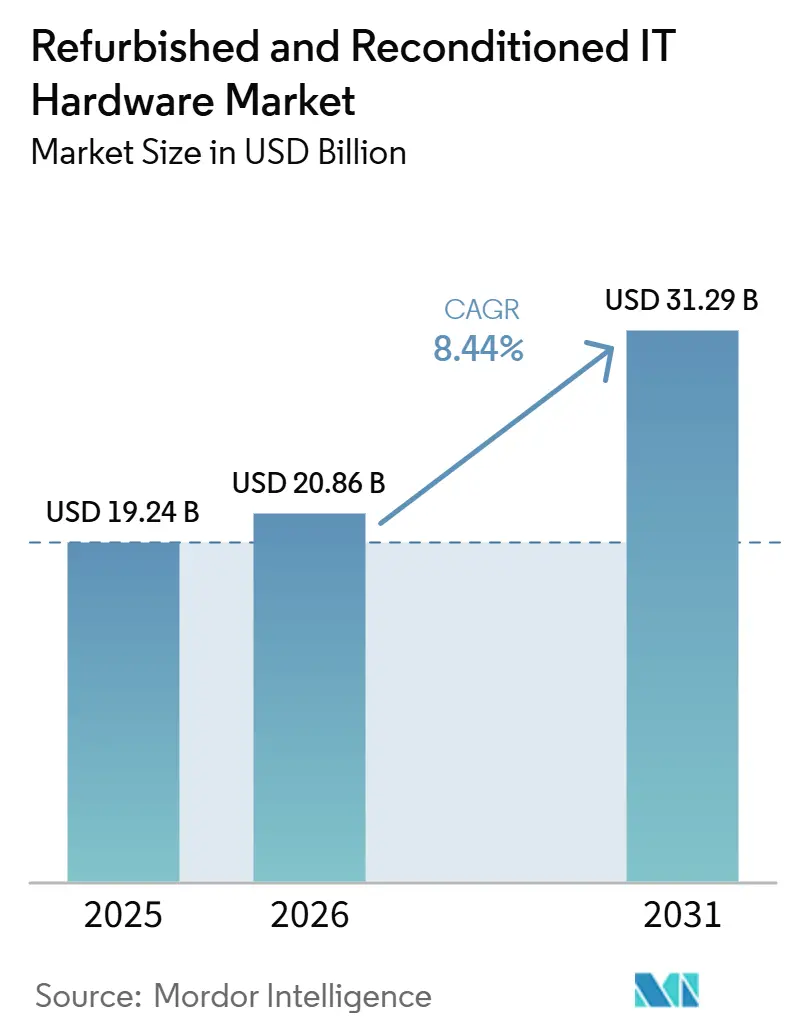
The refurbished and reconditioned IT hardware market size is projected to expand from USD 19.24 billion in 2025 and USD 20.86 billion in 2026 to USD 31.29 billion by 2031, registering a CAGR of 8.44% between 2026 and 2031. Mandatory corporate sustainability metrics, hyperscale decommissioning cycles, and expanding right-to-repair laws are rewriting enterprise procurement playbooks. Europe’s Digital Product Passports and 10-year spare-parts obligations make secondary-market hardware more transparent, while North American data-sanitization standards spur certified processors to invest in advanced erasure technologies. Asia-Pacific demand rises as formal e-waste enforcement pushes used devices out of informal dumps and into licensed refurbishers. OEM-backed programs now guarantee factory-level warranties on remanufactured servers, matching new-equipment service levels and shrinking perceived risk for IT directors. At the same time, AI-driven grading and pricing tools compress inspection cycles and unlock margin headroom previously lost to manual quality checks.
Key Report Takeaways
- By hardware type, computer hardware led with 34.56% revenue share in 2025, while servers are advancing at a 9.46% CAGR to 2031.
- By end-user industry, IT and telecommunications accounted for 32.40% of the refurbished and reconditioned IT hardware market share in 2025, whereas education is forecast to grow at a 10.26% CAGR through 2031.
- By distribution channel, third-party resellers captured 51.24% of 2025 revenue, yet online marketplaces are on track for an 11.28% CAGR to 2031.
- By refurbishment grade, Grade B units accounted for 47.40% of 2025 revenue, while Grade A inventory is rising at a 9.87% CAGR through 2031.
- North America accounted for 38.42% of 2025 sales; Asia-Pacific is projected to be the fastest-growing region, with a 10.76% CAGR to 2031.
Note: Market size and forecast figures in this report are generated using Mordor Intelligence’s proprietary estimation framework, updated with the latest available data and insights as of January 2026.
Global Refurbished and Reconditioned IT Hardware Market Trends and Insights
Drivers Impact Analysis*
| Driver | (~) % Impact on CAGR Forecast | Geographic Relevance | Impact Timeline |
|---|---|---|---|
| Widening Corporate ITAD Mandates | +2.1% | Global, strongest in North America and Europe | Medium term (2-4 years) |
| Regulatory Push Toward Circular Electronics Economy | +1.8% | Europe core, spillover to Asia-Pacific and North America | Long term (≥4 years) |
| Growing Cost-Savings Imperative in SMBs | +1.5% | Global, concentrated in South America, Africa, and South Asia | Short term (≤2 years) |
| Secondary-Market Acceptance in Emerging Asia | +1.3% | Asia-Pacific core, spillover to Middle East and Africa | Medium term (2-4 years) |
| AI-Driven Asset Grading and Pricing Tools | +0.9% | North America and Europe early adopters | Short term (≤2 years) |
| OEM-Backed Certified Refurbish Programs | +0.8% | North America and Europe, moving into Asia-Pacific | Medium term (2-4 years) |
| Source: Mordor Intelligence | |||
Widening Corporate ITAD Mandates
United Kingdom signatories to the 2026 IT Reuse Charter pledge to divert 75% of decommissioned hardware toward refurbishment by 2028, guaranteeing predictable feedstock for certified processors. United States issuers must disclose Scope 3 emissions, so enterprises are now extending device life cycles and centralizing ITAD partnerships, as evidenced by Iron Mountain’s 56% organic ALM growth in 2025.[1]Iron Mountain, “Q4 2025 Earnings Release,” ironmountain.com Lower acquisition costs for refurbishers shorten payback periods on test infrastructure, yet high-performance servers remain scarce because enterprises repurpose them internally, deepening the supply gap at the top end.
Regulatory Push Toward Circular Electronics Economy
The European Union’s 2024 Ecodesign regulation embeds QR codes in product passports that detail repairability scores and material composition. From 2026, the Right to Repair Directive obliges 10-year parts availability, expanding third-party refurbishment capacity. Battery Regulation 2023/1542 adds recycled-content quotas by 2027, steering buyers toward second-life laptops that avoid virgin materials. Enforcement ripples outward; Thailand seized 132 metric tons of undeclared e-waste in March 2026, redirecting flows to licensed refurbishers. Scale processors with ISO 14001 and R2v3 hold an advantage as compliance burdens rise.
OEM-Backed Certified Refurbish Programs
Dell processed 12.3 million kg of returns through Apex in fiscal 2025, reselling remanufactured devices under identical SLAs to new equipment. HPE’s GreenLake now bundles refurbished servers into its flex-capacity model. Cisco Refresh offers discounts up to 90% while maintaining factory warranties. These programs capture the margins once enjoyed by independent resellers and raise buyer expectations for diagnostics. The premium enterprise niche is coalescing around OEM channels, forcing independent refurbishers to pivot toward consumer and SMB accounts.
AI-Driven Asset Grading and Pricing Tools
Convolutional neural network vision systems identify cosmetic defects with 98% accuracy, reducing grader subjectivity. Back Market's marketplace algorithms adjust prices hourly based on sell-through velocity, clearing inventory in days rather than weeks. NLP models trained on service logs estimate remaining component life, enabling price tiers based on predicted failure curves. Automation spreads fastest where labor costs are high, but cloud-delivered grading suites are lowering entry barriers in India and Southeast Asia. Manual-only operators risk margin erosion as AI-enabled competitors raise throughput by 20-30%.
Restraints Impact Analysis*
| Restraint | (~) % Impact on CAGR Forecast | Geographic Relevance | Impact Timeline |
|---|---|---|---|
| Data-Security Breach Concerns | -1.2% | Global, most acute in healthcare and BFSI | Short term (≤2 years) |
| Fragmented Global Warranty Standards | -0.8% | Asia-Pacific focus, affects multinational rollouts | Medium term (2-4 years) |
| Limited Supply of Enterprise-Grade Servers | -0.6% | North America and Europe, extending to Asia-Pacific | Medium term (2-4 years) |
| Price Volatility of Component Harvesting | -0.4% | Global, hits part-reclamation refurbishers | Short term (≤2 years) |
| Source: Mordor Intelligence | |||
Data-Security Breach Concerns
IBM pegged the average global incident cost at USD 4.88 million in 2024, rising to USD 10.93 million for healthcare breaches.[2]IBM Security, “Cost of a Data Breach 2024,” ibm.com NIST Special Publication 800-88 Rev 2 mandates cryptographic erasure or physical destruction for classified media. Despite processors adopting NAID AAA protocols, many enterprises still demand blockchain-verified custody trails before approving refurbished gear, especially in finance and health, where a single breach triggers multi-year regulatory exposure.
Fragmented Global Warranty Standards
Multinationals incur 10-15% additional operating expenses when navigating R2v3, e-Stewards, and ISO 27001 during deployments across regions.[3]Sustainable Electronics Recycling International, “R2v3 Standard,” sustainableelectronics.org Warranty lengths vary widely, from 30 days on Grade C cosmetic-wear units to 3 years on OEM-certified Grade A, complicating cost-of-ownership modeling. Compliance costs in Asia-Pacific can be 8-12% of unit value, deterring smaller refurbishers and skewing supply toward large processors with multi-jurisdiction credentials.
*Our forecasts treat driver/restraint impacts as directional, not additive. The impact forecasts reflect baseline growth, mix effects, and variable interactions.
Segment Analysis
By Hardware Type: Servers Outpace Desktop Staples
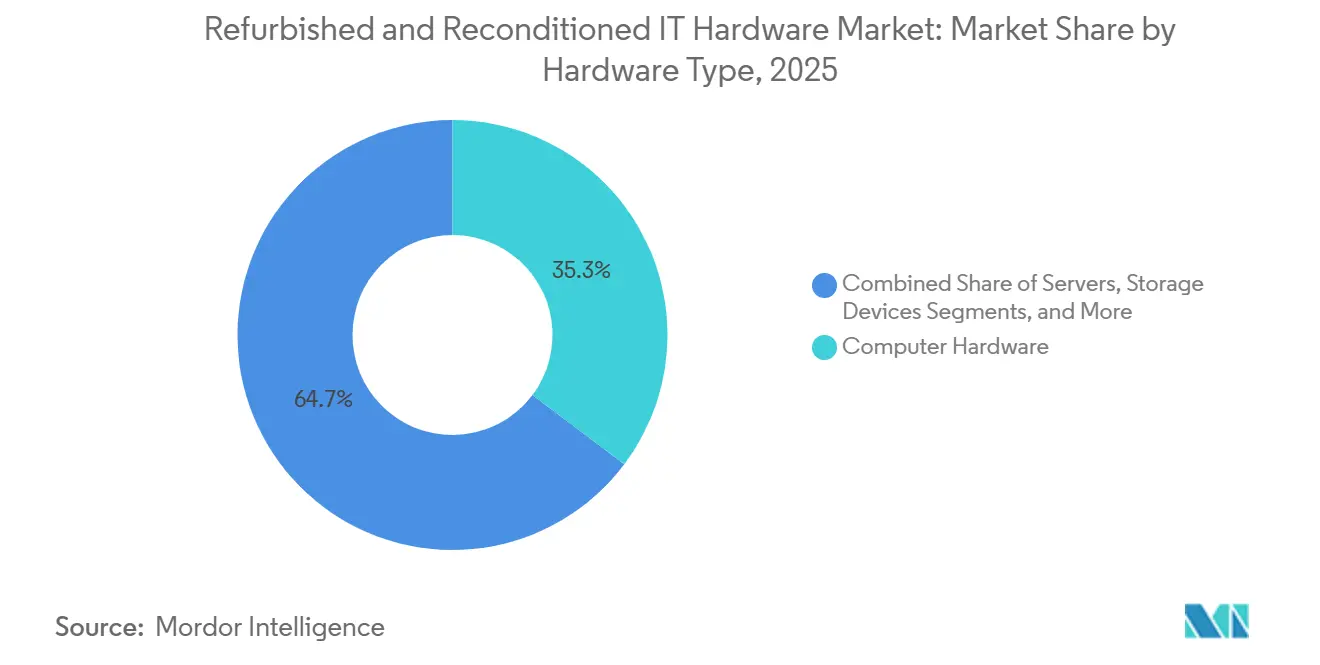
Computer hardware accounted for 34.56% of 2025 revenue, reflecting standardized laptop and desktop refurbishment that benefits from abundant spare parts. Servers, however, are forecast to grow at 9.46% CAGR, driven by edge computing and AI inference workloads that prize cost-effective distributed capacity. The refurbished and reconditioned IT hardware market size for servers is projected to widen as hyperscale decommissioning feeds dual-socket x86 units into secondary channels, which regional cloud providers eagerly absorb. Storage devices track data-center NVMe upgrades that release SATA SSDs into archival roles, yet falling NAND prices squeeze discounts. Networking gear adoption is buoyed by E-Rate grants for Wi-Fi upgrades in U.S. schools. Peripherals stay flat because low ASPs limit refurbishment economics, though rugged tablets emerge as niche growth plays.
Desktop dominance relies on predictable form factors and quick turnaround, but server opportunity scales as containerized applications decouple software from hardware, making 3-year-old units acceptable for stateless microservices. NVMe adoption narrows the price gap between new and used SSDs, pressuring margins. In contrast, networking equipment gains ground through OEM-certified refresh programs that promise 90% discounts with full warranties. Overall, high-margin enterprise categories are consolidating around OEM channels, while desktops and laptops remain a fragmented battleground for independent resellers.



By End-User Industry: Classrooms Lead the Charge
IT and telecommunications accounted for 32.40% of 2025 sales, driven by managed-service firms deploying used servers and arrays to shave capex. Education, though, is slated for the fastest 10.26% CAGR, powered by USD 201.57 per-student E-Rate allocations covering internal connections until 2030. The refurbished and reconditioned IT hardware market share in classrooms will expand as districts pair budget stretch with sustainability mandates. BFSI and healthcare trail because residual-data risk outweighs cost advantage. Government uptake rises in the United Kingdom and Canada, where carbon-reduction targets require circular procurement. Manufacturing plants retrofit refurbished industrial PCs to avoid retooling expenses.
Telecom operators already trust secondary gear thanks to in-house validation skills. School districts, lacking capital, snap up Grade B Chromebooks and switches. Big banks limit the use of hardware to dev-test labs, whereas regional lenders often procure refurbished servers outright. Hospitals stay cautious unless vendors provide blockchain custody ledgers. Public agencies in emerging Asia face certification bottlenecks, slowing penetration. The pattern suggests volume growth in price-sensitive sectors and premium certification demand in regulated verticals.
By Distribution Channel: Marketplaces Accelerate
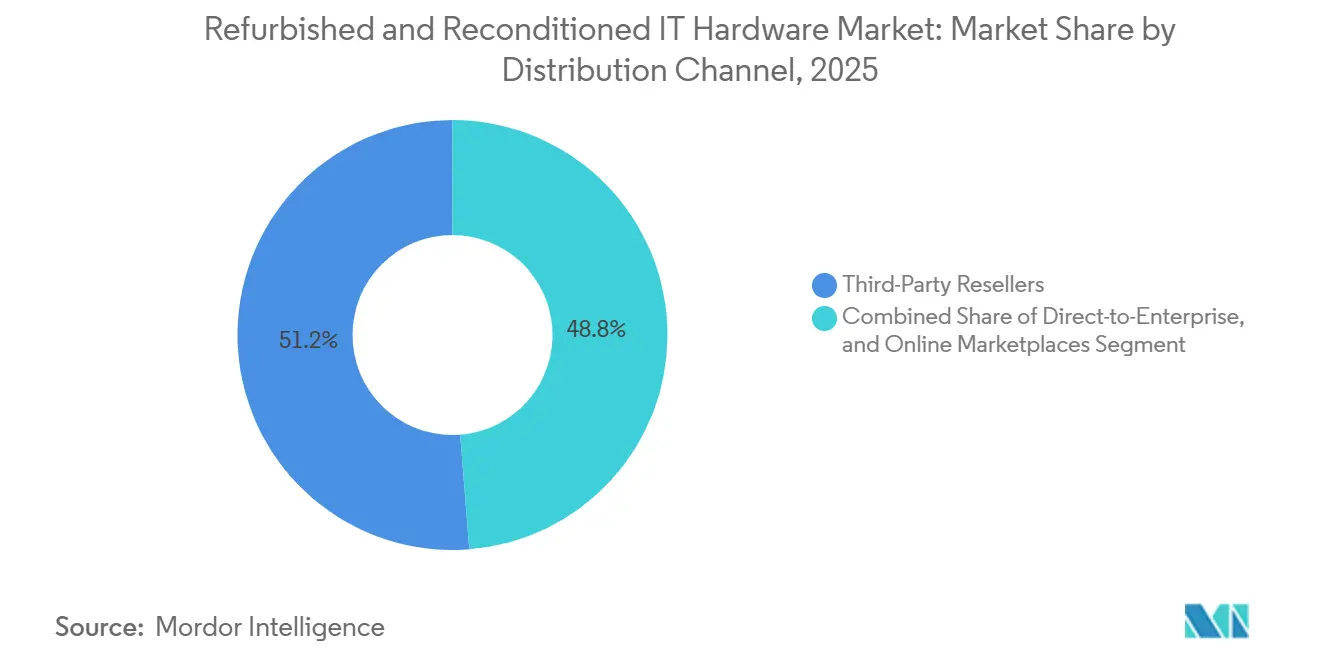
Third-party resellers owned 51.24% of 2025 turnover, offering imaging, rack-and-stack, and on-site support services that marketplaces cannot match. Online marketplaces, however, are growing at 11.28% CAGR, leveraging Prime-level logistics and AI pricing to woo small businesses. Direct-to-enterprise OEM programs capture high-margin accounts by bundling refurbished hardware with existing SLA frameworks.
Online marketplace traction reflects consumerized buying behavior, and Back Market shortens sell-through cycles through reinforcement-learning engines. Resellers respond by ramping e-commerce storefronts but face commission drag. OEM direct channels exploit installed basesfor example, Dell’s 180 million commercial PCs underpin Apex buyback loops. Channel bifurcation will persist: marketplaces dominate SMBs, resellers and OEM loops secure enterprises.
By Refurbishment Grade: Quality Premiums Tighten
Grade B accounted for 47.40% of 2025 revenue, offering 30-40% discounts for minor cosmetic wear. Grade A is advancing at a 9.87% CAGR as OEM certifications dispel quality concerns. The refurbished and reconditioned IT hardware market size premium for Grade A is shrinking; AI vision systems standardize grading, so buyers trust that Grade B meets spec even if scuffed. Grade C dominates emerging markets, where affordability trumps aesthetics, mirroring a 40% penetration of refurbished smartphones in South Africa.[4]GSMA Intelligence, “Mobile Economy: Sub-Saharan Africa 2024,” gsma.com
Automated inspection technologies are elevating baseline quality across all refurbishment grades, thereby narrowing price differentials and compressing the traditional discount hierarchy. OEM-backed Grade A certification programs further intensify competition by leveraging proprietary firmware tools and diagnostics, posing a significant threat to independent refurbishers. As a result, strategic approaches are diverging, players with advanced diagnostic capabilities are focusing on premium Grade A segments, while cost- and logistics-efficient operators are scaling volumes in the more price-sensitive Grade B and C categories.
Geography Analysis
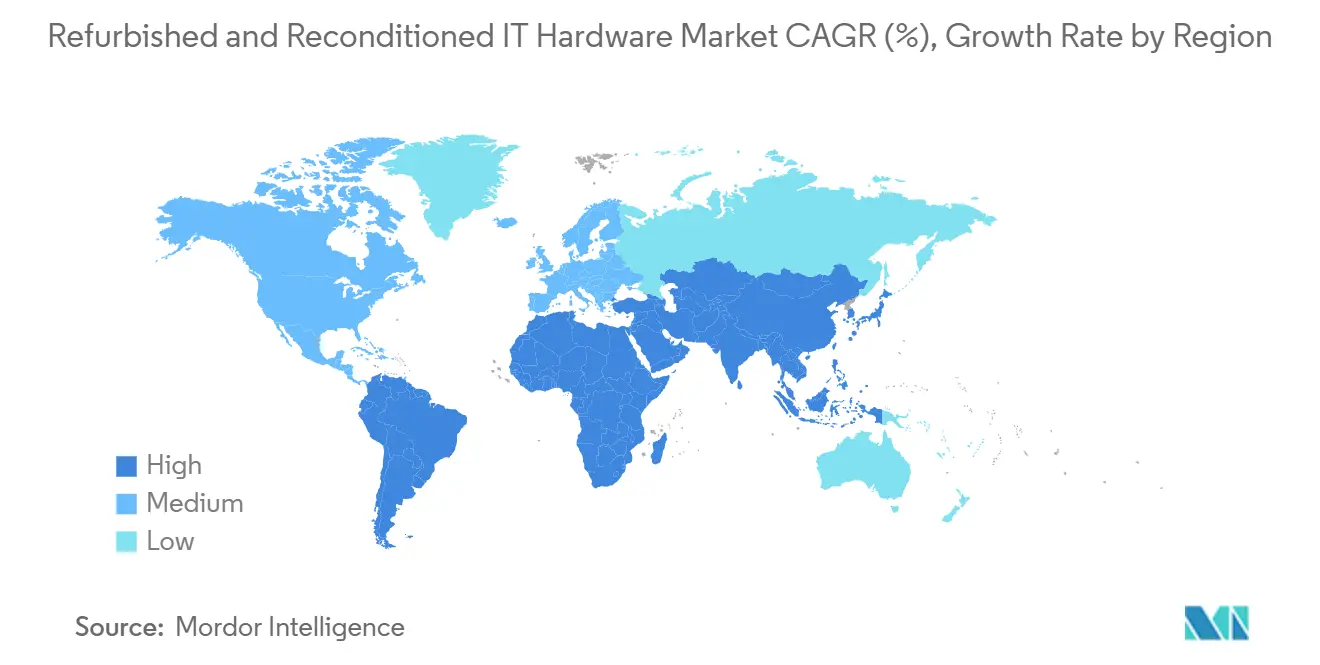
North America accounted for 38.42% of 2025 revenue, supported by stringent National Institute of Standards and Technology (NIST)-driven data sanitization norms and predictable refresh cycles among hyperscale operators. Sustained demand is further reinforced by U.S. education funding programs and Canada’s carbon reduction targets, which encourage the reuse of IT assets. However, the growing adoption of OEM-led as-a-service models, where hardware remains within controlled vendor ecosystems, could constrain the availability of devices entering the secondary refurbishment market over time.
Asia-Pacific is poised for the fastest 10.76% CAGR, propelled by India’s USD 1.7 billion secondary-IT market and China’s recycling mandates that direct assets to licensed refurbishers. Formal enforcement, Thailand’s 132 metric ton e-waste seizure in March 2026, shifts supply from gray channels to certified plants. Fragmented certifications hike costs for multinationals, favoring domestically accredited vendors. Europe’s growth is steady under the Ecodesign and Right-to-Repair directives, which extend product lifespans and reduce information asymmetry.
South America and Africa exhibit volume potential where currency pressures make new hardware unaffordable and refurbished alternatives reach government digital-equity programs. Middle East supply chains, once routed through Dubai, adjust to geopolitical disruptions by diverting flows to Singapore and Rotterdam. Overall, mature regions yield higher margins through certification premiums, whereas emerging markets deliver scale with elevated working-capital risk.

Competitive Landscape
The refurbished and reconditioned IT hardware market indicates moderate concentration. Global distributors Ingram Micro and Arrow Electronics bundle ITAD with new sales, giving enterprise customers single-invoice simplicity. Specialists Sims Lifecycle Services and TES-AMM win sustainability-driven bids by carrying dual R2v3 and e-Stewards badges. Iron Mountain projects USD 850 million ALM revenue in 2026, buoyed by blockchain custody demand in heavily regulated sectors.
OEMs are tightening vertical integration, with offerings such as Dell APEX, HPE GreenLake, Lenovo TruScale, and Cisco Refresh keeping hardware within closed-loop ecosystems while offering warranties comparable to those of new products, thereby eroding the traditional pricing advantage of independent resellers. At the same time, digital marketplaces like Amazon Renewed and Back Market are leveraging machine learning-based grading systems and highly efficient logistics networks to scale rapidly and dominate consumer-facing segments, intensifying competitive pressure across the value chain.
Emerging challengers such as Refurb.io and PlanITROI are pushing subscription models that swap capex for opex, resonating with CFOs. Technology investment defines winners: processors that deploy automated optical inspection and NLP log analytics achieve 5-8%-point margin gains over manual peers. Certification fragmentation, however, remains a moat; vendors capable of multi-standard compliance enjoy pricing power across tri-continental deployments.
Refurbished and Reconditioned IT Hardware Industry Leaders
Ingram Micro Inc.
Arrow Electronics, Inc.
Sims Lifecycle Services, Inc.
Dell Technologies Inc.
Hewlett Packard Enterprise Company
- *Disclaimer: Major Players sorted in no particular order

Recent Industry Developments
- March 2026: Thailand’s Department of Industrial Works seized 132 metric ton of undeclared e-waste at Laem Chabang Port, steering inventories toward licensed refurbishers
- February 2026: Geopolitical tensions in the United States-Israel-Iran theater disrupted Dubai’s ITAD hub, rerouting shipments via Singapore and Rotterdam, trimming margins by 3-5 ppts.
- September 2025: NIST mandated the cryptographic erasure or destruction of media in its Special Publication 800-88 Rev 2.
- July 2025: The EU enforced its Right to Repair Directive, mandating a decade-long parts availability for electronics.


Global Refurbished and Reconditioned IT Hardware Market Report Scope
The Refurbished and Reconditioned IT Hardware Market comprises revenues generated from the resale of pre-owned IT equipment that has been tested, repaired, restored, and certified for reuse by manufacturers, third-party vendors, or specialized refurbishers. These products are offered at lower cost than new hardware, providing organizations with cost-efficient, sustainable, and reliable alternatives while extending the lifecycle of IT assets and supporting circular-economy initiatives.
The Refurbished and Reconditioned IT Hardware Market Report is Segmented by Hardware Type (Servers, Storage Devices, Networking Equipment, Computer Hardware, Peripherals, and Other Hardware Types), End-User Industry (IT and Telecommunication, BFSI, Healthcare and Life Sciences, Education, Government and Public Sector, Manufacturing, and Other End-User Industries), Distribution Channel (Direct-to-Enterprise, Third-Party Resellers, and Online Marketplaces), Refurbishment Grade (Grade A, Grade B, and Grade C), and Geography (North America, South America, Europe, Asia-Pacific, Middle East, and Africa). The Market Forecasts are Provided in Terms of Value (USD).
| Servers |
| Storage Devices |
| Networking Equipment |
| Computer Hardware |
| Peripherals |
| Other Hardware Types |
| IT and Telecommunication |
| BFSI |
| Healthcare and Lifesciences |
| Education |
| Government and Public Sector |
| Manufacturing |
| Other End-User Industries |
| Direct-to-Enterprise |
| Third-Party Resellers |
| Online Marketplaces |
| Grade A |
| Grade B |
| Grade C |
| North America | United States |
| Canada | |
| Mexico | |
| South America | Brazil |
| Argentina | |
| Rest of South America | |
| Europe | Germany |
| United Kingdom | |
| France | |
| Italy | |
| Spain | |
| Russia | |
| Rest of Europe | |
| Asia-Pacific | China |
| India | |
| Japan | |
| South Korea | |
| Australia | |
| Rest of Asia-Pacific | |
| Middle East | Saudi Arabia |
| United Arab Emirates | |
| Turkey | |
| Rest of Middle East | |
| Africa | South Africa |
| Nigeria | |
| Kenya | |
| Rest of Africa |
| By Hardware Type | Servers | |
| Storage Devices | ||
| Networking Equipment | ||
| Computer Hardware | ||
| Peripherals | ||
| Other Hardware Types | ||
| By End-User Industry | IT and Telecommunication | |
| BFSI | ||
| Healthcare and Lifesciences | ||
| Education | ||
| Government and Public Sector | ||
| Manufacturing | ||
| Other End-User Industries | ||
| By Distribution Channel | Direct-to-Enterprise | |
| Third-Party Resellers | ||
| Online Marketplaces | ||
| By Refurbishment Grade | Grade A | |
| Grade B | ||
| Grade C | ||
| by Geography | North America | United States |
| Canada | ||
| Mexico | ||
| South America | Brazil | |
| Argentina | ||
| Rest of South America | ||
| Europe | Germany | |
| United Kingdom | ||
| France | ||
| Italy | ||
| Spain | ||
| Russia | ||
| Rest of Europe | ||
| Asia-Pacific | China | |
| India | ||
| Japan | ||
| South Korea | ||
| Australia | ||
| Rest of Asia-Pacific | ||
| Middle East | Saudi Arabia | |
| United Arab Emirates | ||
| Turkey | ||
| Rest of Middle East | ||
| Africa | South Africa | |
| Nigeria | ||
| Kenya | ||
| Rest of Africa | ||


Key Questions Answered in the Report
How large will refurbished and reconditioned IT hardware spending be by 2031?
The market is forecast to reach USD 31.29 billion by 2031, expanding at an 8.44% CAGR from 2026.
Which hardware category is growing the fastest?
Refurbished servers are projected to post a 9.46% CAGR through 2031, outpacing desktops, laptops, and peripherals.
Why are schools rapidly adopting refurbished devices?
U.S. E-Rate budgets of USD 201.57 per student for 2026-2030 encourage districts to stretch funds with certified refurbished networking gear and Chromebooks.
What is the biggest barrier for banks and hospitals?
Data-security breach concerns remain the primary hurdle, given the USD 10.93 million average cost of a healthcare incident.
How are OEMs changing the competitive field?
Programs like Dell Apex and HPE GreenLake retain ownership of hardware, refurbish it in-house, and resell with factory warranties, capturing share from independent resellers.
Page last updated on:





