Market Overview
| Study Period | 2020 - 2031 |
|---|---|
| Forecast Data Period | 2026 - 2031 |
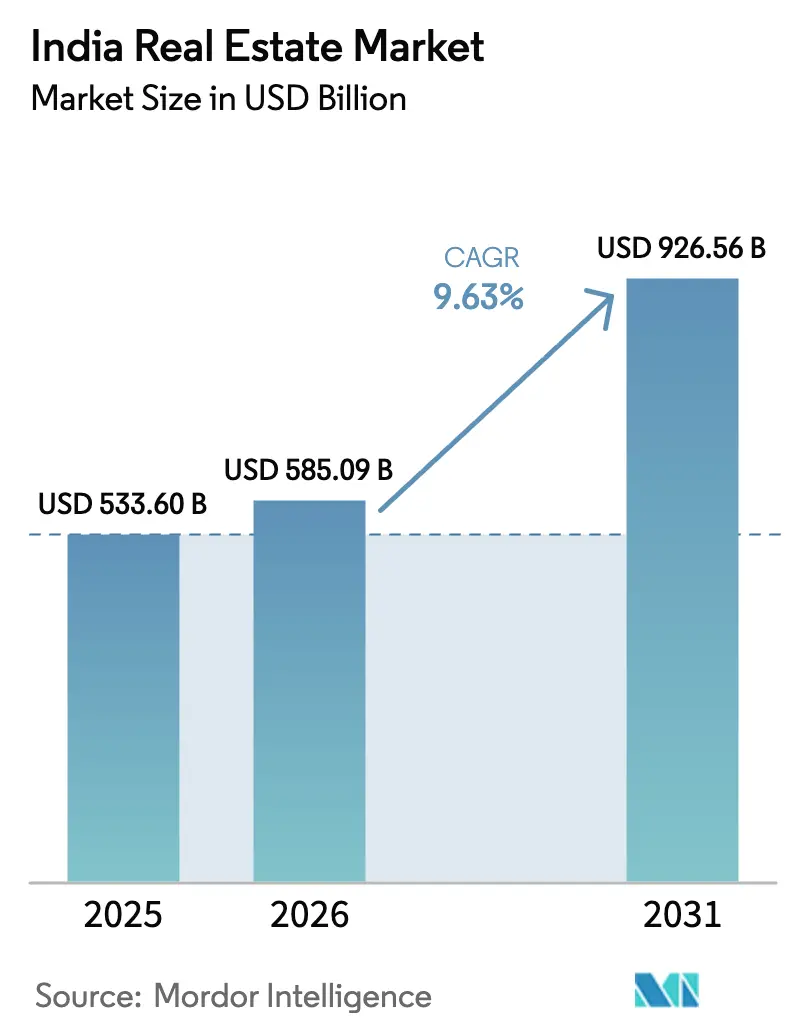
| Base Year Market Size (2025) | USD 533.60 Billion |
| Market Size (2026) | USD 585.09 Billion |
| Market Size (2031) | USD 926.56 Billion |
| Growth Rate (2026 - 2031) | 9.63% CAGR |
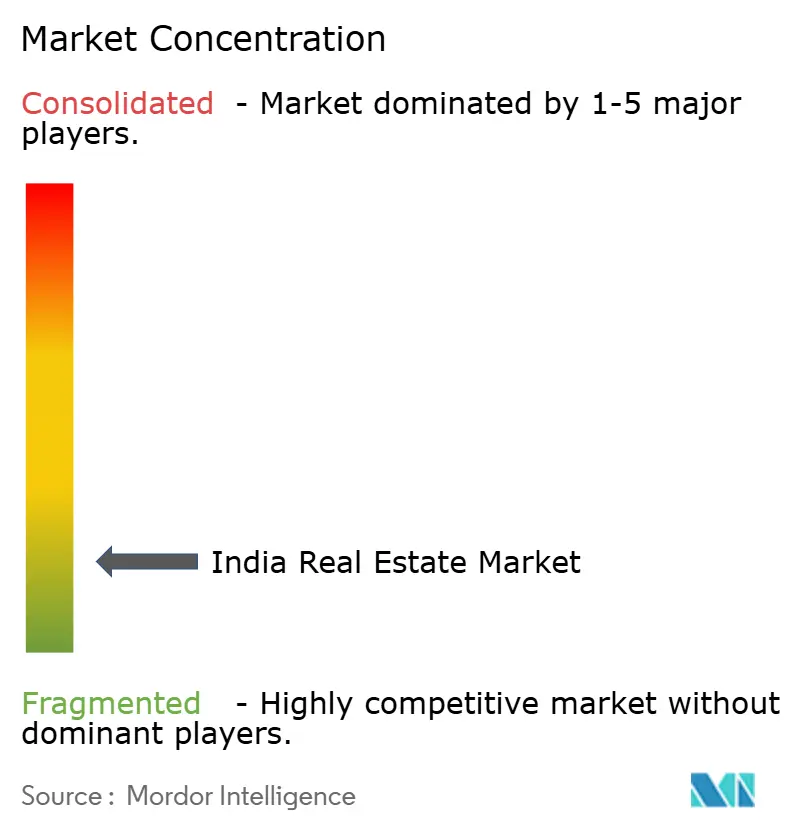
| Market Concentration | Low |
Major Players *Disclaimer: Major Players sorted in no particular order Image © Mordor Intelligence. Reuse requires attribution under CC BY 4.0. | |
India Real Estate Market Analysis by Mordor Intelligence
The India real estate market size is USD 585.09 billion in 2026 and is forecast to reach USD 926.56 billion by 2031 at a 9.63% CAGR. Growth in the India real estate market is led by stronger corporate leasing, rising institutional ownership through REITs, and the continued expansion of Global Capability Centers that favor long-term leases in technology and business services hubs. Liquidity depth has improved at the top end of the market as listed REITs scaled assets, distributions, and untapped debt capacity, which supports acquisition-led expansion without equity dilution. Residential demand remains steady in better-connected micro-markets where metro and highway projects are unlocking new corridors, while affordability constraints at entry price points are pushing some buyers toward rentals or peripheral locations. Industrial and logistics leasing has set new records as e-commerce, third-party logistics, and overseas manufacturers increase space take-up to serve national distribution and export-linked production.[1]https://www.ibef.org/
Key Report Takeaways
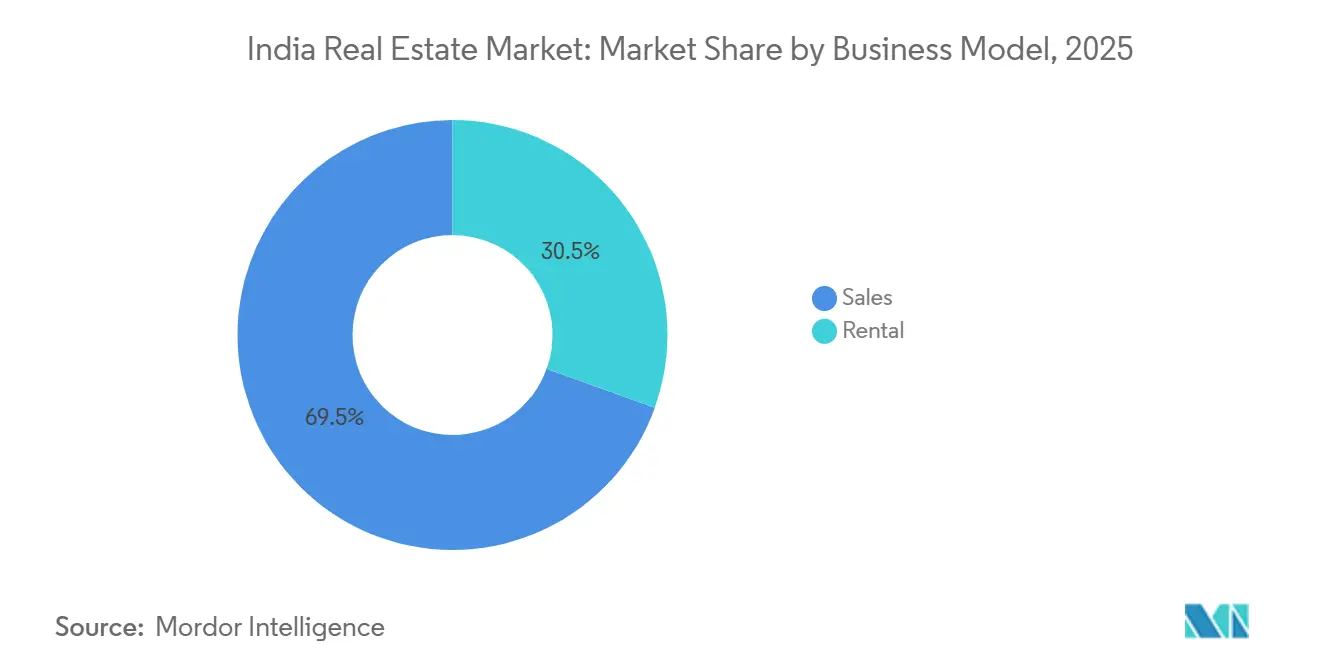
- By business model, the Sales model held 69.5% of the India real estate market share in 2025, while the Rental segment is projected to grow at a 10.99% CAGR through 2031.
- By property type, Residential accounted for 70.1% of the India real estate market share in 2025, and Commercial is forecast to expand at a 10.79% CAGR through 2031.
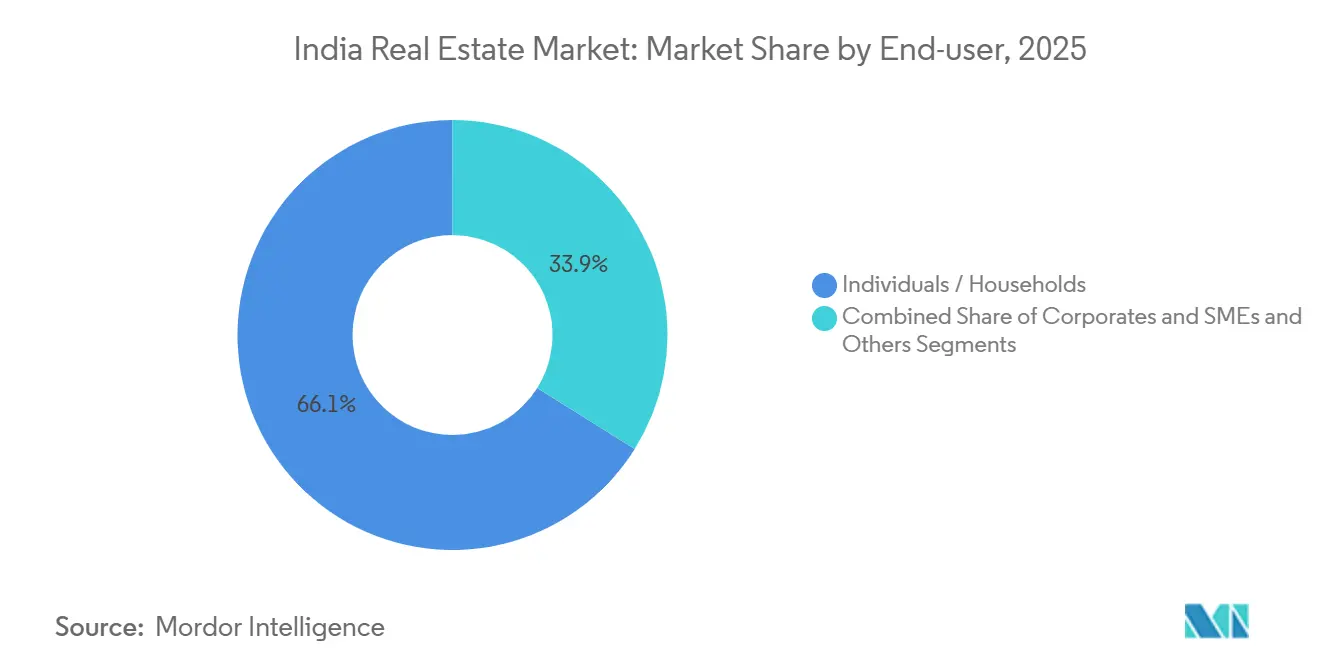
- By end-user, Individuals and Households accounted for 66.1% of transaction value in 2025, with Corporates and SMEs projected to grow at a 11.01% CAGR through 2031.
- By geography, the Mumbai Metropolitan Region accounted for 28.4% of revenue share in 2025, while Hyderabad is the fastest-growing city with an expected 11.44% CAGR through 2031.
Note: Market size and forecast figures in this report are generated using Mordor Intelligence’s proprietary estimation framework, updated with the latest available data and insights as of January 2026.
India Real Estate Market Trends and Insights
Drivers Impact Analysis*
| Drivers | (~) % Impact on CAGR Forecast | Geographic Relevance | Impact Timeline |
|---|---|---|---|
| GCC/IT-ITeS expansion and manufacturing/warehousing growth fueling commercial and industrial demand | +2.6% | Bengaluru, Hyderabad, Chennai, Delhi NCR, Mumbai, with spillover to Pune | Medium term (2-4 years) |
| Urbanization and rising incomes driving housing demand across metros and growth corridors | +2.3% | National, concentrated in Mumbai, Delhi NCR, Bengaluru, Hyderabad, Pune | Medium term (2-4 years) |
| Home loan availability and stable EMIs supporting affordable and mid-income segments | +2.1% | National, particularly benefiting Tier-1 and Tier-2 cities | Short term (≤ 2 years) |
| Regulatory reforms (e.g., RERA) and formalization improving transparency and investor confidence | +1.8% | National, early gains in Maharashtra, Haryana, Telangana | Long term (≥ 4 years) |
| REITs and institutional capital deepening liquidity and exit avenues | +1.5% | National, concentrated in the top 7 cities (Mumbai, Delhi NCR, Bengaluru, Hyderabad, Pune, Chennai, Kolkata) | Long term (≥ 4 years) |
| Source: Mordor Intelligence | |||
GCC/IT-ITeS Expansion and Manufacturing/Warehousing Growth Fueling Commercial and Industrial Demand
Global Capability Centers are reshaping net absorption, with their share of office demand projected at 40% in 2025 as technology and research mandates expand footprints in Bengaluru, Hyderabad, and Chennai. India’s office market is expected to record 40 to 45 million square feet of net absorption in 2025, led by the top metros with balanced contributions from Bengaluru, Delhi NCR, Mumbai, Hyderabad, and Chennai. Industrial and logistics leasing reached 27.1 million square feet in H1 2025, up 63% year over year, with e-commerce operators lifting their share to 25% and foreign corporates accounting for 43% of Q2 2025 space take-up. Manufacturers plan to scale operations and expand into Tier-2 and Tier-3 cities over the next two to three years, and policymakers earmarked funding for plug-and-play parks to support faster set-up. Collectively, these forces underpin a durable leasing cycle across offices, warehouses, and ancillary assets in the India real estate market.[2]https://www.cbre.co.in/
Urbanization and Rising Incomes Driving Housing Demand Across Metros and Growth Corridors
Urbanization and income growth continue to reshape residential absorption in India’s top cities, with demand tilting toward employment-rich corridors and well-connected suburban nodes. The urban population is projected to reach 600 million by 2030, and this shift is visible in the concentration of new launches and sales in metro-adjacent growth corridors. Inventory rotation is improving in markets where developers calibrate launches to match premium demand, as seen in Pune’s quarters-to-sell levels that have hovered near cycle lows. Affordability pressure at lower ticket sizes is pushing some first-time buyers toward rentals and peripheral locations, while higher-income households continue to lead sales in premium projects near transit and job hubs. New metro lines and expressways are reinforcing this pattern by shortening commutes and linking residential catchments to CBDs and airports, which sustains pricing resilience in select micro-markets. The result is a more segmented India real estate market where premium and mid-income stock turn faster, while sub-USD 120,000 housing remains supply-constrained in Tier-1 cores.[3]https://www.icra.in/
Home Loan Availability and Stable EMIs Supporting Affordable and Mid-Income Segments
Mortgage availability and steady EMIs help sustain end-user demand, particularly in Tier-1 and Tier-2 cities, where formal incomes enable access to credit. Banks and housing finance companies have focused origination on compliant projects with clear title and escrow safeguards, improving risk selection across the lending system. Affordability metrics have improved in select markets on an EMI-to-income basis, although the absolute ticket sizes in Tier-1 cores remain high for first-time buyers. Developers are aligning launches with mid-income and premium demand and are using better phasing to manage cash flows through construction cycles. The near-term effect is a floor under volumes for the Indian real estate market when financing is available against well-located projects and demand visibility is strong.
Regulatory Reforms and Formalization Improving Transparency and Investor Confidence
The enforcement phase of state RERA authorities has strengthened compliance and buyer safeguards, which in turn has encouraged more formal capital to participate. Maharashtra’s authority suspended registrations of 1,905 housing projects for non-compliance and directed that homebuyers receive compensation within defined timelines, tightening accountability for delays. Insolvency resolution timelines have been long, with the average Corporate Insolvency Resolution Process closure at 713 days through March 2025, which underscores execution risk that lenders must price. Even with these constraints, scheduled commercial bank credit to real estate grew on a year-over-year basis into March 2025, reflecting a bias toward RERA-compliant projects with transparent escrow structures. The government’s SWAMIH-2 program allocated INR 15,000 crore (USD 1.8 billion) to deliver last-mile funding to stalled projects, which supports completions and protects buyer interests. These measures are incrementally raising standards and providing clearer exit pathways, which bolsters confidence for the real estate market in India.
Restraints Impact Analysis*
| Restraints | (~) % Impact on CAGR Forecast | Geographic Relevance | Impact Timeline |
|---|---|---|---|
| Land acquisition, approvals, and compliance timelines delaying project execution | -1.4% | National, acute in metropolitan regions and urban land-scarce corridors | Medium term (2-4 years) |
| Construction cost escalation and funding constraints for smaller developers | -1.1% | National, disproportionately impacting Tier-2/Tier-3 cities and affordable housing projects | Short term (≤ 2 years) |
| Affordability pressures in Tier-1 cities limiting absorption at higher price points | -0.9% | Mumbai, Delhi NCR, Bengaluru, Pune | Long term (≥ 4 years) |
| Source: Mordor Intelligence | |||
Land Acquisition, Approvals, and Compliance Timelines Delaying Project Execution
Land aggregation, land-use conversion, and multi-agency approvals can stretch project timelines beyond developer cash-flow tolerances in dense metros. Insolvency resolution has been slow, with average CIRP closures at 713 days as of March 2025, which is well beyond statutory timelines and increases the cost of capital. Maharashtra’s RERA authority suspended registrations of 1,905 housing projects for non-compliance and directed remedies for homebuyers, which raises the execution bar for developers with weaker balance sheets. Uttar Pradesh has eased farmland conversion for some residential schemes by allowing local authorities to approve certain transitions from agricultural to residential use, which can speed up select projects. Courts have also nudged stricter accountability, including interest parity for delayed possession relative to penalties charged to buyers, which feeds into feasibility models and risk pricing. These constraints slow supply velocity in the India real estate market, especially in land-scarce corridors where approvals remain complex.
Construction Cost Escalation and Funding Constraints for Smaller Developers
Input costs for cement, steel, and labor have increased, while labor code changes are expected to lift wage-related outflows by 8% to 12% and raise Provident Fund and gratuity liabilities. Taxes remain a high component of property costs, although GST cuts on housing and materials have partially reduced the burden, creating a net relief that does not fully offset input inflation. A recent poll of economists and property analysts expects home prices to rise from 2025 to 2027, which points to margin recovery by developers rather than full pass-through of tax relief to buyers. Industry bodies have urged a revision to the affordable housing price cap from INR 45 lakh (USD 54.2 thousand) to INR 90 lakh (USD 108.4 thousand), given the cumulative inflation since the cap was set in 2017. Funding costs for smaller NBFCs and HFCs remain higher than bank peers, and associations have asked for refinance support and risk-weight alignment to improve credit availability to underserved borrower segments. Private credit is filling some gaps through project-specific financing and refinancing, which preserves momentum in the India real estate market despite higher pricing.
*Our forecasts treat driver/restraint impacts as directional, not additive. The impact forecasts reflect baseline growth, mix effects, and variable interactions.
Segment Analysis
By Business Model: Rental segment scales as institutional capital pursues stabilized yields
Sales accounted for 69.5% of the India real estate market size in 2025. The Rental segment is projected to be the fastest-growing at a 10.99% CAGR through 2031, which reflects a broad institutional shift toward stabilized, income-generating assets across offices, retail, warehousing, and emerging alternative asset classes. GCC-rich office markets prefer long-duration leases to limit balance sheet risk, and these preferences are set to hold as MNCs scale R&D and tech hubs. Logistics and warehousing users are increasingly opting for build-to-suit agreements that match network optimization needs as e-commerce operators lifted their share of industrial leasing to 25% in H1 2025. Across operational portfolios, listed REITs reported near-91% occupancy in September 2025 and distribution yields in the 6% to 7% range in FY 2025, which signals durable rental cash flows that support incremental allocations. These income characteristics underpin the steady institutionalization of the leasing model in the India real estate market.
The availability of untapped debt capacity at listed REITs, estimated near INR 230 billion (USD 2.8 billion), supports acquisition-led growth without equity dilution, while strong capital market access has enabled marquee transactions and QIPs. Recent examples include Brookfield India REIT’s acquisition of a 50% stake in a 3.3 million square foot North Commercial Portfolio for INR 12.28 billion (USD 148.0 million) and a follow-on raise of INR 47 billion (USD 566.3 million) that broadened the investor base. On the Sales side, top-listed developers delivered record bookings in calendar 2024, with Godrej Properties reporting INR 28,800 crore (USD 3.5 billion) of sales on the back of active land acquisition and joint development agreements. At the same time, insolvency and approval timelines continue to raise execution risk for sales-led projects, which sustains investor preference for leased and stabilized assets. The balance of these factors supports the Rental segment’s status as the structural growth leader in the India real estate market over the forecast period.


By Property Type: Commercial outpaces residential as GCC mandates reshape office absorption
In 2025, residential captured 70.1% of the real estate market size in India. Commercial is projected to grow at a 10.79% CAGR through 2031, backed by GCC expansions and logistics build-outs to serve consumption and manufacturing growth. India’s office market is expected to record 40 to 45 million square feet of net absorption in 2026, with Bengaluru, Delhi NCR, Mumbai, Hyderabad, and Chennai driving the bulk of the total. On the demand side, GCCs are projected to account for 40% of total office demand in 2025, up from the mid-30s in 2024, as multinationals deepen engineering and analytics capabilities in India. Industrial and logistics leasing hit 27.1 million square feet in H1 2025, up 63% year over year, with e-commerce more than doubling its share and foreign corporates capturing a larger share of quarterly take-up. In retail-led commercial, consolidation moves such as Phoenix Mills’ buyout of CPPIB’s 49% interest in Island Star Mall Developers for INR 5,449 crore (USD 656.5 million) will enable more integrated control and potential monetization options.
By End-user: Corporate and SME leasing surges as GCC footprint expands
Individuals and Households accounted for 66.1% of transaction value in 2025, and Corporates and SMEs are projected to lead growth with an 11.01% leasing CAGR through 2031. GCCs drive a rising share of leasing and are expected to account for 40% of office demand in 2025, with Bengaluru the top destination and Chennai, Hyderabad, and Pune increasing their contributions. Industrial users are scaling footprints to match India’s role in global supply chains, and foreign corporates accounted for 43% of Q2 2025 industrial leasing across APAC, American, and EMEA tenants in India. E-commerce operators also lifted their leasing share as they reconfigure networks for faster delivery, which supports large build-to-suit pipelines in the India real estate market. New digital infrastructure is expanding, with Google announcing USD 6 billion for a 1 GW data center in Andhra Pradesh and the Adani Group outlining USD 10 billion for a 10 GW portfolio across multiple states.

Geography Analysis
Mumbai Metropolitan Region held 28.4% of total revenue in 2025, supported by a fiscal 2024-25 transaction value that crossed INR 1.55 lakh crore (USD 18.7 billion). The underground Metro Line 3 corridor is designed to reduce north-south travel times by 40% to 50% and connect CBDs such as Bandra Kurla Complex, Worli, and Dadar with major residential catchments and the airport. Luxury registrations above INR 5 crore maintained a firm share of total transactions, and absorption in Bandra, BKC, Parel, and Worli stayed steady due to lower redevelopment density and constrained future supply. Affordability improved in nominal terms in 2025 as EMI-to-income fell below 50% in Mumbai for the first time, but absolute prices and upfront costs remain a challenge for first-time buyers in core locations. Delhi NCR is on track to post one of the strongest price increases among major cities for 2025, while upcoming launches in Gurugram and Noida add to supply depth in the mid and premium ranges. Signature Global’s launch pipeline worth INR 6,000 crore (USD 723 million) and planned fiscal 2026 pre-sales target of INR 12,500 crore (USD 1.5 billion) point to sustained developer confidence in the region’s end-user and investor demand.
Competitive Landscape
The India real estate market is fragmented in residential development, where the top five listed developers by bookings account for less than 20% of the national value, and regional players and unlisted enterprises retain strong positions in Tier-2 and Tier-3 corridors. In contrast, institutional consolidation is evident in Grade A offices and retail, where five listed REITs now control about 15% of office stock in the top seven cities and have scaled to an aggregate market capitalization of INR 1.6 trillion (USD 19.3 billion) by September 2025. Strategic focus has converged on capital-efficient land sourcing via joint development agreements, portfolio acquisitions through REIT platforms, and vertical integration into data centers and logistics for spillover demand capture. Developers with stronger balance sheets have accelerated land-bank replenishment to secure medium-term visibility, while leveraging partnerships to defer upfront payments until project cash flows stabilize.
Selected moves underscore these themes. Godrej Properties reported INR 28,800 crore (USD 3.5 billion) of sales in calendar 2024 and added 16 land parcels with INR 36,250 crore (USD 4.4 billion) revenue potential, reaffirming a JV-first approach to improve capital turns. Macrotech Developers outlined INR 8,000 crore (USD 964 million) of FY 2025 capex, with INR 4,500 crore (USD 542 million) earmarked for land and JDAs and INR 3,500 crore (USD 422 million) for construction, and also signed an MoU for a USD 3.35 billion green integrated data center park in Mumbai. Brookfield India REIT acquired a 50% stake in Worldmark Delhi, Airtel Center, Worldmark Gurugram, and Pavilion Mall for INR 12.28 billion (USD 148.0 million) and later raised INR 47 billion (USD 566.3 million) via QIP, bringing in marquee domestic and global institutions. Phoenix Mills bought out CPPIB’s 49% stake in Island Star Mall Developers for INR 5,449 crore (USD 656.5 million) payable in tranches, consolidating full control of key mall assets in Bengaluru and related subsidiaries.
Capital allocation is also shifting toward digital infrastructure. Data center platforms led by global and domestic investors have announced multi-billion dollar pipelines, including Google’s USD 6 billion Andhra Pradesh investment and the Adani Group’s USD 10 billion multi-state plan toward a combined 11 GW capacity. The retail REIT universe could reach INR 60,000 to 80,000 crore by 2030, equivalent to USD 7.2 billion to USD 9.6 billion, as more mall portfolios reach scale and operational maturity. As lenders emphasize RERA-compliant projects and transparent escrow structures, private credit remains a flexible source of funds for acquisitions, working capital, and last-mile completion. Technology adoption in sales, customer service, and compliance continues to expand as developers and REITs build out digital disclosure and project tracking systems to align with investor and regulatory expectations in the India real estate market.
India Real Estate Industry Leaders
DLF Ltd
Macrotech Developers (Lodha Group)
Godrej Properties
Prestige Estates Projects
Oberoi Realty
- *Disclaimer: Major Players sorted in no particular order

Recent Industry Developments
- November 2025: Phoenix Mills completed Tranche 1 of the buyout of CPPIB’s 49% stake in Island Star Mall Developers for INR 5,449 crore (USD 656.5 million) payable over 36 months, consolidating 100% ownership of Phoenix MarketCity Bengaluru and three subsidiaries.
- September 2025: Macrotech Developers signed an MoU with the Maharashtra government for a USD 3.35 billion green integrated data center park in Mumbai, spanning three parks.
- September 2025: SEBI reclassified Real Estate Investment Trusts as equity instruments, enabling index inclusion and facilitating mutual fund allocations that broaden retail participation.
- August 2025: Phoenix Mills completed One National Park in Chennai and commenced pre-leasing for approximately 0.60 million square feet of offices, expanding its South India office footprint.


India Real Estate Market Report Scope
The real estate sector includes various phases of property dealings, including developing, selling, buying, leasing, and management processes in the commercial sector, residential sector, etc.
The report provides a comprehensive background analysis of the market, covering the current market trends, restraints, technological updates, and detailed information on various segments and the competitive landscape of the industry.
The real estate industry in India is segmented by property type (residential, office, retail, hospitality, and industrial) and cities (Mumbai, Delhi, Pune, Chennai, Hyderabad, and Bangalore). The report offers market size and forecasts for all the above segments in value (USD).


Key Questions Answered in the Report
What is the current size and growth outlook of the India real estate market?
The India real estate market size is USD 585.09 billion in 2026 and is projected to reach USD 926.56 billion by 2031 at a 9.63% CAGR.
Which segments lead and grow fastest within the India real estate market?
Sales leads by model with 69.5% share in 2025 while Rental grows fastest at 10.99% CAGR; Residential leads by type with 70.1% share while Commercial grows fastest at 10.79% CAGR.
Which cities are the largest and fastest growing in the India real estate market?
Mumbai Metropolitan Region is the largest with 28.4% share in 2025, and Hyderabad is the fastest growing with an expected 11.44% CAGR through 2031.
How are REITs influencing the India real estate market?
Five listed REITs own more than 175 million square feet, had 91% occupancy in September 2025, and carry INR 230 billion (USD 2.8 billion) of untapped debt capacity that enables acquisition-led growth.
What factors are driving industrial and logistics leasing in India?
A 63% year-on-year surge in H1 2025 to 27.1 million square feet was driven by e-commerce expanding to 25% share and stronger space take-up by foreign corporates at 43% of Q2 2025 leasing.
What are the main constraints on the India real estate market?
Project execution is slowed by land acquisition and approval timelines, rising input and labor costs, and Tier-1 affordability pressures, while targeted policies and private credit are mitigating some of these headwinds.
Page last updated on:


