
Raman Imaging Systems For Industrial Analysis Market Size and Share
Market Overview
| Study Period | 2020 - 2031 |
|---|---|
| Market Size (2026) | USD 504.45 Million |
| Market Size (2031) | USD 880.80 Million |
| Growth Rate (2026 - 2031) | 11.79 % |
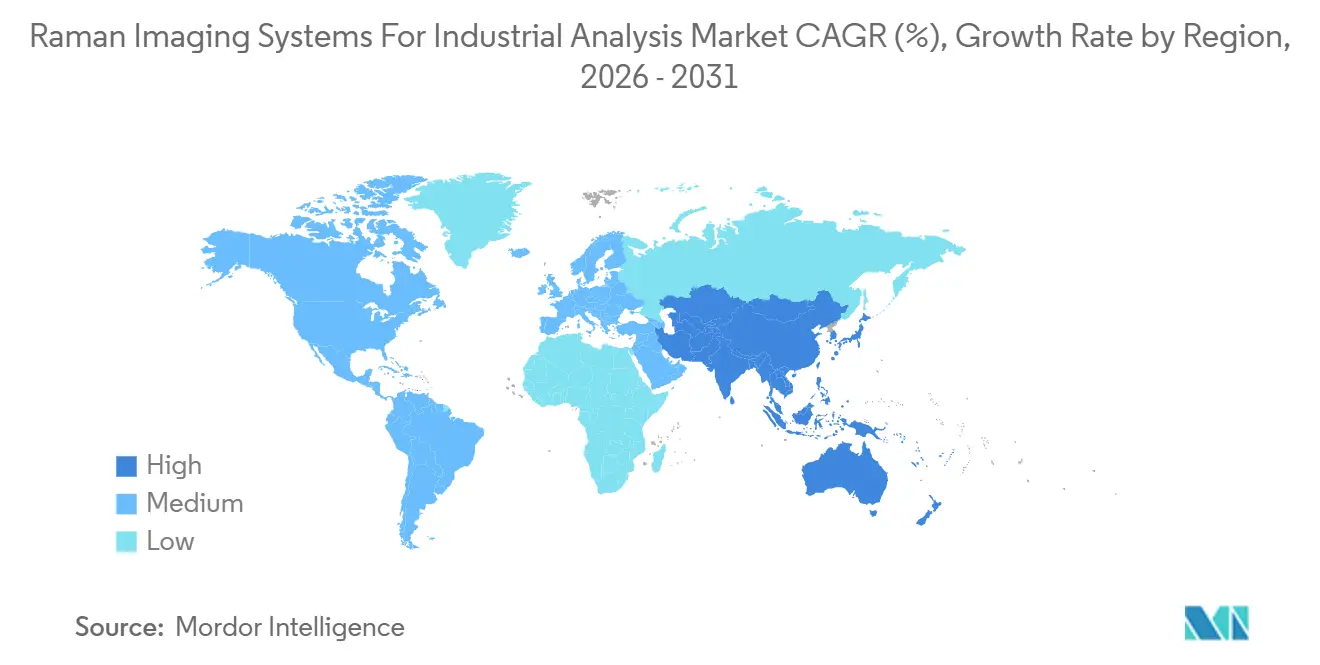
| Fastest Growing Market | Middle East |
| Largest Market | Asia-Pacific |
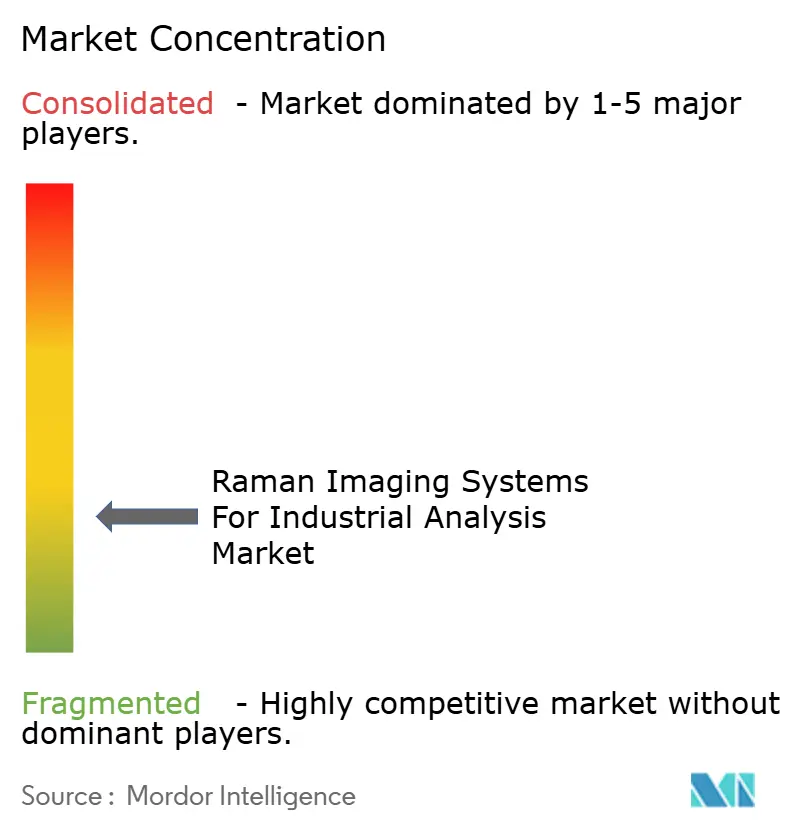
| Market Concentration | Low |
Major Players *Disclaimer: Major Players sorted in no particular order Image © Mordor Intelligence. Reuse requires attribution under CC BY 4.0. | |
Raman Imaging Systems For Industrial Analysis Market Analysis by Mordor Intelligence
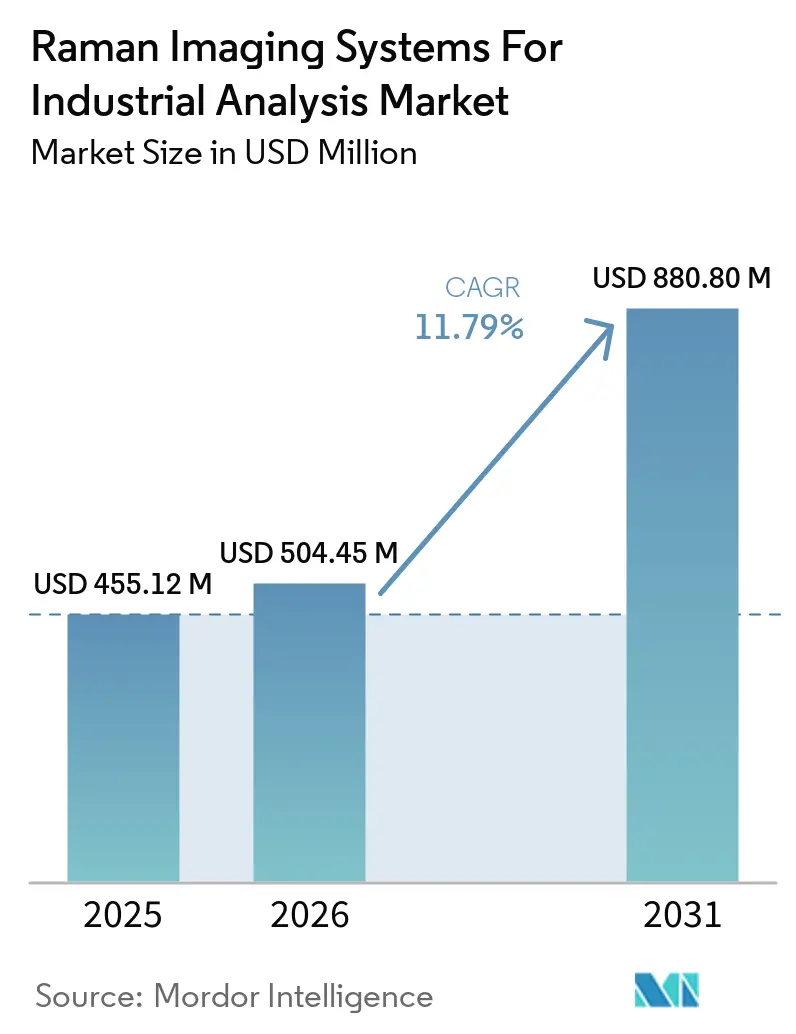
The Raman Imaging Systems for Industrial Analysis Market size was valued at USD 455.12 million in 2025 and estimated to grow from USD 504.45 million in 2026 to reach USD 880.80 million by 2031, at a CAGR of 11.79% during the forecast period (2026-2031). Demand is moving from periodic laboratory sampling toward in-line chemical verification, which can reduce delays in quality decisions and support traceable production records. Raman imaging can analyze molecular vibrations without destroying samples or requiring physical contact, including through glass, polymer packaging, and process-vessel walls. AI-supported spectral processing is shortening analysis workflows and reducing reliance on specialist interpretation, thereby broadening its use in industrial plants. Suppliers are responding by combining instruments with software, validated spectral libraries, application support, and local service capacity. The Raman Imaging Systems for Industrial Analysis Market, therefore, has opportunities in continuous manufacturing, wafer qualification, battery production, and regulated quality control.
Key Report Takeaways
- By technology, conventional confocal Raman held 31.71% of the Raman Imaging Systems for Industrial Analysis Market share in 2025, while SERS is forecast to grow at 13.84% CAGR through 2031.
- By system configuration, benchtop and desktop systems accounted for 42.63% of the Raman Imaging Systems for Industrial Analysis Market size in 2025, while in-line and process systems are forecast to grow at 14.73% CAGR through 2031.
- By analysis type, spatial chemical mapping and distribution analysis represented 24.89% of revenue in 2025, while process and reaction monitoring is forecast to grow at 14.52% CAGR through 2031.
- By end-user industry, manufacturing and industrial enterprises held 27.41% of revenue in 2025, while battery and energy-storage manufacturers are forecast to grow at 14.31% CAGR through 2031.
- By geography, Asia-Pacific held 38.63% of revenue in 2025, while the Middle East is forecast to grow at 13.96% CAGR through 2031.
Note: Market size and forecast figures in this report are generated using Mordor Intelligence’s proprietary estimation framework, updated with the latest available data and insights as of January 2026.
Market Trends and Insights
Drivers Impact Analysis of Raman Imaging Systems For Industrial Analysis Market*
| Driver | (~) % Impact on CAGR Forecast | Geographic Relevance | Impact Timeline |
|---|---|---|---|
| Non-Destructive Industrial Materials Characterization | +2.5% | Global, with concentration in North America and Europe | Medium term (2-4 years) |
| Semiconductor Wafer Stress and Defect Mapping | +2.0% | Asia-Pacific core, including China, Japan, and South Korea, with spillover to North America | Short term (≤ 2 years) |
| In-Process and In-Operando Battery Analysis | +1.9% | Asia-Pacific and Europe | Short term (≤ 2 years) |
| AI-Enabled Spectral Classification and Automated Imaging | +1.6% | Global | Medium term (2-4 years) |
| Traceable Pharmaceutical Quality Control | +1.3% | North America and Europe, with spillover to Asia-Pacific | Medium term (2-4 years) |
| Recycling and Secondary-Material Verification | +0.9% | Europe, with early adoption in North America | Long term (≥ 4 years) |
| Source: Mordor Intelligence | |||
Increasing Adoption of Non-Destructive Industrial Materials Characterization
Manufacturers are replacing destructive cross-sectioning with confocal Raman depth profiling for selected inspection tasks. The method supports layer-by-layer chemical verification of composites, coatings, and adhesive bonds without sample preparation. This approach can reduce the feedback delay that occurs when samples must be removed and sent to a laboratory. It also allows inspection of high-value parts that cannot reasonably be destroyed for testing. Aerospace fastener verification and additive manufacturing qualification are relevant use cases because both require evidence of material consistency. This driver supports wider adoption of Raman Imaging Systems in the Industrial Analysis Market, particularly where non-destructive verification is essential.
Expansion of Semiconductor Wafer Stress and Defect Mapping
Silicon carbide and gallium nitride are used in power electronics and radio-frequency applications, where residual stress and polytype variation can affect device performance. Raman mapping measures phonon peak shifts to identify stress patterns and localized defects prior to subsequent fabrication steps. HORIBA’s LabRAM Odyssey Semiconductor and Nanophoton’s RAMANdrive support automated wafer analysis workflows for these applications. Covalent deployed Oxford Instruments’ WITec360™ with 355 nm and 532 nm laser excitation in wafer-level workflows during June 2026. The deployment covered defect mapping, stress and strain analysis, and failure analysis on wafers up to 300 mm. As foundry output expands, the Raman Imaging Systems for Industrial Analysis Market can gain recurring demand from process-control use rather than only equipment replacement cycles.[1]RSC Publishing. “Unraveling Nanoscale Interfacial Kinetics in Battery Cathodes Through Operando Tip-Enhanced Raman Spectroscopy.” EES Batteries, 2025. pubs.rsc.org
Rising Demand for In-Process and In-Operando Battery Analysis
Battery producers need to identify degradation mechanisms during live cycling rather than relying only on post-mortem inspection. Operando Raman spectroscopy can track lithium-ion intercalation, solid electrolyte interphase evolution, and phase changes without puncturing a cell. A 2025 study using operando tip-enhanced Raman spectroscopy found that grain boundaries in LiMn₂O₄ delithiated before grain interiors. A 2026 study described fiber-optic-embedded operando Raman as a method for linking electrolyte changes to capacity fade in lithium-ion systems.[2IOP Publishing. “An Introductory Guide to Operando Raman Microscopy as a Technique for Probing Battery Electrode Electrochemistry.” Journal of Physics: Energy, 2026. iopscience.iop.org]These capabilities support use in incoming material checks and electrode coating monitoring. The Raman Imaging Systems for Industrial Analysis Market benefits from the fact that each battery facility may require both benchtop systems and in-line probes for different production stages.
Growth of AI-Enabled Spectral Classification and Automated Imaging
AI-enabled tools address operator dependence and throughput constraints in Raman workflows. Conventional chemometric approaches often require expert setup and can be affected by fluorescence, temperature drift, and surface variation. A 2026 review reported classification accuracy above 99% for selected multi-component polymer-mixture applications using convolutional neural networks. A 2025 study reported that generative adversarial networks could generate high-resolution Raman spectra from lower-resolution portable measurements.[3]RSC Publishing. “Generative Adversarial Network-Driven High-Resolution Raman Spectral Generation for Accurate Molecular Feature Recognition.” Analyst, 2025. pubs.rsc.org Edinburgh Instruments’ RamanQA uses correlation and multivariate distance measures against user-defined tolerance libraries for automated decisions. The Raman Imaging Systems for Industrial Analysis Market is consequently seeing software become a more important point of product differentiation.
Restraints Impact Analysis of Raman Imaging Systems For Industrial Analysis Market*
| Restraint | (~) % Impact on CAGR Forecast | Geographic Relevance | Impact Timeline |
|---|---|---|---|
| High Capital Cost of Research-Grade Raman Imaging Platforms | -1.5% | Global, most acute in emerging markets and among small and mid-sized industrial buyers | Medium term (2-4 years) |
| Shortage of Raman Imaging and Chemometrics Specialists | -1.0% | Global, acute in the Middle East and Africa, South America, and Southeast Asia | Long term (≥ 4 years) |
| Fluorescence Interference and Sample-Preparation Limitations | -0.8% | Global | Short term (≤ 2 years) |
| Limited Standardization of Industrial Spectral Libraries and Validation Protocols | -0.6% | Global | Medium term (2-4 years) |
| Source: Mordor Intelligence | |||
High Capital Cost of Research-Grade Raman Imaging Platforms
Research-grade confocal Raman imaging systems can exceed the capital budgets of smaller manufacturers without dedicated laboratory operations. Total cost also includes qualification, method development, and chemometric model validation before production decisions can be made. The supplied research identified a 12-18-month specialist commitment for these preparation activities. This cost structure concentrates early adoption among large pharmaceutical, semiconductor, and tier-1 automotive manufacturers. Metrohm’s i-Raman NxG and i-Raman Duo support routine quality workflows, but they do not provide the two-dimensional imaging capability of full confocal platforms. The Raman Imaging Systems for Industrial Analysis Market thus retains a premium imaging tier and a lower-revenue portable instrument tier.
Shortage of Raman Imaging and Chemometrics Specialists
Chemically meaningful Raman maps require spectral preprocessing, baseline correction, multivariate analysis, and application knowledge. The available pool of industrial specialists with Raman-specific experience is limited relative to demand from semiconductor, battery, and pharmaceutical users. Training programs remain concentrated in North America, Germany, and Japan, leaving some high-growth regions with less local support. Automation can simplify routine tasks, but difficult samples still require expert judgment. Carbon-black-filled polymers, highly fluorescent composites, and thermally sensitive excipients remain challenging materials. The Raman Imaging Systems for Industrial Analysis Market benefits when vendors provide application support and training alongside instruments, reducing deployment barriers and strengthening ongoing customer relationships.
*Our forecasts treat driver/restraint impacts as directional, not additive. The impact forecasts reflect baseline growth, mix effects, and variable interactions.
Raman Imaging Systems For Industrial Analysis Market Segment Analysis
By Technology:
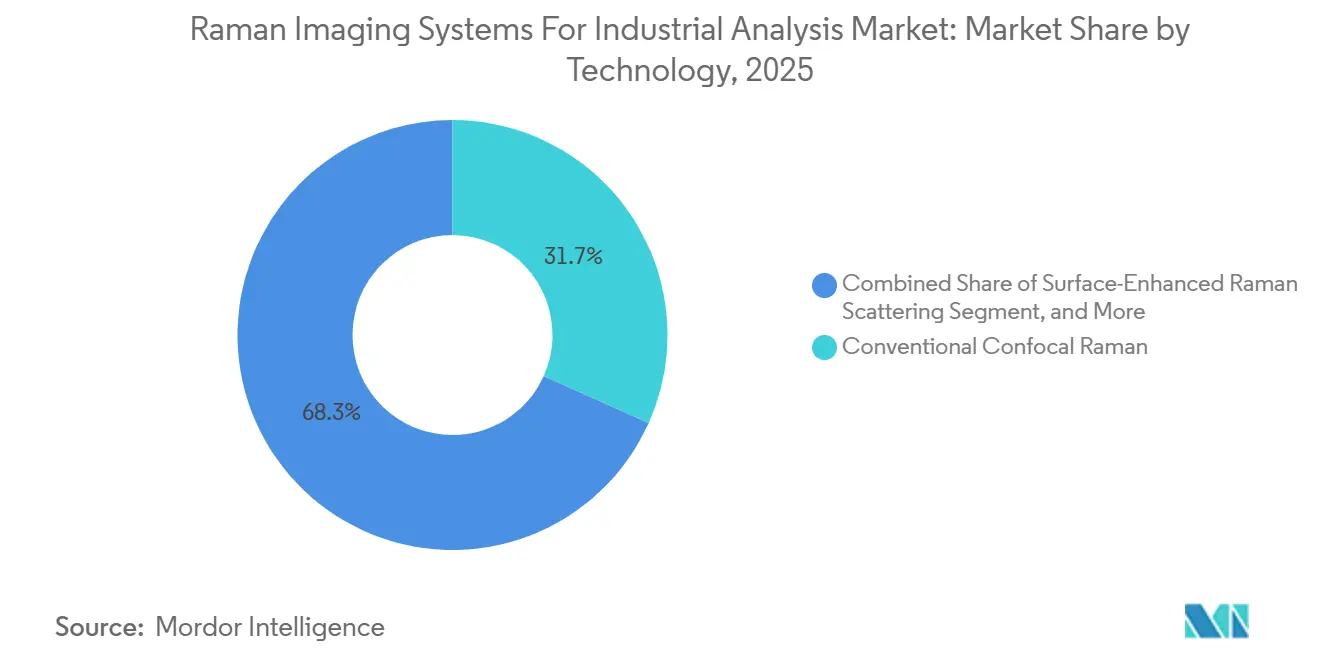
SERS Extends Detection Sensitivity into Trace-Level Industrial ApplicationsConventional confocal Raman imaging held 31.71% of technology revenue in 2025. Its position reflects established spectral libraries for crystalline silicon, gallium nitride, silicon carbide, polymers, and pharmaceutical active ingredients. These libraries can reduce implementation time for organizations adopting established workflows. SERS is forecast to grow at 13.84% CAGR from 2026 to 2031. Advances in substrate reproducibility are supporting industrial screening uses, including trace-contaminant and process-residue detection. A 2025 study described flexible SERS substrates designed for stable, scalable detection applications. This sensitivity can support pharmaceutical raw-material verification and food-packaging authenticity checks. Technology choices in the Raman Imaging Systems for Industrial Analysis Market still favor conventional confocal systems, where established library coverage and imaging performance remain important.
TERS, stimulated Raman scattering, coherent anti-Stokes Raman scattering, resonance Raman, and hybrid systems address specialized requirements for resolution and throughput. Operando TERS resolved battery grain-boundary behavior in the 2025 study, demonstrating its relevance to advanced electrochemical research. Hybrid and correlative platforms combine Raman with atomic force microscopy, scanning electron microscopy, or photoluminescence. These systems can reduce the number of handling steps when structural and chemical observations are required from the same location. HORIBA launched SignatureSPM™ in March 2025 with automated atomic force microscopy and simultaneous Raman and photoluminescence measurement.[4]HORIBA Ltd. “Fujifilm and HORIBA Co-develop High-Sensitivity Inline Raman Measurement System for Real-Time Monitoring of Cell Culture and Purification in Biopharmaceutical Manufacturing.” HORIBA, June 16, 2026. horiba.com The system targeted materials science, semiconductor, and life-science workflows. It also shortened setup time for simultaneous colocalized measurements to under 5 minutes. These specialized systems remain relevant where standard confocal imaging cannot provide sufficient nanoscale or correlated data.



By System Configuration:
In-Line Systems Propel Continuous Manufacturing UptakeBenchtop and desktop systems accounted for 42.63% of configuration revenue in 2025. Their lead is supported by high spatial resolution and compatibility with controlled environments such as cryogenic stages, heating cells, and atmospheric enclosures. These capabilities support materials development and detailed failure analysis. Oxford Instruments launched the witec360 Raman microscope in September 2025 with a Hexalight spectrometer and optical throughput from 350 nm to 1,100 nm. The system offered 6-position harmonic-drive grating selection in 300 mm and 600 mm focal-length configurations. In-line and process systems are forecast to grow at 14.73% CAGR through 2031. Their growth depends on fiber-optic probes that can operate in reactors and continuous processing lines. This configuration shift expands the Raman Imaging Systems for Industrial Analysis Market into routine production measurement. USP <858> and ASTM E1840-96 are relevant performance frameworks for process and portable configurations.
The Raman Imaging Systems for Industrial Analysis Market is gaining traction from production cases that link measurement capability to yield performance. FUJIFILM Corporation and HORIBA Ltd. announced an in-line Raman system in June 2026 for real-time monitoring of cell culture and purification in biopharmaceutical manufacturing. In antibody-purification trials, the system delivered a 10% yield improvement over UV-Vis-based control. It differentiated intact antibodies from aggregates and fragments in real time. Portable and handheld systems remain useful for field inspection and receiving-dock verification. Fiber-coupled and remote configurations are suited to confined or hazardous environments in chemical plants and refineries. Configuration selection, therefore, depends on the required measurement location, resolution, and degree of process integration. Suppliers can serve more use cases by offering compatible laboratory and process systems.
By Analysis Type:
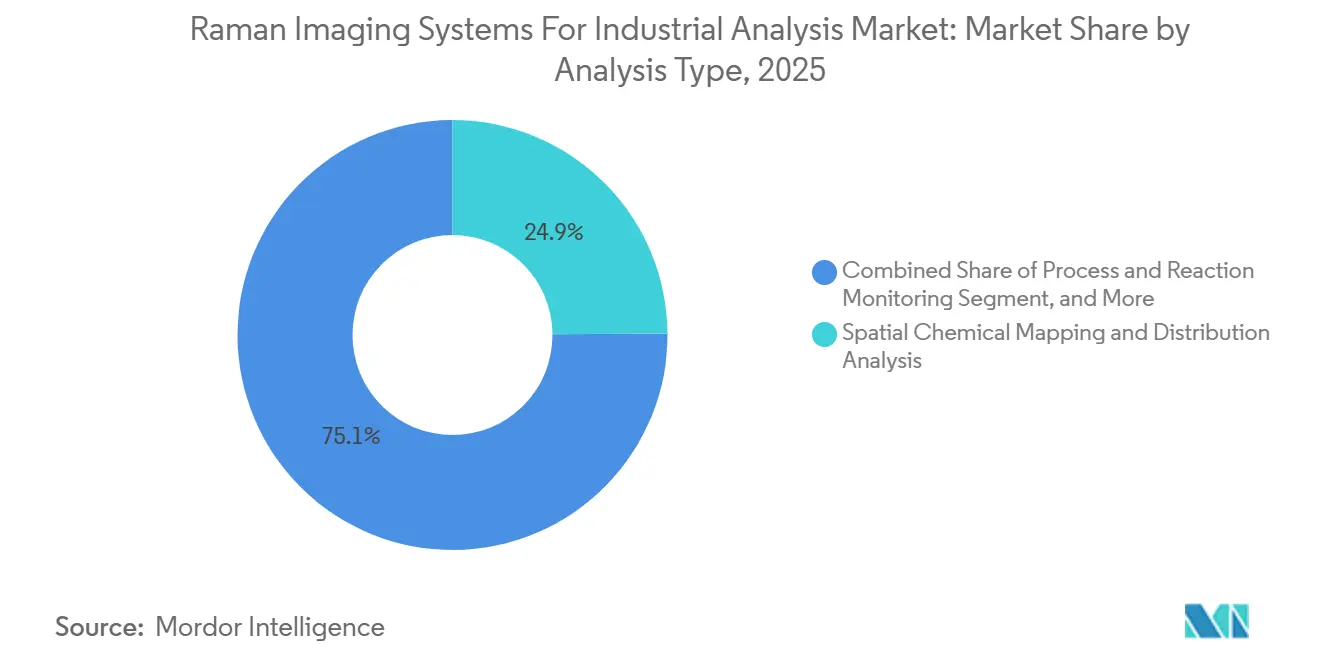
Mapping Applications Anchor Revenue While Process Monitoring AcceleratesSpatial chemical mapping and distribution analysis represented 24.89% of analysis-type revenue in 2025. It is used for pharmaceutical content uniformity, polymer-blend homogeneity, coating composition, and semiconductor dopant-distribution work. The application combines chemical identification with location-specific information. A 2025 study reported R² values of 0.98 for active pharmaceutical ingredient quantification using transmission low-frequency Raman methods validated against USP guidelines. This performance supports use by buyers who need documented evidence of quality. Process and reaction monitoring is forecast to grow at 14.52% CAGR through 2031. It is relevant in pharmaceutical, fine-chemical, and battery-electrode production, where delayed offline sampling can contribute to yield variation and waste. The Raman Imaging Systems for Industrial Analysis Market has room to expand as producers shift toward continuous manufacturing.
Material identification and authentication, composition and quantification, and defect and contamination analysis form a broad set of cross-sector applications. Structural, phase, and crystallinity analysis is important in silicon carbide and gallium nitride wafer quality control. Polytype identification can influence device reliability in these materials. Stress and strain analysis is also being used for additive manufacturing qualification. Confocal depth profiling can map residual stress in laser powder-bed-fused parts without destructive sectioning. Machine learning applied to SERS data supports multi-analyte identification in a single measurement. This can replace sequential single-analyte runs in suitable workflows. Analysis categories overlap in practice because one instrument may support identity, mapping, and process-monitoring tasks. The Raman Imaging Systems for Industrial Analysis Market benefits when users adopt instruments across several quality-control functions.
By End-User Industry:
Battery Demand Redefines the Adoption TrajectoryManufacturing and industrial enterprises held 27.41% of end-user revenue in 2025. The group includes metals inspection, plastics compounding, composites quality assurance, surface coatings, and advanced ceramics. Its range of applications provides a stable demand base across different production settings. Battery and energy storage manufacturers are forecast to grow at a 14.31% CAGR from 2026 to 2031. Operando Raman is becoming more relevant as cell designs, material combinations, and energy-density requirements become more demanding. Battery facilities can need benchtop instruments for incoming materials and in-line probes for electrode-coating monitoring. The Raman Imaging Systems for Industrial Analysis Market can therefore gain more revenue per battery facility as customers use multiple system configurations. This adoption pattern differs from isolated laboratory purchases by linking equipment demand to several stages of manufacturing.
Pharmaceutical and biotechnology companies use Raman for identity confirmation, polymorphism monitoring, and real-time release testing. Endress+Hauser’s 2026 material on Raman in good manufacturing practice environments identifies these process and quality-control applications. Requirements under 21 CFR Parts 210 and 211 and EU GMP Annex 15 support recurring demand for method validation and instrument requalification. Semiconductor and electronics manufacturers use Raman imaging for sub-micron defect mapping in wide-bandgap materials. Chemical, polymer, and advanced-materials producers use the technique for recycled-content verification under EU ecodesign requirements. Food and beverage companies can use portable SERS systems for adulteration screening. Academic and research institutes, as well as government laboratories, remain important users of advanced modalities that require specialist expertise. This broad user base gives the Raman Imaging Systems for Industrial Analysis industry exposure to regulated and research-intensive applications.
Geography Analysis
APAC Raman Imaging Systems for Industrial Analysis Market
Asia-Pacific held 38.63% of the Raman Imaging Systems for Industrial Analysis Market share in 2025. The region has concentrated semiconductor fabrication, major battery gigafactory investment, and pharmaceutical active-ingredient manufacturing in India and China. South Korea’s semiconductor investment cycle supports demand for wafer-level Raman stress mapping as fabrication technologies develop. China has domestic suppliers such as Zolix Instruments and Angstrom Advanced at the benchtop tier. Japan’s precision-manufacturing base supports demand for high-resolution imaging systems. India can add medium-term demand to the Raman Imaging Systems for Industrial Analysis Market as Production Linked Incentive programs support pharmaceutical active ingredient production and advanced chemistry cell output.
The Americas and Europe Raman Imaging Systems for Industrial Analysis Market
North America and Europe are mature, high-value regions with pharmaceutical and semiconductor customer bases. Quality requirements and established distribution networks support sales of high-capital analytical instruments. FDA process analytical technology guidance and 21 CFR Parts 210 and 211 support recurring demand for method validation and instrument requalification. Cambridge Raman Imaging received a EUR 400,000 European Innovation Council Transition grant in July 2026 to scale AI-augmented Raman imaging for pharmaceutical quality control. South America, led by pharmaceutical and food and beverage activity in Brazil, faces infrastructure constraints and a limited pool of local chemometrics specialists.
MEA Raman Imaging Systems for Industrial Analysis Market
The Middle East is forecast to grow at 13.96% CAGR from 2026 to 2031. The supplied research links regional demand with Saudi Arabia’s SFDA alignment with ISO 17025 and petrochemical quality-control investment in Jubail and Yanbu. HORIBA agreed to acquire FANDA Scientific Equipment Trading LLC and to establish HORIBA Middle East Limited in Abu Dhabi in 2026. These actions strengthen local availability and service response. Africa remains a smaller market concentrated in South Africa’s mining sector for mineral-phase identification and ore characterization.

Competitive Landscape
The Raman Imaging Systems for Industrial Analysis Market is fragmented into high-performance imaging. HORIBA, Renishaw, and Oxford Instruments differentiate through scanning and focus-control capabilities, including HORIBA’s QScan™ and SWIFT™ imaging, Renishaw’s inVia platform with LiveTrack™ focus maintenance, and Oxford Instruments’ TrueSurface™ capability. A more fragmented group of modular spectrometers and original-equipment-manufacturer component suppliers serves the portable and process-system tiers. Competition is moving beyond hardware specifications toward AI-driven automation, validated spectral libraries, and connected calibration services.
Validated cross-platform spectral libraries remain limited in many industrial applications. This can restrict the transferability of the calibration model between manufacturers and reinforce vendor dependence. In-line Raman probes for roll-to-roll battery-electrode coating geometries and portable SERS platforms for recycled-polymer verification remain underserved product areas in the supplied research. Cambridge Raman Imaging is developing a multimodal Raman and AI platform for pharmaceutical quality control at production-line speeds. Such offerings can broaden the Raman Imaging Systems for Industrial Analysis Market beyond established instrument suppliers by leveraging focused software capabilities.
Geographic reach is also becoming a competitive factor in the Raman Imaging Systems for Industrial Analysis Market. Lightnovo announced a distribution partnership in China for its miniRaman™ and RG Spectrometer solutions in 2025. HORIBA established a direct presence in the Middle East in February 2026 and agreed to acquire its distributor in the UAE and Oman, FANDA, in June 2026. Oxford Instruments and Covalent also aligned WITec360™ capabilities with compound-semiconductor wafer characterization during June 2026. These moves show that sales coverage, local applications support, and direct service are becoming important alongside instrument performance.
Raman Imaging Systems For Industrial Analysis Industry Leaders
HORIBA, Ltd.
Renishaw plc
Bruker Corporation
WITec Wissenschaftliche Instrumente und Technologie GmbH
JASCO Corporation
- *Disclaimer: Major Players sorted in no particular order
Raman Imaging Systems For Industrial Analysis Market Companies Covered in this Report
- HORIBA, Ltd.
- Renishaw plc
- WITec Wissenschaftliche Instrumente und Technologie GmbH
- Bruker Corporation
- JASCO Corporation
- Nanophoton Corporation
- Tokyo Instruments, Inc.
- Tornado Spectral Systems Inc.
- Wasatch Photonics, Inc.
- Kaiser Optical Systems, Inc.
- BandW Tek, LLC
- BaySpec, Inc.
- SciAps, Inc.
- Edinburgh Instruments Ltd.
- NANOBASE, Inc.
- Angstrom Advanced Inc.
- Ocean Insight, Inc.
- StellarNet, Inc.
- Zolix Instruments Co., Ltd.
- Lightnovo ApS
- RamanLife
- SandI Spectroscopy and Imaging GmbH
- Photon Systems, Inc.
- Enhanced Spectrometry, Inc.
- Real Time Analyzers, Inc.

Recent Industry Developments in Raman Imaging Systems For Industrial Analysis Market
- July 2026: Cambridge Raman Imaging received a EUR 400,000 European Innovation Council Transition grant to scale its multimodal Raman and AI platform for pharmaceutical quality control, signed a distribution agreement with Hooke Instruments for China market entry, and advanced pilot discussions with 2 leading pharmaceutical groups for its production-line QC system.
- June 2026: FUJIFILM Corporation and HORIBA Ltd. co-developed a high-sensitivity inline Raman measurement system for continuous, real-time monitoring of cell culture and purification in biopharmaceutical manufacturing. In antibody drug purification trials, the system delivered 10% yield improvement over UV-Vis-based process control by discriminating intact antibodies from aggregates and fragments in real time.
- June 2026: Covalent announced a strategic collaboration with Oxford Instruments, incorporating WITec360™ Raman technology with dual 355 nm and 532 nm laser excitation into wafer-level characterization workflows for defectivity mapping, stress and strain analysis, and failure analysis for compound semiconductors and advanced materials on wafers up to 300 mm, with the stated aim of bridging research and development-grade characterization and high-volume manufacturing qualification.
- September 2025: Oxford Instruments launched the witec360 Raman microscope with the Hexalight spectrometer, offering optical throughput from 350 nm to 1,100 nm and 6-position harmonic-drive grating selection in 300 mm and 600 mm focal-length configurations. The system succeeded the alpha300 series with improved light transmission and automation.


Global Raman Imaging Systems For Industrial Analysis Market Report Scope
The Raman Imaging Systems For Industrial Analysis Market refers to non-destructive analytical instruments that use laser-based Raman scattering to create spatially resolved chemical maps of materials. Available in benchtop, portable, or in-line configurations, these systems utilize various enhanced Raman technologies to perform material identification, contamination analysis, and stress mapping. They are essential across the pharmaceutical, semiconductor, battery manufacturing, and chemical industries for real-time process monitoring, quality control, and advanced materials research.
The Raman Imaging Systems for Industrial Analysis Market Report is Segmented by Technology (Conventional Confocal Raman, Surface-Enhanced Raman Scattering (SERS), Tip-Enhanced Raman Scattering (TERS), Stimulated Raman Scattering (SRS), Coherent Anti-Stokes Raman Scattering (CARS), Resonance Raman Imaging, and Hybrid and Correlative Raman Imaging), System Configuration (Benchtop and Desktop Systems, Portable and Handheld Systems, In-Line and Process Systems, and Fiber-Coupled and Remote Systems), Analysis Type (Material Identification and Authentication, Chemical Composition and Quantification, Defect, Contamination and Failure Analysis, Structural, Phase and Crystallinity Analysis, Stress and Strain Analysis, Spatial Chemical Mapping and Distribution Analysis, and Process and Reaction Monitoring), End-User Industry (Manufacturing and Industrial Enterprises, Pharmaceutical and Biotechnology Companies, Semiconductor and Electronics Manufacturers, Battery and Energy-Storage Manufacturers, Chemical, Polymer and Advanced-Materials Producers, Food and Beverage Companies, Academic and Research Institutes, Government and Regulatory Laboratories, and Other End-User Industries), and Geography (North America, South America, Europe, Asia-Pacific, and Middle East and Africa). The Market Forecasts are Provided in Terms of Value (USD).
| Conventional Confocal Raman |
| Surface-Enhanced Raman Scattering (SERS) |
| Tip-Enhanced Raman Scattering (TERS) |
| Stimulated Raman Scattering (SRS) |
| Coherent Anti-Stokes Raman Scattering (CARS) |
| Resonance Raman Imaging |
| Hybrid and Correlative Raman Imaging |
| Benchtop and Desktop Systems |
| Portable and Handheld Systems |
| In-Line and Process Systems |
| Fiber-Coupled and Remote Systems |
| Material Identification and Authentication |
| Chemical Composition and Quantification |
| Defect, Contamination and Failure Analysis |
| Structural, Phase and Crystallinity Analysis |
| Stress and Strain Analysis |
| Spatial Chemical Mapping and Distribution Analysis |
| Process and Reaction Monitoring |
| Manufacturing and Industrial Enterprises |
| Pharmaceutical and Biotechnology Companies |
| Semiconductor and Electronics Manufacturers |
| Battery and Energy-Storage Manufacturers |
| Chemical, Polymer and Advanced-Materials Producers |
| Food and Beverage Companies |
| Academic and Research Institutes |
| Government and Regulatory Laboratories |
| Other End-User Industries |
| North America | United States | |
| Canada | ||
| Mexico | ||
| South America | Brazil | |
| Argentina | ||
| Rest of South America | ||
| Europe | Germany | |
| United Kingdom | ||
| France | ||
| Italy | ||
| Spain | ||
| Rest of Europe | ||
| Asia-Pacific | China | |
| Japan | ||
| India | ||
| South Korea | ||
| Rest of Asia-Pacific | ||
| Middle East and Africa | Middle East | Saudi Arabia |
| United Arab Emirates | ||
| Turkey | ||
| Rest of the Middle East | ||
| Africa | South Africa | |
| Nigeria | ||
| Rest of Africa | ||
| By Technology | Conventional Confocal Raman | ||
| Surface-Enhanced Raman Scattering (SERS) | |||
| Tip-Enhanced Raman Scattering (TERS) | |||
| Stimulated Raman Scattering (SRS) | |||
| Coherent Anti-Stokes Raman Scattering (CARS) | |||
| Resonance Raman Imaging | |||
| Hybrid and Correlative Raman Imaging | |||
| By System Configuration | Benchtop and Desktop Systems | ||
| Portable and Handheld Systems | |||
| In-Line and Process Systems | |||
| Fiber-Coupled and Remote Systems | |||
| By Analysis Type | Material Identification and Authentication | ||
| Chemical Composition and Quantification | |||
| Defect, Contamination and Failure Analysis | |||
| Structural, Phase and Crystallinity Analysis | |||
| Stress and Strain Analysis | |||
| Spatial Chemical Mapping and Distribution Analysis | |||
| Process and Reaction Monitoring | |||
| By End-User Industry | Manufacturing and Industrial Enterprises | ||
| Pharmaceutical and Biotechnology Companies | |||
| Semiconductor and Electronics Manufacturers | |||
| Battery and Energy-Storage Manufacturers | |||
| Chemical, Polymer and Advanced-Materials Producers | |||
| Food and Beverage Companies | |||
| Academic and Research Institutes | |||
| Government and Regulatory Laboratories | |||
| Other End-User Industries | |||
| By Geography | North America | United States | |
| Canada | |||
| Mexico | |||
| South America | Brazil | ||
| Argentina | |||
| Rest of South America | |||
| Europe | Germany | ||
| United Kingdom | |||
| France | |||
| Italy | |||
| Spain | |||
| Rest of Europe | |||
| Asia-Pacific | China | ||
| Japan | |||
| India | |||
| South Korea | |||
| Rest of Asia-Pacific | |||
| Middle East and Africa | Middle East | Saudi Arabia | |
| United Arab Emirates | |||
| Turkey | |||
| Rest of the Middle East | |||
| Africa | South Africa | ||
| Nigeria | |||
| Rest of Africa | |||


Key Questions Answered in the Report
What is the Raman Imaging Systems for Industrial Analysis Market size?
The Raman Imaging Systems for Industrial Analysis Market is estimated at USD 504.45 million in 2026 and is forecast to reach USD 880.80 million by 2031, at an 11.79% CAGR.
Which technology is growing fastest in industrial Raman imaging?
SERS is forecast to grow at a 13.84% CAGR from 2026 to 2031, supported by advances in substrate reproducibility and trace-level detection applications.
Which system configuration leads industrial Raman imaging revenue?
Benchtop and desktop systems accounted for 42.63% of configuration revenue in 2025, while in-line and process systems are the fastest-growing configuration at 14.73% CAGR.
Why are battery manufacturers adopting Raman imaging systems?
Operando Raman can monitor lithium-ion intercalation, solid electrolyte interphase evolution, and phase changes during live cycling without puncturing a cell.
Which region leads demand for Raman imaging in industrial analysis?
Asia-Pacific held 38.63% of revenue in 2025, supported by semiconductor fabrication, battery manufacturing, and pharmaceutical production.
What limits wider use of Raman imaging systems?
High research-grade system costs and a shortage of Raman imaging and chemometrics specialists remain important adoption constraints.
Page last updated on:





