
RAG Evaluation Platforms Market Size and Share
Market Overview
| Study Period | 2020 - 2031 |
|---|---|
| Market Size (2026) | USD 30.81 Billion |
| Market Size (2031) | USD 83.21 Billion |
| Growth Rate (2026 - 2031) | 21.98 % |
| Fastest Growing Market | Asia-Pacific |
| Largest Market | North America |
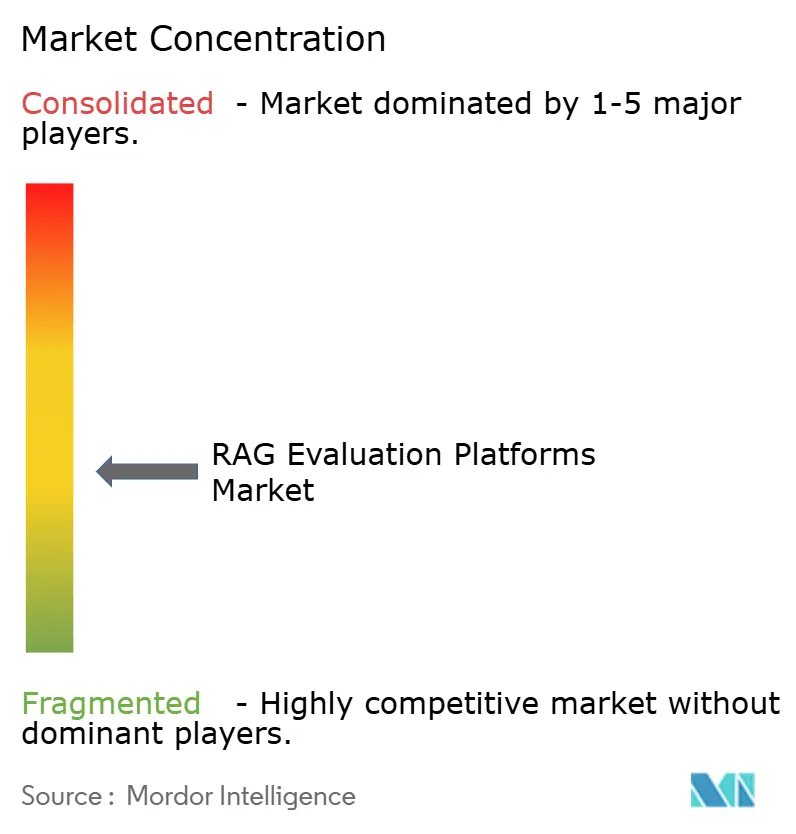
| Market Concentration | Medium |
Major Players *Disclaimer: Major Players sorted in no particular order Image © Mordor Intelligence. Reuse requires attribution under CC BY 4.0. | |
RAG Evaluation Platforms Market Analysis by Mordor Intelligence
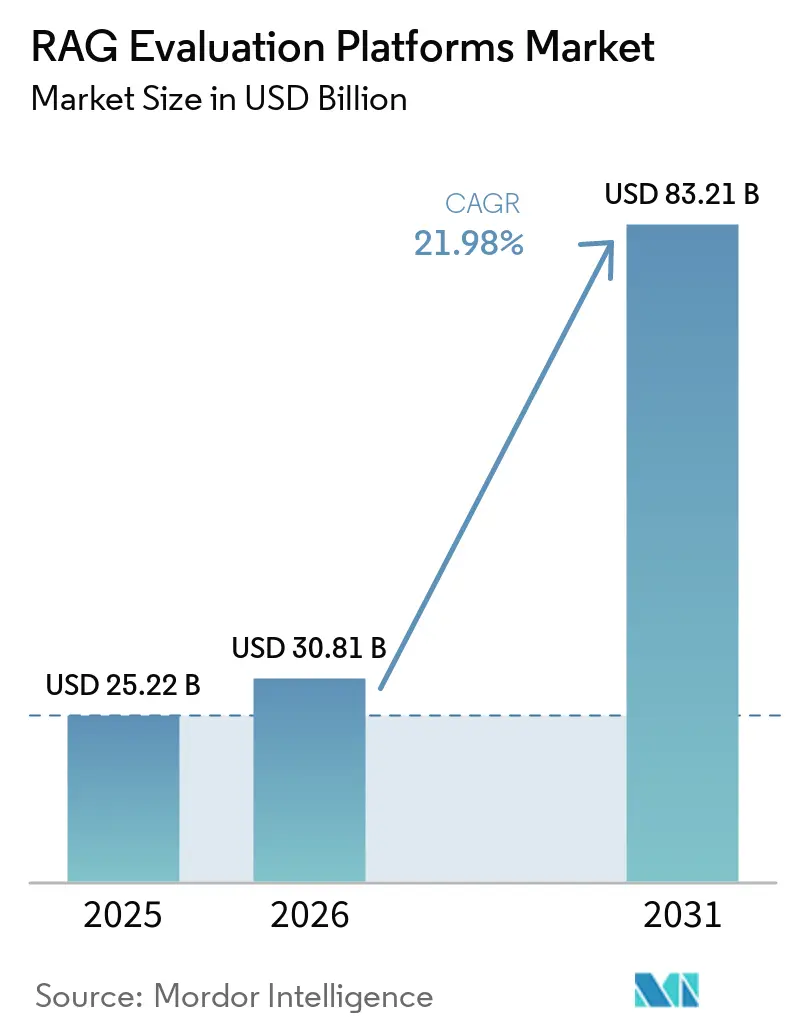
The RAG evaluation platforms market size is projected to expand from USD 25.22 billion in 2025 and USD 30.81 billion in 2026 to USD 83.21 billion by 2031, registering a CAGR of 21.98% between 2026 to 2031. Enterprise use of retrieval-augmented generation is moving beyond controlled trials, so buyers need repeatable ways to test retrieval, source grounding, and answer quality before a system reaches users. RAG evaluation platforms market demand also reflects a shift toward continuous monitoring because retrieval results, prompts, and model behaviour can change after deployment. Regulatory expectations for traceability give procurement teams another reason to preserve auditable records of system performance. Native tools from cloud providers widen access to structured evaluation, while specialized providers compete through deeper agent analysis and domain-calibrated scoring. The strongest opportunities remain in clinical, legal, and financial workflows, where generic evaluation measures are less reliable, and the cost of an unsupported response is high.
Key Report Takeaways
- By component, software held 69.82% of the RAG evaluation platforms market share in 2025, while services are forecast to grow at a 22.73% CAGR through 2031.
- By deployment mode, cloud held 57.28% of the RAG evaluation platforms market share in 2025. The cloud segment is also expected to grow at the fastest rate at a 22.76% CAGR through 2031.
- By evaluation function, retrieval quality accounted for 35.18% share in the RAG evaluation platforms market in 2025, while safety, security, and responsible AI evaluation is forecast to grow at a 22.91% CAGR through 2031.
- By end user, BFSI held 27.93% share in the RAG evaluation platforms market in 2025, while healthcare and life sciences are forecast to grow at a 22.82% CAGR through 2031.
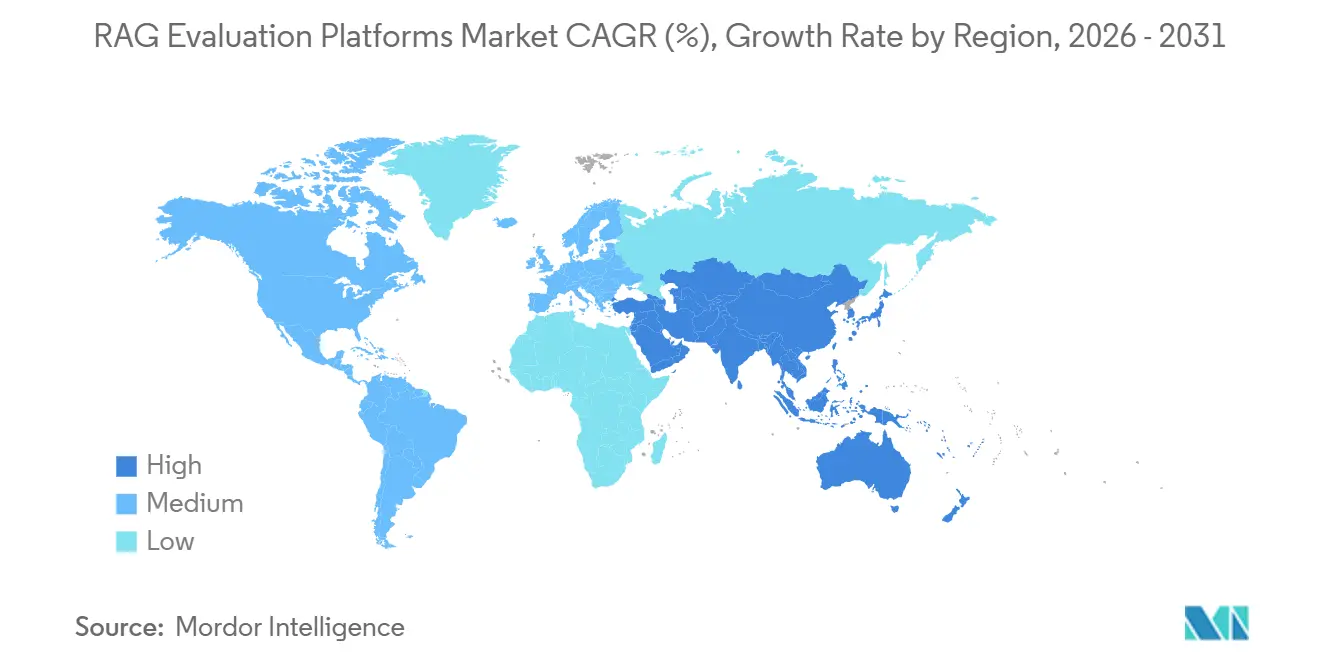
- By geography, North America held 48.27% share in the RAG evaluation platforms market in 2025, while Asia-Pacific is forecast to grow at a 22.63% CAGR through 2031.
Note: Market size and forecast figures in this report are generated using Mordor Intelligence’s proprietary estimation framework, updated with the latest available data and insights as of January 2026.
Market Trends and Insights
Drivers Impact Analysis of RAG Evaluation Platforms Market*
| Driver | (~) % Impact on CAGR Forecast | Geographic Relevance | Impact Timeline |
|---|---|---|---|
| Enterprise GenAI Productionization | +6.0% | Global | Short term (≤ 2 years) |
| Regulatory Demand for Traceable AI Quality Evidence | +4.5% | EU, North America, emerging in Asia-Pacific | Medium term (2-4 years) |
| Expansion of Agentic and Multi-Step RAG Workflows | +3.5% | Global | Medium term (2-4 years) |
| OpenTelemetry Standardization of AI Application Telemetry | +2.5% | Global, with early gains in North America and Europe | Medium term (2-4 years) |
| Rising Cost of Uncaught Retrieval and Grounding Failures | +2.0% | Global | Short term (≤ 2 years) |
| Shift From Offline Benchmarks to Continuous Production Evaluation | +2.0% | Global | Medium term (2-4 years) |
| Source: Mordor Intelligence | |||
Enterprise GenAI Productionization
The move from prototypes into production is a central driver for the RAG evaluation platforms market. Retrieval systems can develop silent failures after launch, including retrieval degradation, embedding drift, prompt regressions, changing source collections, and unexpected variations in live user queries. Teams therefore need continuous checks rather than a single quality review before deployment, especially when models, prompts, retrieval settings, or underlying documents are updated. Evaluation gates in delivery pipelines make each system change subject to defined quality thresholds. This operating model turns evaluation from a one-time implementation activity into a recurring platform requirement. Arize AI secured USD 70 million in Series C financing in February 2025, showing continued investment interest in AI observability and evaluation capabilities.[1]
Regulatory Demand for Traceable AI Quality Evidence
The RAG evaluation platforms market benefits when organizations need documented evidence of how an AI system performed. The EU AI Act creates requirements for record keeping, documentation, and human oversight for high-risk systems.[2] These requirements apply from August 2026 under the Act’s phased timetable. RAG workflows that influence consequential decisions need logs that can show retrieved evidence, evaluation results, system changes, review decisions, and the applicable version of each control. Compliance teams also need evaluation methods that can be explained during internal reviews and external assessments without relying on undocumented model judgments or opaque scoring rules. ISO/IEC 42001 supports this direction by establishing requirements for an AI management system, including governance processes that can support structured evaluation.
Expansion of Agentic and Multi-Step RAG Workflows
Agentic systems make RAG evaluation platforms market needs more demanding because the system may plan, retrieve, revise, and invoke tools across several steps. A final answer can appear credible even when an earlier retrieval or planning decision was unsound. Evaluation must therefore examine intermediate actions, not only the final response, so teams can identify whether failure began in planning, retrieval, tool use, or answer construction. Research presented at ICLR 2026 described the need to assess query decomposition, retrieval planning, and evidence reconciliation in agentic search workflows.[3] These requirements increase the value of trace-level analysis, trajectory scoring, scenario testing, and structured review of the evidence carried between separate agent steps. They also support demand for services, as organizations often need help defining appropriate tests for their workflows.
OpenTelemetry Standardization of AI Application Telemetry
Common telemetry conventions can reduce the effort needed to connect RAG systems with evaluation tools. OpenTelemetry provides vendor-neutral specifications for collecting and exporting telemetry data across applications. Its generative AI semantic conventions give developers a consistent way to capture model, request, and response context. This consistency helps buyers compare tools without rebuilding instrumentation for every platform, and it makes it easier to preserve comparable records as applications evolve. The RAG evaluation platforms market can therefore reach organizations that previously considered integration work too burdensome. It also favours providers that can work with open standards while retaining useful workflow-specific evaluation features for retrieval, generation, safety, and operational review.
Restraints Impact Analysis of RAG Evaluation Platforms Market*
| Restraint | (~) % Impact on CAGR Forecast | Geographic Relevance | Impact Timeline |
|---|---|---|---|
| Evaluator Bias and LLM-as-a-Judge Instability | -1.5% | Global | Medium term (2-4 years) |
| Scarcity of Domain-Specific Ground-Truth Data | -1.2% | Global | Medium term (2-4 years) |
| Evaluation Token Cost and Inference Latency | -0.8% | Global, with a disproportionate effect on small and midsize enterprises | Medium term (2-4 years) |
| Fragmented Instrumentation Across RAG Stacks | -0.5% | Global | Short term (≤ 2 years) |
| Source: Mordor Intelligence | |||
Evaluator Bias and LLM-as-a-Judge Instability
LLM-based judges automate many evaluation tasks, but their reliability remains a restraint for the RAG evaluation platforms market. IBM Research identified 12 bias categories in LLM-based judges, including position bias, verbosity preference, and self-preference.[4] These effects can make a score depend on presentation choices rather than the underlying quality of the answer. Buyers often respond by using multiple judge models, human calibration, or consistency checks. Those safeguards improve confidence but increase cost and operational complexity because teams must maintain reviewer guidance, reconcile conflicting scores, and repeat tests across important scenarios. The issue is especially important in financial services and healthcare, where an evaluation result must withstand closer scrutiny.
Scarcity of Domain-Specific Ground-Truth Data
Reliable evaluation depends on reference questions and verifies answers that reflect real work. Such ground-truth data is difficult to develop for clinical, financial, and legal content because it requires expert review and changes over time. Broad benchmarks can test general performance, but they cannot fully represent an organization’s proprietary documents or decision rules. This limitation slows the adoption of the RAG evaluation platforms market in the applications where evaluation is most important. Japan’s Digital Agency published the lawqa_jp legal question-and-answer dataset in October 2025, illustrating public efforts to improve domain-specific benchmarking. Organizations still need to build and maintain their own datasets for production regression testing because public resources rarely cover internal terminology, confidential documents, or changing policies.
*Our forecasts treat driver/restraint impacts as directional, not additive. The impact forecasts reflect baseline growth, mix effects, and variable interactions.
RAG Evaluation Platforms Market Segment Analysis
By Component:
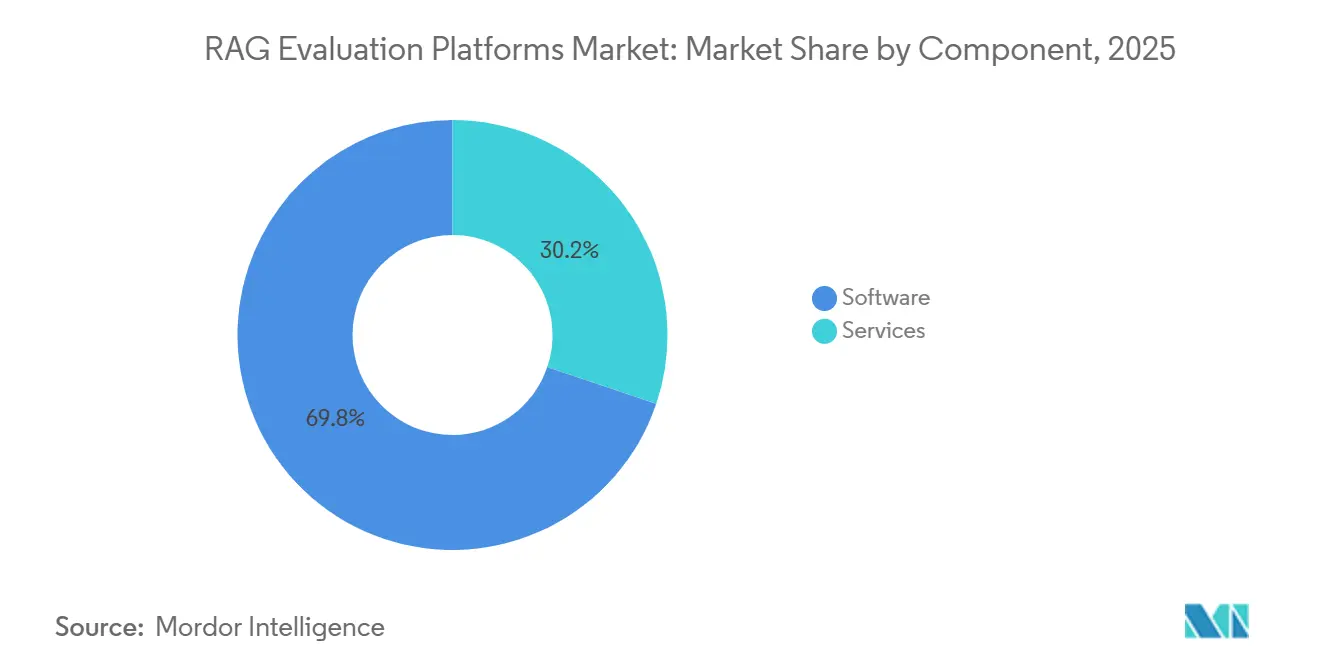
Market Dominance of Software vs. High-Growth Specialized ServicesSoftware held 69.82% of the share in 2025. Enterprises commonly purchase software for scorecards, trace review, experiment management, and deployment controls within a single environment. This model supports recurring licenses and allows teams to standardize evaluation across multiple applications. Software revenue can also include platform functions that support substantial advisory work, including implementation support, metric selection, data preparation, reviewer calibration, and governance documentation. That classification can conceal the amount of specialized configuration required in real deployments.
Services are projected to grow at a 22.73% CAGR through 2031, which is slightly above the overall RAG evaluation platforms market growth rate. Organizations need support to create evaluation datasets, calibrate judges against human reviewers, and integrate controls into software delivery workflows. They also need custom measures for clinical, legal, and financial content. Braintrust provides workflows that help users develop scores and datasets from production traces. Even where automation is available, initial configuration and governance design remain material services requirements.
By Deployment Mode:
Cloud Is Established While Hybrid Supports Sensitive WorkloadsCloud represented 57.28% of the RAG evaluation platforms market size in 2025. It is also the fastest-growing segment, with a CAGR of 22.76% through 2031. Cloud delivery provides organizations with elastic capacity for large trace volumes and eliminates the need to operate evaluation infrastructure internally. It also matches the purchasing model of organizations that already run models and retrieval services in cloud environments. AWS introduced RAG evaluation capabilities for Amazon Bedrock agents in December 2024. Google also made agent and model evaluations generally available for its Gemini Enterprise Agent Platform in 2025.
On-premises deployment remains relevant for government and financial services users who cannot send sensitive documents to external evaluation interfaces. Hybrid models provide another option by keeping retrieved content within enterprise environments while sending selected metadata and scores to dashboards. This design lets organizations balance data residency requirements with central oversight, while allowing security, compliance, and engineering teams to work from a consistent view of performance. Databricks documented an integration that exports Langfuse traces to MLflow through OpenTelemetry endpoints. The RAG evaluation platforms market, therefore, includes deployment choices that reflect both technical scale and data-handling constraints.
By Evaluation Function:
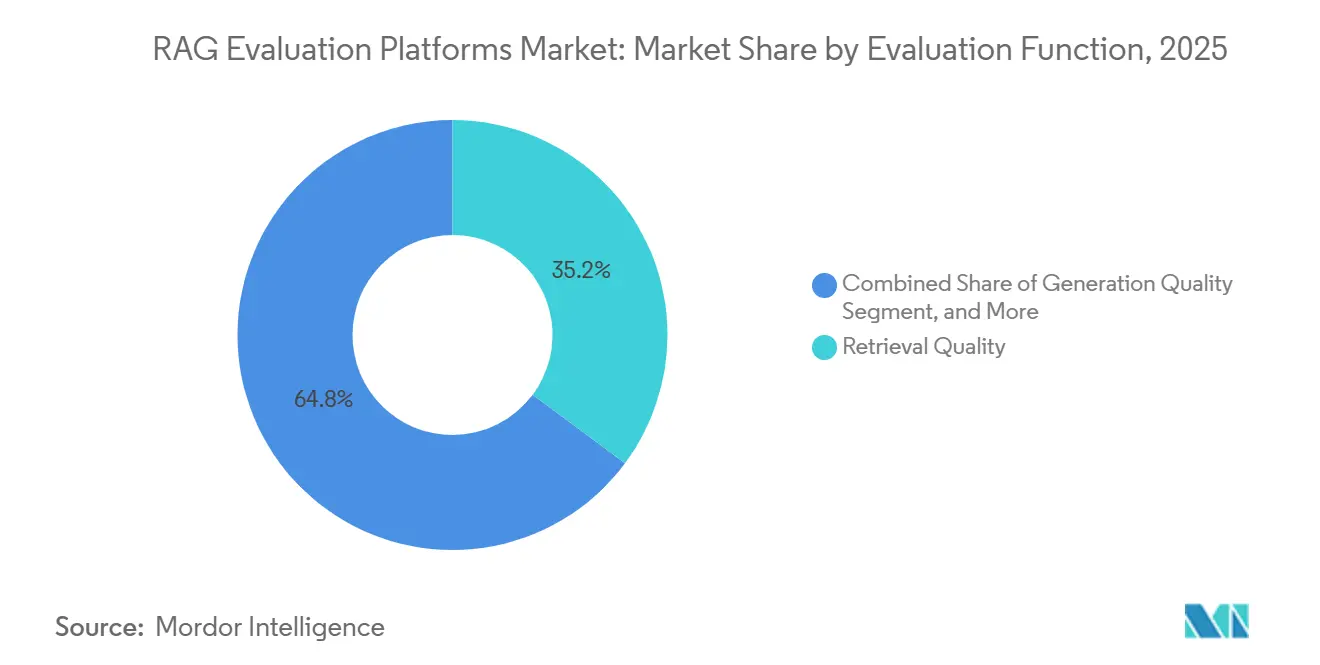
Retrieval Foundations and High-Growth Responsible AI SafeguardsRetrieval quality held 35.18% of share in 2025. Precision, recall, context relevance, and grounding are the base measures for a retrieval-augmented system. A system cannot provide a well-supported answer if it begins from irrelevant or incomplete source material. Buyers commonly start with these measures before introducing more detailed safety or operational tests. This makes retrieval quality the most established evaluation function because it gives teams an early indication of whether the system accessed appropriate evidence before generating an answer.
Safety, security, and responsible AI evaluation is forecast to expand at a 22.91% CAGR through 2031. The function addresses adversarial prompts, unsafe outputs, policy compliance, and reliability risks in agentic workflows. A 2026 review found that context relevance, faithfulness, answer relevance, and citation quality should be assessed together rather than as separate sequential checks. Operational and economic performance evaluation is also becoming more important as users balance quality tests against token costs and latency. These needs widen the functional scope of RAG evaluation platforms market offerings.

By End User:
BFSI Regulatory Footprint and Accelerated Healthcare AdoptionBFSI accounted for 27.93% of the RAG evaluation platforms market size in 2025. Banks and insurers work with dense regulatory material where an incorrect retrieval or unsupported claim can create compliance exposure. Their existing audit practices also make it easier to justify traceable evaluation. Structured testing can review citation grounding, refusal behavior, and consistency before an application serves customers or staff. These conditions make BFSI an early and substantial buyer group because evaluation can be connected to established approval processes, audit records, and risk-management practices.
Healthcare and life sciences are projected to grow at a 22.82% CAGR through 2031. A systematic review published in 2026 found that RAG approaches can reduce hallucinations when they are combined with specialized evaluation measures and human verification. Hospital systems and pharmaceutical organizations need evidence that clinical systems used relevant sources and followed defined controls. IT and telecommunications users apply evaluation to troubleshooting agents and knowledge systems. Retail and e-commerce users also need tests that account for changes in catalog, inventory, and pricing information.
Geography Analysis
North America RAG Evaluation Platforms Market
North America held 48.27% of share in 2025. The region has a large concentration of generative AI adopters, venture-backed specialists, and established MLOps tools. It also includes cloud providers that are embedding evaluation functions in broader AI platforms. Arize AI raised USD 70 million in February 2025 to expand its AI evaluation and observability offering. OpenTelemetry conventions can further reduce integration effort for organizations using several tools. Canada contributes through financial services and public-sector programs that require evidence for AI governance decisions.
Europe and South America RAG Evaluation Platforms Market
Europe is the second-largest regional market, supported by regulatory demand for documented AI controls. The EU AI Act makes traceability, documentation, and oversight more important for high-risk uses from August 2026. Banks, insurers, health agencies, and public bodies must therefore consider how they will demonstrate system behaviour. Germany and France contribute academic evaluation research that can support commercial development. The United Kingdom, Germany, France, Italy, and Spain are important adoption locations. South America is at an earlier stage, with financial services users in Brazil beginning to adopt RAG tools for customer service and internal knowledge work.
APAC and MEA RAG Evaluation Platforms Market
Asia-Pacific is forecast to grow at a 22.63% CAGR through 2031. India’s financial technology sector creates demand for safety testing before new RAG applications reach production. Japan has developed public benchmarking resources for legal content, including the lawqa_jp dataset published in 2025. China’s domestic model ecosystem creates demand for comparison and evaluation across rapidly changing model families. The Middle East is introducing RAG evaluation within national AI programs, especially in the UAE and Saudi Arabia. Africa remains at an earlier stage, with adoption linked to broader digital and cloud infrastructure development.
Competitive Landscape
The RAG evaluation platforms market includes evaluation-focused providers, MLOps vendors, and cloud providers that bundle evaluation functions with larger AI platforms. The structure is highly competitive, and the supplied material does not identify a provider with a dominant revenue share. Arize, Braintrust, Langfuse, and Confident AI compete through specialized evaluation, observability, and testing functions. Databricks and Weights and Biases extend evaluation through broader model development and governance platforms. AWS, Google, and Microsoft can make evaluation a default purchasing path for customers already using their cloud AI services. This mix puts pressure on standalone pricing while expanding the number of organizations exposed to formal evaluation workflows.
Providers increasingly differentiate through agent trajectory analysis, safety testing, and interoperability with open instrumentation standards. Arize launched PXI in June 2026, an AI engineering agent within Phoenix that automates trace interpretation, evaluator creation, and experiment optimization. Microsoft’s open trust stack uses OpenInference, which aligns with open telemetry practices for AI applications. Databricks integrates DeepEval, RAGAS, and Arize Phoenix scorers in MLflow, bringing several measures into a single workflow. These moves show that vendors are competing on workflow depth and integration rather than only on individual metrics.
Domain-specific evaluation remains an important opening because generic faithfulness measures can lose diagnostic value in specialized corpora. Clinical, legal, and financial deployments need judges, datasets, and thresholds that reflect domain rules. Smaller providers such as HoneyHive and Openlayer target configurable evaluation flows for these use cases. Hyperscaler bundling can encourage consolidation as platform functions become standard features of larger AI stacks. Specialists with proprietary evaluation data or close vertical integrations can still retain differentiated positions. The RAG evaluation platforms market supplier set spans specialists, MLOps platforms, and hyperscalers reuslting in low market concentration.
RAG Evaluation Platforms Industry Leaders
-
Microsoft Corporation
-
Amazon Web Services, Inc.
-
Google LLC
-
LangChain, Inc.
-
Arize, Inc.
- *Disclaimer: Major Players sorted in no particular order
RAG Evaluation Platforms Market Companies Covered in this Report
- Arize, Inc.
- LangChain, Inc.
- Databricks, Inc.
- Snowflake Inc.
- Weights & Biases, Inc.
- Braintrust Data, Inc.
- Confident AI, Inc.
- Evidently AI, Inc.
- Langfuse GmbH
- Promptfoo, Inc.
- TruEra, Inc.
- HoneyHive, Inc.
- Openlayer, Inc.
- Helicone, Inc.
- Appen Limited
- Vecta AI, Inc.
- Fiddler AI, Inc.
- DataRobot, Inc.
- Microsoft Corporation
- Amazon Web Services, Inc.
- Google LLC
- IBM Corporation
- NVIDIA Corporation
- Scale AI, Inc.
- Pinecone Systems, Inc.
- Zilliz, Inc.
- Qdrant Solutions GmbH
- Weaviate B.V.
- Redis Ltd.
- Chroma, Inc.
- LlamaIndex, Inc.
Recent Industry Developments in RAG Evaluation Platforms Market
- July 2026: Promptfoo raised USD 18.4 million in a Series A led by Insight Partners, with Andreessen Horowitz participating, to build AI security evaluation and red-teaming infrastructure. The platform reported adoption by more than 100,000 developers and more than 30 Fortune 500 companies, with a focus on continuous evaluation of RAG deployments with sensitive documents and agentic systems.
- June 2026: Arize AI launched PXI, Phoenix Intelligence, at its Observe 2026 conference, an AI engineering agent embedded in Phoenix open source that automates trace interpretation, evaluator creation, prompt optimization, and experiment execution for RAG and agentic workflows. The conference also introduced the Arize AX AI factory framework for self-improving agents, with automated failure detection and root-cause investigation at production scale.
- February 2026: Arize AI released Alyx 2.0, a planning agent for AI engineering that reasons across the AI lifecycle within Arize AX. It performs autonomous trace analysis, breaks down debugging tasks, and integrates with coding tools.
- February 2026: Arize AI secured a USD 70 million Series C led by Adams Street Partners, with participation from Microsoft’s M12 venture fund, Datadog, PagerDuty, Battery Ventures, and TCV. This brought its total funding to more than USD 130 million.
Global RAG Evaluation Platforms Market Report Scope
The RAG Evaluation Platforms Market Report is Segmented by Component (Software and Services), Deployment Mode (Cloud, On-Premises, and Hybrid), Evaluation Function (Retrieval Quality, Generation Quality, Safety, Security, and Responsible AI, and Operational and Economic Performance), End User (Banking, Financial Services, and Insurance, Healthcare and Life Sciences, IT and Telecommunications, Retail and E-Commerce, and Other End Users), and Geography (North America, South America, Europe, Asia-Pacific, Middle East, and Africa). The Market Forecasts are Provided in Terms of Value (USD).
Segmentation Overview
| Software |
| Services |
| Cloud |
| On-Premises |
| Hybrid |
| Retrieval Quality |
| Generation Quality |
| Safety, Security, and Responsible AI |
| Operational and Economic Performance |
| Banking, Financial Services, and Insurance |
| Healthcare and Life Sciences |
| IT and Telecommunications |
| Retail and E-commerce |
| Other End Users |
| North America | United States |
| Canada | |
| Mexico | |
| South America | Brazil |
| Argentina | |
| Rest of South America | |
| Europe | United Kingdom |
| Germany | |
| France | |
| Italy | |
| Spain | |
| Russia | |
| Rest of Europe | |
| Asia-Pacific | China |
| Japan | |
| South Korea | |
| India | |
| Australia | |
| Rest of Asia-Pacific | |
| Middle East | United Arab Emirates |
| Saudi Arabia | |
| Turkey | |
| Rest of Middle East | |
| Africa | South Africa |
| Kenya | |
| Rest of Africa |
| By Component | Software | |
| Services | ||
| By Deployment Mode | Cloud | |
| On-Premises | ||
| Hybrid | ||
| By Evaluation Function | Retrieval Quality | |
| Generation Quality | ||
| Safety, Security, and Responsible AI | ||
| Operational and Economic Performance | ||
| By End User | Banking, Financial Services, and Insurance | |
| Healthcare and Life Sciences | ||
| IT and Telecommunications | ||
| Retail and E-commerce | ||
| Other End Users | ||
| By Geography | North America | United States |
| Canada | ||
| Mexico | ||
| South America | Brazil | |
| Argentina | ||
| Rest of South America | ||
| Europe | United Kingdom | |
| Germany | ||
| France | ||
| Italy | ||
| Spain | ||
| Russia | ||
| Rest of Europe | ||
| Asia-Pacific | China | |
| Japan | ||
| South Korea | ||
| India | ||
| Australia | ||
| Rest of Asia-Pacific | ||
| Middle East | United Arab Emirates | |
| Saudi Arabia | ||
| Turkey | ||
| Rest of Middle East | ||
| Africa | South Africa | |
| Kenya | ||
| Rest of Africa | ||
Key Questions Answered in the Report
How large is the RAG evaluation platforms market?
RAG evaluation platforms market is projected to reach USD 83.21 billion by 2031, from USD 30.81 billion in 2026, at a 21.98% CAGR. The forecast reflects the expanding use of ongoing evaluation as a production requirement rather than an occasional development activity. The demand base includes both platform licenses and specialized deployment work across a growing range of enterprise applications.
What is driving demand for RAG evaluation platforms?
Enterprise systems are moving into production and require continuous tests for retrieval quality, grounding, safety, and performance. Demand also grows when teams need to compare system behavior before and after changes to models, prompts, retrieved content, or delivery configurations. This creates a recurring need for measurement, review, documented quality controls, clear accountability between technical and business teams, and disciplined release management for every material system change.
Which component generates the largest revenue?
Software led with 69.82% share in 2025, while services is expected to grow faster at a 22.73% CAGR through 2031. Services support data preparation, metric design, human-review calibration, workflow integration, and governance documentation for specialized deployments. These needs are particularly relevant where generic quality measures cannot reflect domain requirements, specialist vocabulary, or approved decision processes.
Why do regulated organizations use RAG evaluation tools?
They need auditable records of retrieved evidence, quality tests, and system changes to support governance and compliance reviews. These records help teams show how a system was assessed and whether its controls remained effective as data, models, and user needs changed. They also support review processes for higher consequence uses where errors can affect customers, employees, or public services.
Which end-user sector has the largest adoption base?
BFSI led with a 27.93% share in 2025 because its users work with regulated information and require clear evidence trails. Financial services organizations also need to test citation grounding, refusal behavior, and answer consistency in high-consequence workflows. This gives structured evaluation a clear operational role in risk management, service quality, and internal control processes.
Which region is expanding fastest?
Asia-Pacific is expected to grow at a 22.63% CAGR through 2031, supported by activity in India, Japan, and China. Regional demand reflects financial technology applications, public benchmarking resources, and the need to compare fast-changing domestic model options. The region also includes markets with distinct governance and data-handling requirements that shape platform selection and deployment models.