Market Size of Property and Casualty Insurance Industry
| Study Period | 2020 - 2029 |
| Base Year For Estimation | 2023 |
| Forecast Data Period | 2024 - 2029 |
| Historical Data Period | 2020 - 2022 |
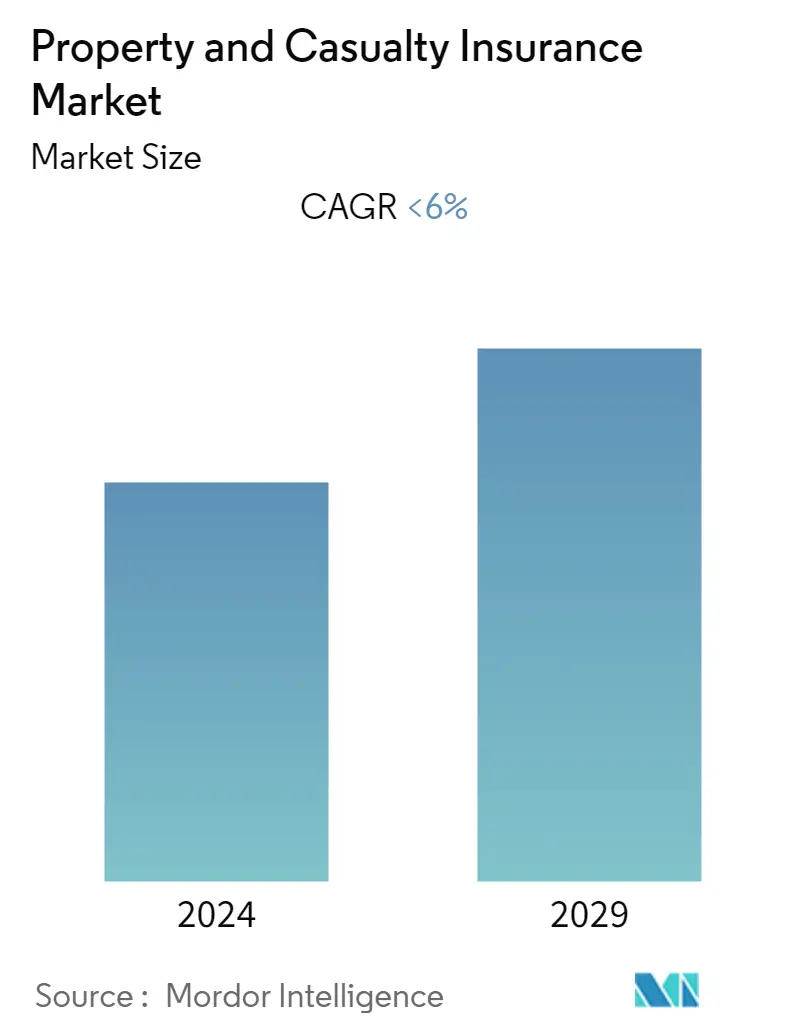
| CAGR | < 6.00 % |
| Market Concentration | Low |
Major Players
*Disclaimer: Major Players sorted in no particular order |
Need a report that reflects how COVID-19 has impacted this market and its growth?
US Property and Casualty Insurance Market Analysis
- The Property and casualty insurance market in the USA is estimated to grow at a CAGR of approximately 6% during the forecast period.
- Nine-months of 2019 delivered solid underwriting gains and brought the industry surplus to a new record. Net written premium growth seems small when compared against the unusually high nine-months 2018 level, but the two-year average growth rate is the strongest in years. The U.S. property and casualty insurance industry saw its net underwriting gains increase to USD 5.4 billion in the first nine months of 2019 from USD 4.7 billion a year earlier. The industry’s surplus grew in every quarter of 2019 so far, reaching a new all-time-high value of USD 812.2 billion as of September 30, 2019, after USD 802.2 billion as of June 30, 2019, and USD 742.1 billion as of December 31, 2018.
- In the first nine months of 2019, earned premiums grew 4.7% to USD 463.2 billion, while LLAE (Losses and loss adjustment expenses) grew 5.5% to USD 327.1 billion; other underwriting expenses grew 2.3% to USD 129.2 billion, and policyholders’ dividends increased to USD 1.6 billion from USD 1.5 billion a year earlier. As a result, the industry reported a USD 5.4 billion net underwriting gain, up from the USD 4.7 billion net underwriting gain for nine-months 2018.
- Net written premiums rose USD 12.8 billion to USD 481.3 billion in nine-months 2019 from USD 468.4 billion in nine-months 2018. Net written premium growth slowed to 2.7% from 11.4% for nine-months 2018. Net earned premium growth was 4.7% in nine-months 2019, slowing from 9.3% for nine-months 2018.
