
PFAS Waste Management, Remediation, and Destruction Market Size and Share
Market Overview
| Study Period | 2021 - 2031 |
|---|---|
| Market Size (2026) | USD 2.58 Billion |
| Market Size (2031) | USD 3.46 Billion |
| Growth Rate (2026 - 2031) | 6.02 % |
| Fastest Growing Market | Asia-Pacific |
| Largest Market | North America |
| Market Concentration | Medium |
Major Players *Disclaimer: Major Players sorted in no particular order Image © Mordor Intelligence. Reuse requires attribution under CC BY 4.0. | |
PFAS Waste Management, Remediation, and Destruction Market Analysis by Mordor Intelligence
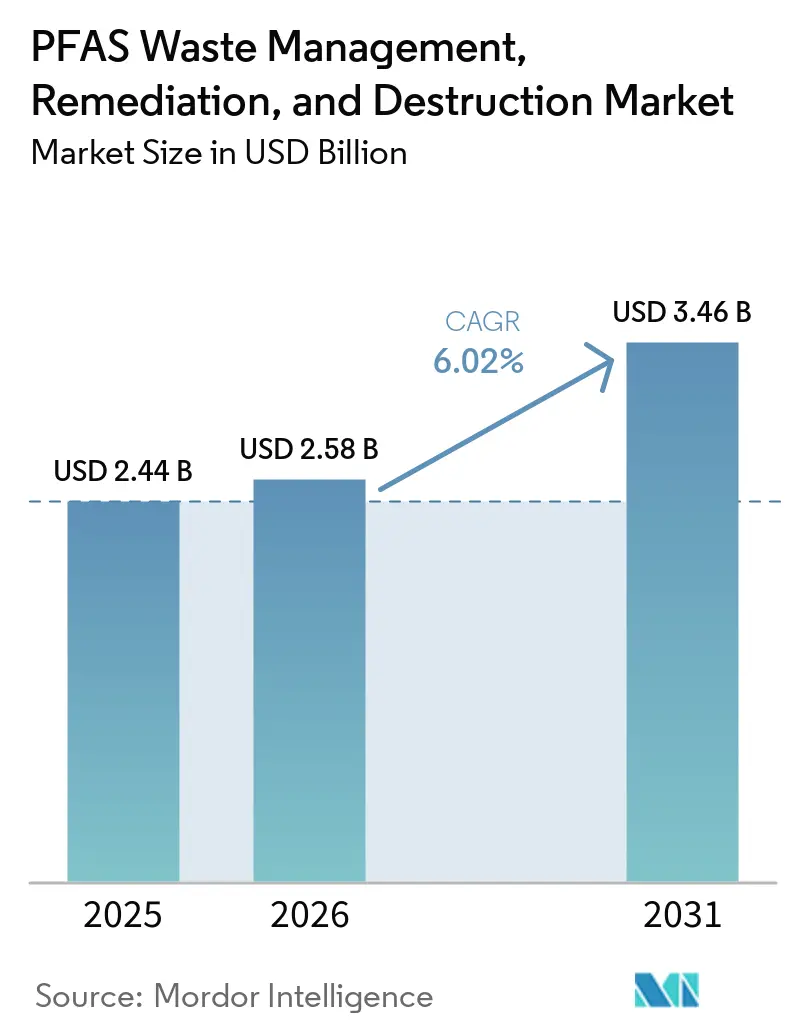
The PFAS waste management, remediation, and destruction market size is estimated at USD 2.44 billion in 2025 and is estimated to grow from USD 2.6 billion in 2026 to USD 3.46 billion by 2031, at a CAGR of 6.02% during the forecast period (2026-2031). The PFAS waste management, remediation, and destruction market is shaped by enforceable drinking-water limits, dedicated public funding, and litigation settlements that direct funds toward cleanup programs. Compliance deadlines place utility and industrial purchasing decisions within defined contract periods, rather than leaving demand dependent on voluntary environmental spending. This timing supports recurring work in monitoring, treatment-media replacement, residuals transport, and final disposal. Integrated providers are better positioned to meet capture-to-destruction requirements, as adsorption processes generate PFAS concentrates that require further treatment. Regulatory revisions, energy costs, and limited commercial validation of newer destruction methods can delay individual projects, although remediation funds and compliance mandates continue to support the long-term pipeline.
Key Report Takeaways
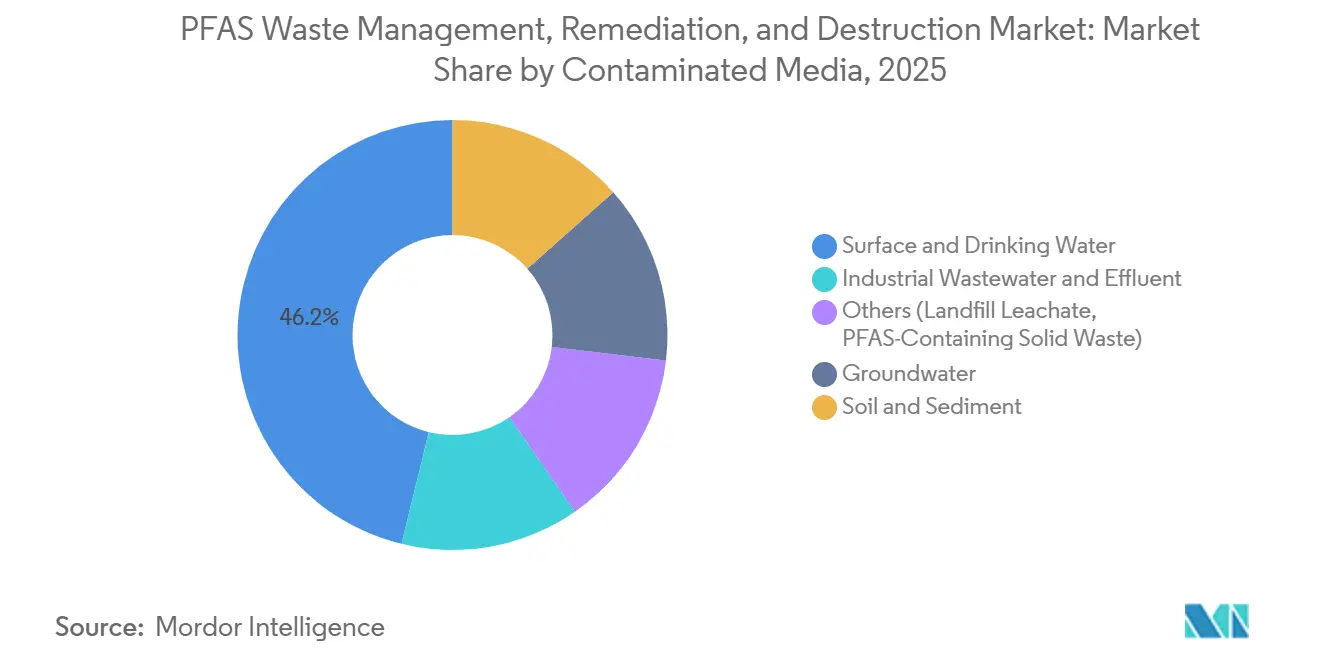
- By contaminated media, surface and drinking water held 46.18% of the PFAS waste management, remediation, and destruction market share in 2025, while industrial wastewater and effluent are forecast to grow at a 7.12% CAGR through 2031.
- By remediation technology, granular activated carbon (GAC) held a 40.24% share in the PFAS waste management, remediation, and destruction market in 2025, while ion exchange resins are projected to expand at a 7.30% CAGR through 2031.
- By destruction technology, high-temperature incineration held a 43.13% share in the PFAS waste management, remediation, and destruction market in 2025, while electrochemical oxidation is projected to grow at a 6.82% CAGR through 2031.
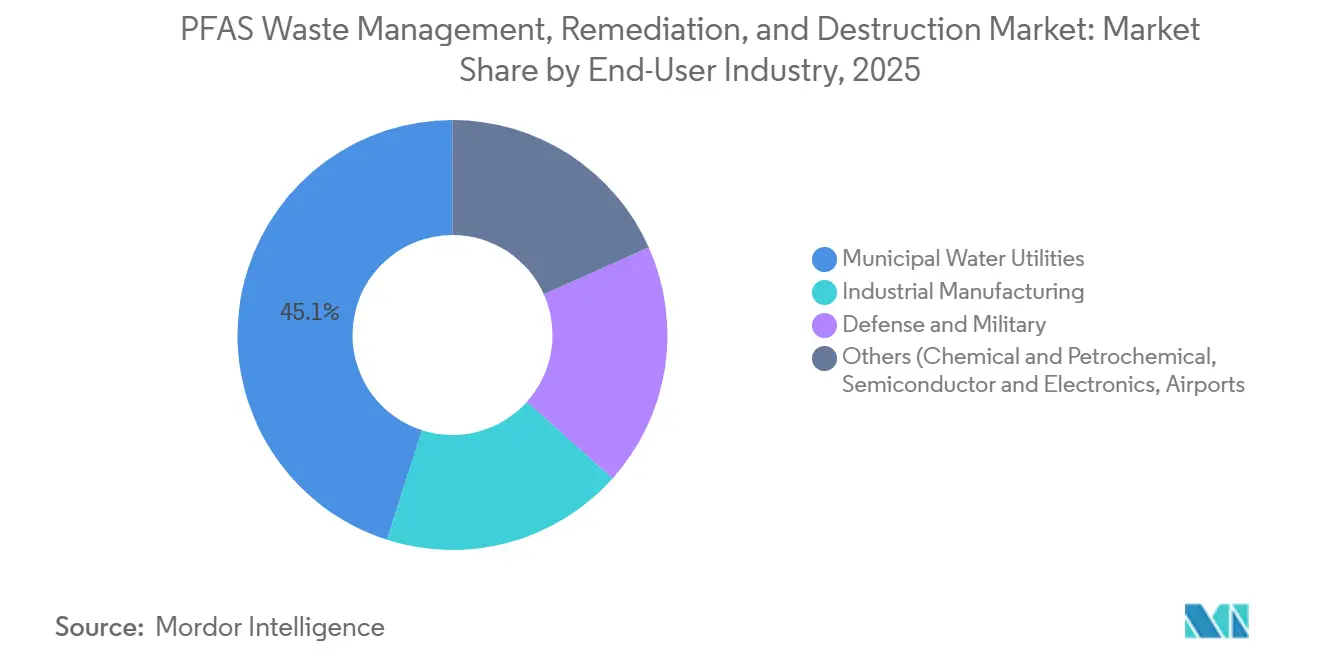
- By end-user industry, municipal water utilities held a 45.07% share in the PFAS waste management, remediation, and destruction market in 2025, while industrial manufacturing is projected to advance at a 7.91% CAGR through 2031.
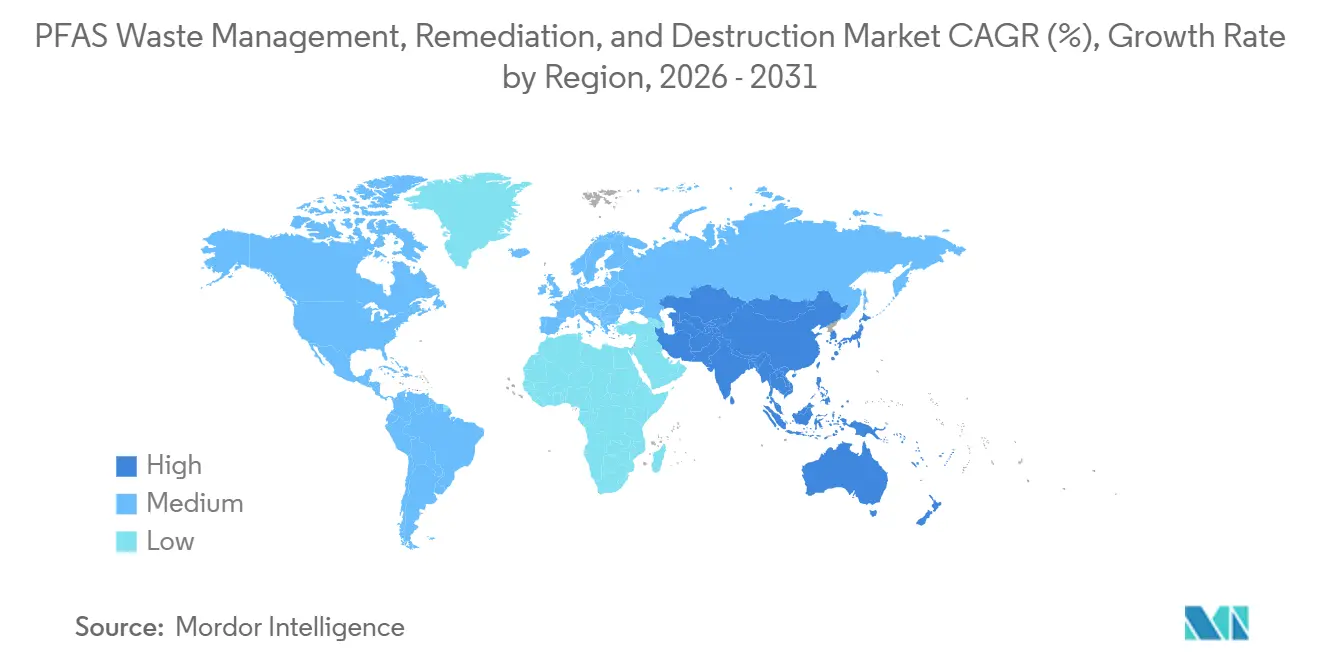
- By geography, North America accounted for a 37.24% share in the PFAS waste management, remediation, and destruction market in 2025, while Asia-Pacific is forecast to grow at a 7.83% CAGR through 2031.
Note: Market size and forecast figures in this report are generated using Mordor Intelligence’s proprietary estimation framework, updated with the latest available data and insights as of January 2026.
Market Trends and Insights
Drivers Impact Analysis of PFAS Waste Management, Remediation, and Destruction Market*
| Drivers | (~) % Impact on CAGR Forecast | Geographic Relevance | Impact Timeline |
|---|---|---|---|
| Ultra-Low PFAS Drinking-Water Limits and Compliance Procurement | +1.8% | North America and Europe, spillover to the Asia-Pacific | Short term (≤ 2 years) |
| Government Funding for Emerging-Contaminant Infrastructure | +1.2% | Global, most pronounced in North America | Short term (≤ 2 years) |
| Expansion of Industrial PFAS Source-Control and Discharge Treatment | +0.9% | North America and the Asia-Pacific core | Medium term (2-4 years) |
| Corporate Liability, Litigation, and Polluter-Pays Cost Allocation | +0.7% | North America, spill-over to Europe | Medium term (2-4 years) |
| Capture-to-Destruction Demand for Concentrates and Spent Media | +0.5% | Global | Long term (≥ 4 years) |
| PFAS Fingerprinting, Real-Time Monitoring, and Breakthrough Prediction | +0.3% | Global, early gains in North America and Europe | Long term (≥ 4 years) |
| Source: Mordor Intelligence | |||
Ultra-Low PFAS Drinking-Water Limits Drive Compliance Procurement
The U.S. Environmental Protection Agency set maximum contaminant levels of 4 ng/L for PFOA and PFOS under its National Primary Drinking Water Regulations. The proposed rule issued in May 2026 retains the PFOA and PFOS limits and gives certain systems more time for capital improvements, with compliance extending to 2031 in those cases. Treatment remains an ongoing operating requirement, as utilities must sustain performance through media replacement, monitoring, and residuals management. Germany made its PFAS-20 aggregate limit legally binding as of January 12, 2026, while Japan made PFOS and PFOA mandatory inspection parameters under the Waterworks Act as of April 2026[1]. These requirements give the PFAS waste management, remediation, and destruction market a more synchronized procurement calendar across major economies.
Government Funding for Emerging-Contaminant Infrastructure Reduces Procurement Risk
The Bipartisan Infrastructure Law includes USD 5 billion for the Emerging Contaminants in Small or Disadvantaged Communities grant program across fiscal years 2022 through 2026. The funding reduces the financial barrier for communities that need PFAS treatment but have limited local revenue. Noncompetitive grants can favor established Granular Activated Carbon (GAC) and ion-exchange systems because recipients face fewer procurement hurdles and often require commercially proven equipment. This pattern supports near-term positions for experienced environmental service providers in the PFAS waste management, remediation, and destruction market. Japan selected 6 technologies in May 2026 for a supplementary-budget demonstration program aimed at reducing PFOS and PFOA concentrations at water utilities. Canada also awarded Arcadis a PFAS assessment and management contract through March 2028, indicating that public real estate portfolios can become recurring procurement channels.
Industrial PFAS Source-Control Expands Demand Beyond Drinking Water
The EPA is revising effluent limitation guidelines for PFAS manufacturers in the Organic Chemicals, Plastics, and Synthetic Fibers category through Effluent Guidelines Program Plan 15. The planned limits would apply to more than 1,000 chemical facilities producing more than 25,000 end products. This creates an industrial procurement stream that is separate from municipal drinking water budgets. Connecticut required industries with known or suspected PFAS discharges to prepare source identification and reduction plans in October 2025. LANXESS validated its Lewatit MDS TP 108 selective ion exchange resin at Chemours Netherlands and reported more than 99% removal of short-chain fluorinated organic compounds from production wastewater. As stormwater and process water obligations broaden, industrial treatment offers a distinct path for expansion in the PFAS waste management, remediation, and destruction market.
Corporate Liability and Litigation Create Ring-Fenced Remediation Budgets
PFAS litigation is a direct source of remediation funding when settlement proceeds are assigned to cleanup programs. DuPont, Chemours, and Corteva agreed in August 2025 to pay New Jersey up to USD 2 billion, consisting of USD 875 million in payments and a USD 1.2 billion remediation fund. The U.S. EPA also reached an agreement with Chemours in April 2025 for more than USD 450 million in penalties and relief. Dedicated accounts give prequalified service providers access to project budgets that are not subject to the same uncertainty as public revenue. Polluter-pays cases also increase exposure for semiconductor manufacturers, landfill operators, and petrochemical processors. This broadens the corporate-funded pipeline for the PFAS waste management, remediation, and destruction market beyond legacy aqueous film-forming foam sites.
Restraints Impact Analysis of PFAS Waste Management, Remediation, and Destruction Market*
| Restraints | (~) % Impact on CAGR Forecast | Geographic Relevance | Impact Timeline |
|---|---|---|---|
| High Treatment, Energy, and Residuals-Handling Costs | -1.0% | Global | Medium term (2-4 years) |
| Limited Full-Scale Validation of Destruction Technologies | -0.7% | Global, most acute in Asia-Pacific and South America | Long term (≥ 4 years) |
| Short-Chain PFAS, Matrix Interference, and Secondary Waste Complexity | -0.5% | Global | Medium term (2-4 years) |
| Uneven Regulatory Acceptance of Destruction, Landfilling, and Injection Pathways | -0.4% | Europe, South America, and Middle-East and Africa | Long term (≥ 4 years) |
| Source: Mordor Intelligence | |||
High Treatment and Energy Costs Limit Uptake in Cost-Sensitive Markets
PFAS treatment incurs operating costs ranging from USD 0.03/m³ to USD 28/m³ and capital costs from USD 0.01/m³ to USD 0.51/m³, depending on the influent matrix and the selected technology[2]. High-temperature incineration requires secondary-combustion chamber temperatures above 1,100°C to ensure consistent mineralization. GAC and ion-exchange systems capture PFAS in spent media rather than destroying it, adding a second stage for transport and destructive treatment. This residual cascade raises logistics and energy costs for projects that require full waste management. Smaller rural utilities and communities in developing economies face affordability constraints even when contamination is documented. These conditions limit adoption in cost-sensitive parts of the PFAS waste management, remediation, and destruction market.
Limited Full-Scale Validation Delays Adoption of Advanced Destruction Technologies
Supercritical water oxidation, electrochemical oxidation, and plasma treatment have demonstrated PFAS destruction results in laboratory and pilot studies, but most vendors have limited full-scale commercial operating data. In February 2026, the U.S. Army Engineer Research and Development Center validated General Atomics' industrial SCWO system for the treatment of aqueous film-forming foam. The report listed treatment costs ranging from USD 47 to USD 238 per gallon, creating a broad range for municipal and Department of Defense budgeting. The EPA's April 2026 guidance noted limited full-scale testing, incomplete emissions data, and immature methods for measuring products of incomplete destruction. Agencies in Asia-Pacific and South America often require demonstrated full-scale performance before committing capital, which can extend commercialization timelines for technology developers in the PFAS waste management, remediation, and destruction market.
*Our forecasts treat driver/restraint impacts as directional, not additive. The impact forecasts reflect baseline growth, mix effects, and variable interactions.
PFAS Waste Management, Remediation, and Destruction Market Segment Analysis
By Contaminated Media:
Drinking Water Compliance Drives Demand, Industrial Streams Support GrowthSurface and drinking water accounted for 46.18% of the PFAS waste management, remediation, and destruction market share in 2025. Enforceable drinking-water limits require utilities to maintain treatment performance after installation, creating recurring work in monitoring, media replacement, residuals collection, and final destruction. Industrial wastewater and effluent are the fastest-growing category of contaminated media, with a CAGR of 7.12% from 2026 to 2031, as EPA rulemaking and state pretreatment programs extend discharge obligations to chemical manufacturers, textile mills, and landfill operators. The market, therefore, combines a stable municipal treatment base with an expanding industrial source-control pipeline.
Natural organic matter can compete with PFAS for adsorption sites on granular activated carbon (GAC) in surface water, reducing media efficiency and increasing replacement frequency. This can favor ion-exchange resins and advanced oxidation hybrids where carbon-only treatment is less effective. Groundwater remains central to long-duration federal projects, particularly at military and aviation sites. North Rhine-Westphalia's 2025 inventory found groundwater impact in 68% of 193 documented PFAS assessments. Soil, sediment, landfill leachate, and solid waste are also becoming discrete regulatory targets within the market, and the EPA's 2026 guidance addresses management pathways for landfill operators.

By Remediation Technology:
GAC Leads on Scale, Ion Exchange Targets Short-Chain ComplexityGranular activated carbon (GAC) held a 40.24% share of global revenue in 2025 across municipal and industrial applications, driven by broad regulatory acceptance and extensive deployment experience with PFOA and PFOS. Ion exchange resins are forecast to grow at a CAGR of 7.30% from 2026 to 2031, as short-chain PFAS attract greater regulatory attention and are more difficult for GAC to absorb. LANXESS validated Lewatit MDS TP 108 at a Chemours Netherlands facility in 2025 and 2026, reporting more than 99% removal of fluorinated organic compounds, including ultrashort-chain species. This supports the use of specialized resin systems for demanding industrial wastewater streams.
GAC and ion exchange have better-defined cost parameters when water matrices are characterized through systematic process modeling, providing utilities with a defensible basis for technology selection. Reverse osmosis and nanofiltration serve as concentration stages in multi-step industrial treatment trains, reducing the quantity of PFAS-laden material that requires downstream destruction. Other approaches, including foam fractionation and in situ remediation, address specialized applications such as aqueous film-forming foam-affected aquifer plumes, where above-ground treatment can be impractical.
By Destruction Technology:
Incineration Leads, Electrochemical Oxidation GrowsHigh-temperature incineration accounted for 43.13% of the market in 2025, making it the leading destruction technology. It has the most extensive performance validation for concentrated PFAS waste streams, including spent GAC and aqueous film-forming foam. Tests at Veolia's Port Arthur, Texas, facility and Clean Harbors' Aragonite, Utah, facility reported destruction and removal efficiencies of up to 99.99% for PFOS and PFHxS. The EPA's April 2026 guidance recognizes hazardous-waste combustors as verified destruction pathways for wastes requiring a permitted final destruction route.
Electrochemical oxidation is the fastest-growing destruction technology, with a forecast CAGR of 6.82% from 2026 to 2031. A 2026 Chemical Science review reported advances in Ti4O7 and CeO2 electrodes that achieved 94% PFOA removal and 73% defluorination at low oxidation potentials, supporting modular on-site systems. The Army Engineer Research and Development Center validated General Atomics' iSCWO system in February 2026, while 374Water reported a 99.9993% destruction and removal efficiency for 42 PFAS compounds in a 2025 Department of Defense demonstration. Plasma treatment, UV-based oxidation, and mechanochemical methods remain in the demonstration phase but may serve remote sites where transport is difficult.
By End-User Industry:
Municipal Utilities Dominate, Industrial Manufacturing Grows RapidlyMunicipal water utilities held a 45.07% share in 2025, as they are responsible for meeting drinking-water requirements across centralized water supplies. Industrial manufacturing is the fastest-growing end-user segment, with a CAGR of 7.91% from 2026 to 2031, as requirements shift toward effluent limits that directly address manufacturing wastewater. Chemical producers, textile mills, and other industrial sites are increasingly subject to source-control and discharge management obligations. This combination gives the market a large, regulated utility customer base alongside a growing industrial client group.
Defense and military work has a defined project scope, as the U.S. Department of Defense manages PFAS contamination at more than 700 installations. The April 2026 Department of Defense and EPA guidance authorizes incineration and supercritical water oxidation (SCWO) for the destruction of aqueous film-forming foam, shifting part of the defense pipeline from assessment to project delivery. Other end users include semiconductor and electronics businesses, airports, chemical and petrochemical facilities, oil and gas operators, waste management firms, and landfills. The EPA's Publicly Owned Treatment Works (POTW) influent PFAS work documents industrial contributions to POTWs, supporting broader source-control requirements across the market.
Geography Analysis
North America PFAS Waste Management, Remediation, and Destruction Market
North America accounted for 37.24% of global revenue in 2025, supported by federal mandates, infrastructure funding, and litigation settlements that create overlapping project-funding streams. The USD 5 billion Emerging Contaminants in Small or Disadvantaged Communities program supported water-system investments through fiscal year 2026. Large urban utilities can use State Revolving Fund loans for centralized Granular Activated Carbon (GAC) and ion-exchange systems, while rural and small systems often rely on noncompetitive grants for point-of-entry solutions. These funding routes require different products, delivery models, and procurement approaches.
Canada and Europe PFAS Waste Management, Remediation, and Destruction Market
Canada's July 2025 multi-year Arcadi contract indicates that federal real-estate portfolios can support systematic PFAS remediation beyond individual US sites. Europe held the second-largest regional share in the PFAS waste management, remediation, and destruction market in 2025, with Germany, the Nordic countries, and the United Kingdom leading. Germany's PFAS-20 aggregate limit took effect on January 12, 2026, making compliance investment a near-term water-utility priority. Sector-specific conditional exemptions for semiconductor, transport, and energy uses are expected to create phased industrial treatment spending rather than an immediate prohibition.
APAC, South America and Middle East PFAS Waste Management, Remediation, and Destruction Market
Asia-Pacific is projected to be the fastest-growing region at a CAGR of 7.83% from 2026 to 2031. Japan made PFOS and PFOA mandatory Waterworks Act inspection parameters from April 2026, requiring quarterly testing and supporting treatment-system investment for the 50 ng/L combined standard. China's large fluorochemical manufacturing base is a major source of industrial contamination, while Brazil and Saudi Arabia anchor early-stage demand for industrial and defense remediation in other regions. Multilateral water-quality programs are beginning to establish procurement structures as domestic environmental enforcement develops, making Asia-Pacific a significant expansion area for the PFAS waste management, remediation, and destruction market.
Competitive Landscape
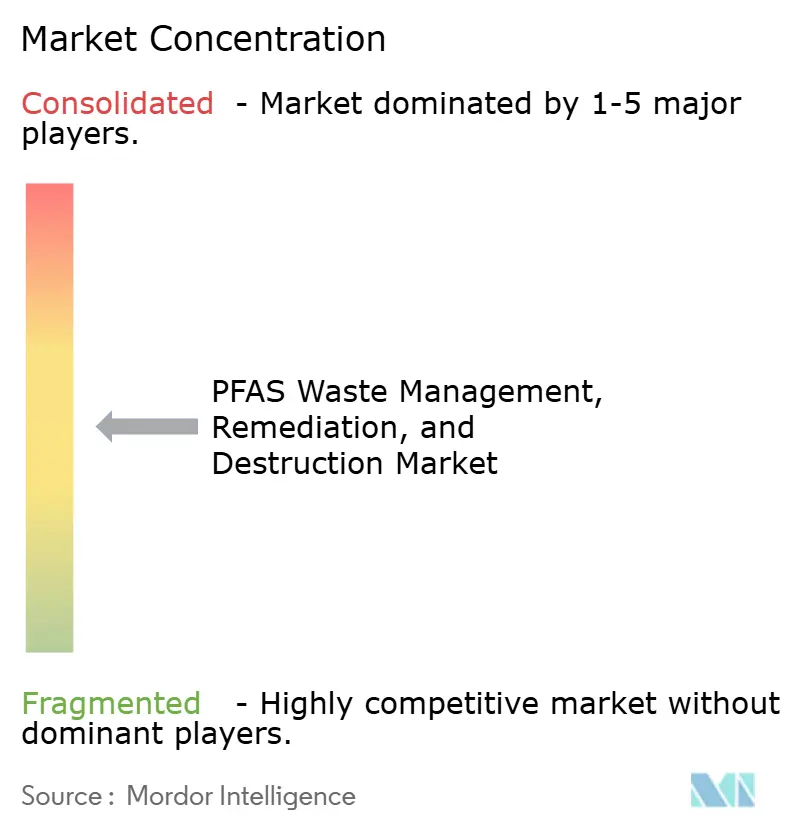
The PFAS waste management, remediation, and destruction market is moderately fragmented among large environmental service providers with integrated capabilities in assessment, capture, logistics, and final destruction. Government contracts increasingly use indefinite-delivery, indefinite-quantity structures with shared capacity of USD 150 million to USD 500 million, which can be difficult for mid-tier firms to pursue without partners. Permitting under RCRA, TSCA, and state hazardous-waste rules also protects operators that already have thermal destruction capacity. Clean Harbors reported USD 125 million in PFAS-related revenue in 2025 and projected USD 175 million in 2026, underscoring the revenue potential of full-cycle capabilities.
Decentralized and on-site destruction represents a key opportunity, as validated thermal capacity is concentrated in a limited number of North American commercial incinerators. Consequently, remote military sites, industrial facilities, and utilities in developing regions face high transport costs and limited access. A 2026 Chemical Science review described advances across several classes of electrochemical electrodes and in the modeling of PFAS degradation mechanisms. LANXESS also established a specialized position through industrial-scale validation of monodisperse resin beads for short-chain PFAS.
In July 2026, 374Water and Arcadis executed a memorandum of understanding to pursue federal and commercial PFAS destruction contracts. The arrangement combines AirSCWO performance data with Arcadis's engineering and contracting reach. Providers are also expanding geographic capacity and seeking certification across more than one destruction route. Firms that combine these capabilities can offer a single project path from assessment through final disposal. The PFAS waste management, remediation, and destruction market places a premium on validated performance, permitting, project management depth, and residual logistics.
PFAS Waste Management, Remediation, and Destruction Industry Leaders
-
Veolia
-
AECOM
-
Xylem
-
CLEAN HARBORS, INC.
-
WSP
- *Disclaimer: Major Players sorted in no particular order
PFAS Waste Management, Remediation, and Destruction Market Companies Covered in this Report
- Aclarity, Inc.
- AECOM
- Arcadis
- Battelle Memorial Institute
- Calgon Carbon Corporation
- CDM Smith
- Clean Earth
- CLEAN HARBORS, INC.
- Jacobs
- KURARAY CO., LTD.
- LANXESS AG
- Ovivo Inc.
- Pentair
- Tetra Tech, Inc.
- TRC COMPANIES, INC
- Veolia
- WSP
- Xylem
Recent Industry Developments in PFAS Waste Management, Remediation, and Destruction Market
- July 2026: 374Water Inc. and Arcadis U.S. executed a Memorandum of Understanding to jointly pursue federal and commercial PFAS destruction contracts, focused on AFFF and other PFAS-impacted waste streams. The collaboration converts federally validated AirSCWO performance data into a commercial delivery capability supported by Arcadis's engineering and contracting reach.
- July 2026: Tetra Tech was selected by the City of Dayton, Ohio for an eight-year contract to design the largest dedicated PFAS treatment facility in the United States, with a projected construction cost of USD 350 million. The plant addresses legacy contamination in the Mad River Well Field, which supplies the city's Ottawa Water Treatment Plant at 96 million gallons per day.
Global PFAS Waste Management, Remediation, and Destruction Market Report Scope
PFAS (per- and polyfluoroalkyl substances) are synthetic chemicals characterized by strong carbon-fluorine bonds that resist natural breakdown. PFAS remediation and destruction involve capturing these toxic compounds from water, soil, and waste streams and breaking them down permanently to eliminate environmental risks.
The PFAS waste management, remediation, and destruction market is segmented by contaminated media, remediation technology, destruction technology, end-user industry, and geography. By contaminated media, the market is segmented into groundwater, surface and drinking water, soil and sediment, industrial wastewater and effluent, and others ( landfill leachate, PFAS-containing solid waste). By remediation technology, the market is segmented into granular activated carbon (GAC), ion exchange resins, reverse osmosis and nanofiltration, and others (foam fractionation, adsorptive media, in-situ remediation, other technologies). By destruction technology, the market is segmented into high-temperature incineration, supercritical water oxidation (SCWO), electrochemical oxidation, and others (plasma treatment, UV-based advanced oxidation, mechanochemical destruction, other emerging technologies). By end-user industry, the market is segmented into municipal water utilities, industrial manufacturing, defense and military, and others (chemical and petrochemical, semiconductor and electronics, airports and aviation, oil and gas, waste management companies, landfills). The report also covers market size and forecasts for PFAS waste management, remediation, and destruction across 15 countries in major regions. The market sizes and forecasts are provided in terms of value (USD).
Segmentation Overview
| Groundwater |
| Surface and Drinking Water |
| Soil and Sediment |
| Industrial Wastewater and Effluent |
| Others (Landfill Leachate, PFAS-Containing Solid Waste) |
| Granular Activated Carbon (GAC) |
| Ion Exchange Resins |
| Reverse Osmosis and Nanofiltration |
| Others (Foam Fractionation, Adsorptive Media, In-Situ Remediation, Other Technologies) |
| High-Temperature Incineration |
| Supercritical Water Oxidation (SCWO) |
| Electrochemical Oxidation |
| Others (Plasma Treatment, UV-Based Advanced Oxidation, Mechanochemical Destruction, Other Emerging Technologies) |
| Municipal Water Utilities |
| Industrial Manufacturing |
| Defense and Military |
| Others (Chemical and Petrochemical, Semiconductor and Electronics, Airports and Aviation, Oil and Gas, Waste Management Companies, Landfills) |
| Asia-Pacific | China |
| India | |
| Japan | |
| South Korea | |
| ASEAN Countries | |
| Rest of Asia-Pacific | |
| North America | United States |
| Canada | |
| Mexico | |
| Europe | Germany |
| United Kingdom | |
| France | |
| Italy | |
| NORDIC Countries | |
| Rest of Europe | |
| South America | Brazil |
| Argentina | |
| Rest of South America | |
| Middle-East and Africa | Saudi Arabia |
| South Africa | |
| Rest of Middle-East and Africa |
| By Contaminated Media | Groundwater | |
| Surface and Drinking Water | ||
| Soil and Sediment | ||
| Industrial Wastewater and Effluent | ||
| Others (Landfill Leachate, PFAS-Containing Solid Waste) | ||
| By Remediation Technology | Granular Activated Carbon (GAC) | |
| Ion Exchange Resins | ||
| Reverse Osmosis and Nanofiltration | ||
| Others (Foam Fractionation, Adsorptive Media, In-Situ Remediation, Other Technologies) | ||
| By Destruction Technology | High-Temperature Incineration | |
| Supercritical Water Oxidation (SCWO) | ||
| Electrochemical Oxidation | ||
| Others (Plasma Treatment, UV-Based Advanced Oxidation, Mechanochemical Destruction, Other Emerging Technologies) | ||
| By End-User Industry | Municipal Water Utilities | |
| Industrial Manufacturing | ||
| Defense and Military | ||
| Others (Chemical and Petrochemical, Semiconductor and Electronics, Airports and Aviation, Oil and Gas, Waste Management Companies, Landfills) | ||
| By Geography | Asia-Pacific | China |
| India | ||
| Japan | ||
| South Korea | ||
| ASEAN Countries | ||
| Rest of Asia-Pacific | ||
| North America | United States | |
| Canada | ||
| Mexico | ||
| Europe | Germany | |
| United Kingdom | ||
| France | ||
| Italy | ||
| NORDIC Countries | ||
| Rest of Europe | ||
| South America | Brazil | |
| Argentina | ||
| Rest of South America | ||
| Middle-East and Africa | Saudi Arabia | |
| South Africa | ||
| Rest of Middle-East and Africa | ||
Key Questions Answered in the Report
What is current market size of PFAS Waste Management, Remediation, and Destruction Market?
The PFAS waste management, remediation, and destruction market size is estimated at USD 2.44 billion in 2025 and is estimated to grow from USD 2.58 billion in 2026 to USD 3.46 billion by 2031, at a CAGR of 6.02% during the forecast period (2026-2031).
Which contaminated media category leads PFAS treatment demand?
Surface and drinking water led with a 46.18% share in 2025 because utilities need ongoing treatment to meet enforceable drinking-water limits. Industrial wastewater and effluent are the fastest-growing categories at a 7.12% CAGR.
Which PFAS remediation technology is growing the fastest?
Ion exchange resins are projected to grow at a 7.30% CAGR through 2031 because they can address short-chain PFAS compounds that are difficult for granular activated carbon (GAC) to absorb. GAC remained the leading remediation technology, with a 40.24% share in 2025.
Why does high-temperature incineration remain important for PFAS waste?
It held a 43.13% share in 2025 and provides an established final-destruction route for concentrated waste, including spent treatment media. The Environmental Protection Agency (EPA) identifies hazardous-waste combustors as verified destruction pathways.