
Paraformaldehyde Market Size and Share
Market Overview
| Study Period | 2021 - 2031 |
|---|---|
| Market Size (2026) | USD 1.29 Billion |
| Market Size (2031) | USD 1.67 Billion |
| Growth Rate (2026 - 2031) | 5.36 % |
| Fastest Growing Market | Asia-Pacific |
| Largest Market | Asia-Pacific |
| Market Concentration | Medium |
Major Players *Disclaimer: Major Players sorted in no particular order Image © Mordor Intelligence. Reuse requires attribution under CC BY 4.0. | |
Paraformaldehyde Market Analysis by Mordor Intelligence
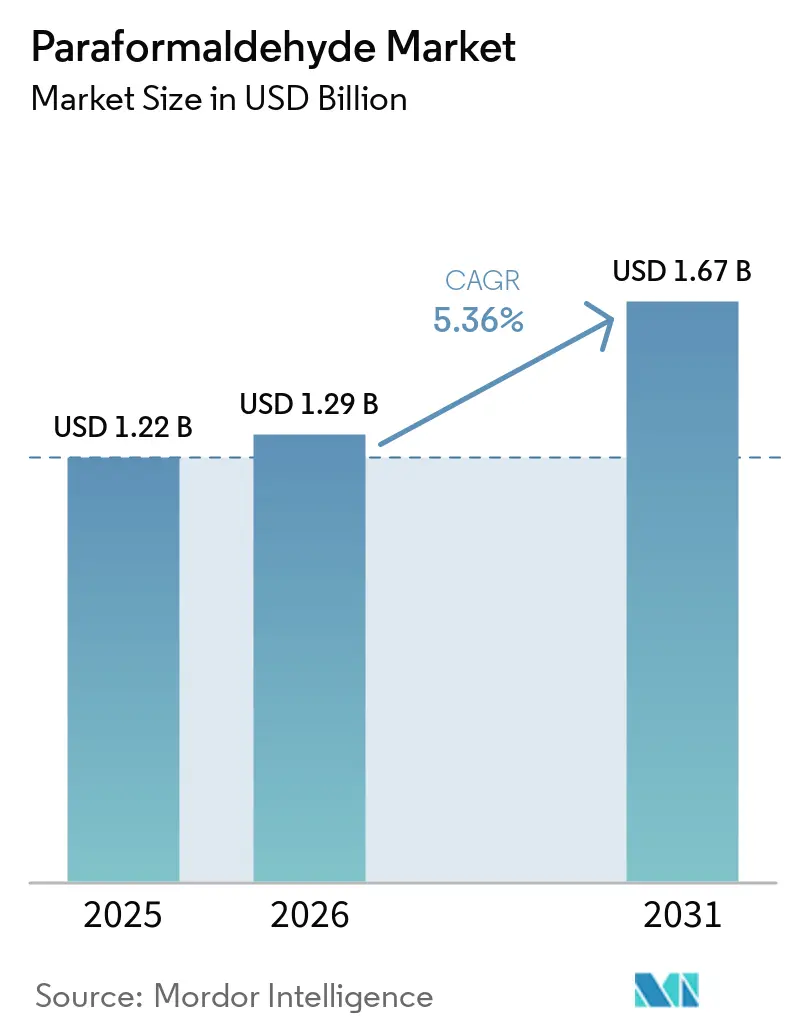
The Paraformaldehyde Market size was valued at USD 1.22 billion in 2025 and is estimated to grow from USD 1.29 billion in 2026 to reach USD 1.67 billion by 2031, at a CAGR of 5.36% during the forecast period (2026-2031). Solid paraformaldehyde offers simpler handling and transport than aqueous formalin for downstream manufacturers. Its controlled depolymerization supports consistent formaldehyde yields during industrial synthesis. This benefit supports use across resins, agrochemicals, pharmaceuticals, and oilfield chemistry. Producers are responding to input-cost volatility by favoring integrated methanol, formaldehyde, and paraformaldehyde operations. Regulatory differences between European and Asian markets will continue to shape product qualifications and customer access.
Key Report Takeaways
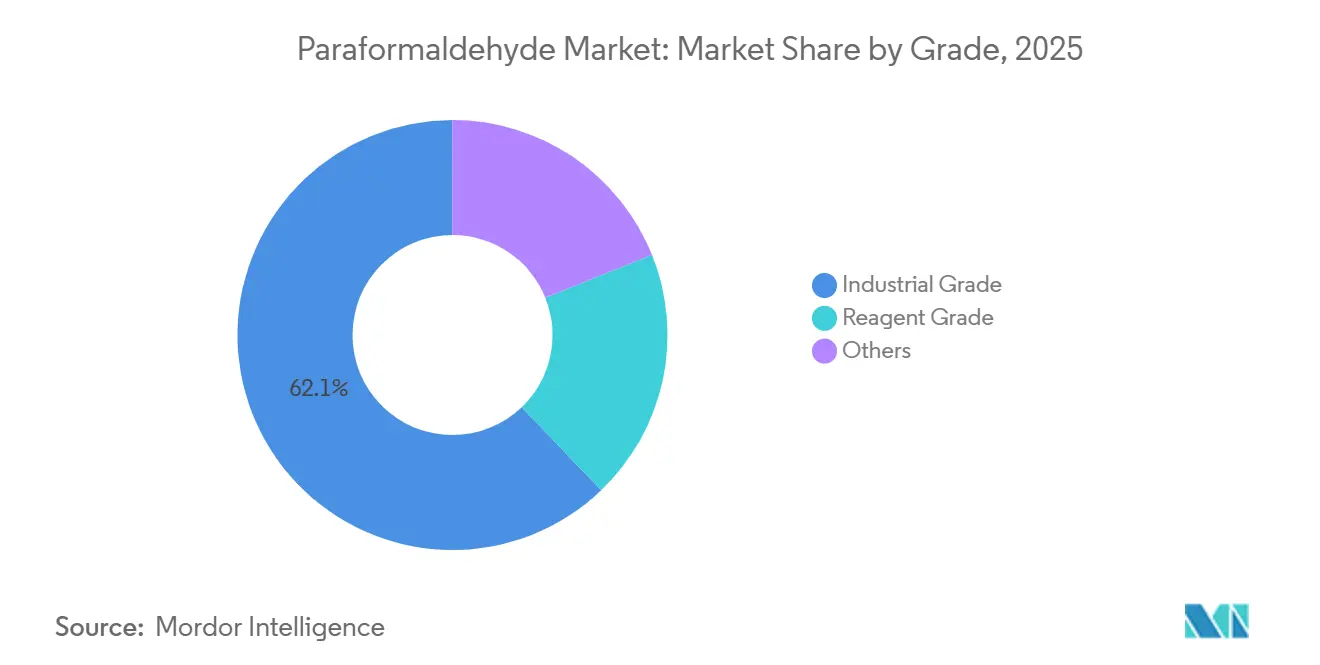
- By grade, industrial grade held 62.15% of the paraformaldehyde market share in 2025, while reagent grade is projected to advance at a 6.21% CAGR through 2031.
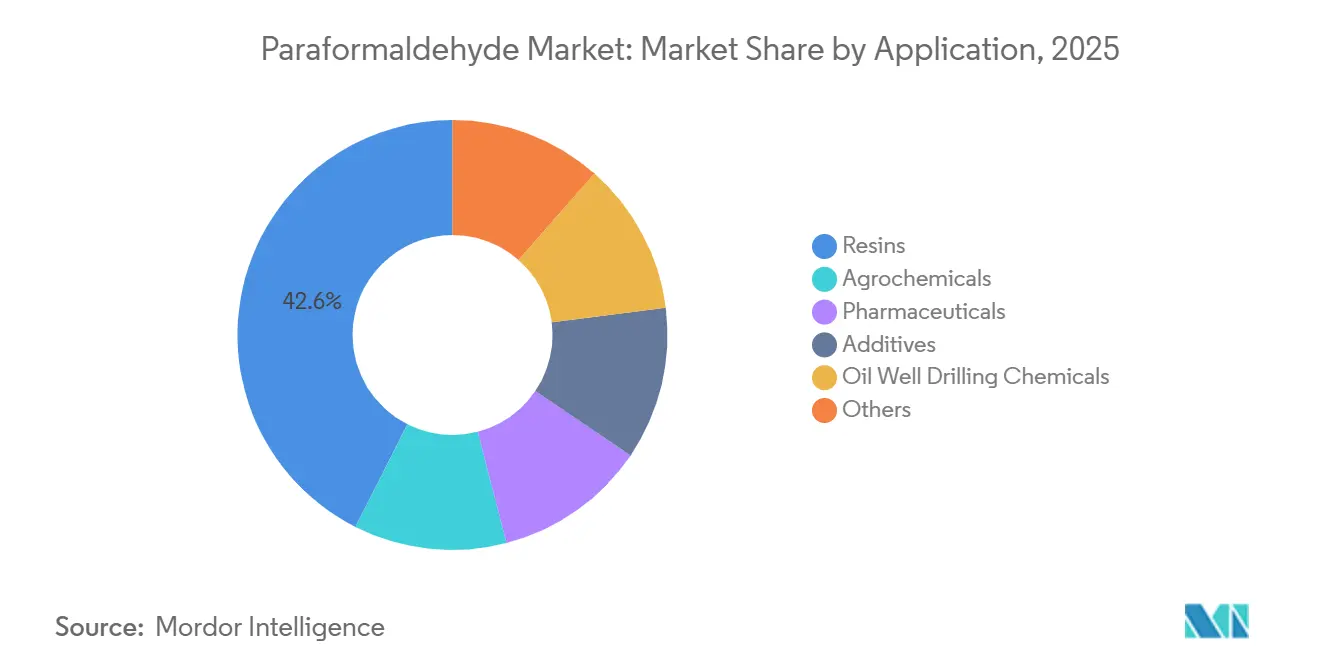
- By application, resins held 42.56% of the paraformaldehyde market share in 2025, while agrochemicals are projected to advance at a 6.66% CAGR through 2031.
- By geography, Asia-Pacific held 45.67% of the paraformaldehyde market share in 2025 and is projected to advance at a 6.38% CAGR through 2031.
Note: Market size and forecast figures in this report are generated using Mordor Intelligence’s proprietary estimation framework, updated with the latest available data and insights as of January 2026.
Global Paraformaldehyde Market Trends and Insights
Drivers Impact Analysis*
| Driver | (~) % Impact on CAGR Forecast | Geographic Relevance | Impact Timeline |
|---|---|---|---|
| Expanding Resin and Adhesive Demand | +1.8% | Global, concentrated in Asia-Pacific, Europe, and North America | Short term (≤ 2 years) |
| Rising Agrochemical Synthesis Requirements | +1.4% | APAC core; spillover to South America and MEA | Medium term (2-4 years) |
| Increasing Pharmaceutical and Healthcare Applications | +0.9% | Global; early gains in India, China, and North America | Medium term (2-4 years) |
| Growth of Solid Formaldehyde Demand in Emerging Markets | +0.7% | Asia-Pacific, South America, Middle East and Africa | Long term (≥ 4 years) |
| Integrated Methanol-to-Paraformaldehyde Production Economics | +0.5% | Global; strongest adoption in China and Western Europe | Long term (≥ 4 years) |
| Source: Mordor Intelligence | |||
Expanding Resin and Adhesive Demand
Resin demand links the paraformaldehyde market to construction activity and furniture production. Paraformaldehyde is used to make urea-formaldehyde, phenol-formaldehyde, and melamine-formaldehyde resins. Resins held 42.56% of demand in 2025, supported by engineered wood panels in East and Southeast Asia. European residential renovation also supported resin consumption during that year. European Union rules now require wood-based furniture to meet a 0.062 mg/m³ formaldehyde emission limit from August 6, 2026[1]European Commission, “Commission Regulation (EU) 2023/1464 Amending Annex XVII as Regards Formaldehyde and Formaldehyde Releasers,” Official Journal of the European Union, eur-lex.europa.eu.
Rising Agrochemical Synthesis Requirements
The paraformaldehyde market serves herbicide synthesis through controlled delivery of formaldehyde. Glyphosate, butachlor, and acetochlor production routes rely on this reactive intermediate. Crop productivity needs remain important as weather conditions and food demand pressure agricultural systems. Manufacturers in South and Southeast Asia are expanding relevant production capacity. India, Vietnam, and Indonesia are important locations for this activity.
Increasing Pharmaceutical and Healthcare Applications
High-purity paraformaldehyde is used in histology, pathology, vaccine stabilization, and active pharmaceutical ingredient synthesis. Pharmaceutical producers require traceable material that meets defined purity requirements. The U.S. Food and Drug Administration identifies pharmaceutical manufacturing as a major economic activity[2]U.S. Food and Drug Administration, “Pharmaceutical Industry,” U.S. Food and Drug Administration, fda.gov. Contract manufacturing growth in India and China supports demand for qualified inputs. In April 2025, Mitsubishi Gas Chemical Company, Inc. and Panasonic Electric Works Co., Ltd. announced work on an eco-friendly urea resin. The project used formaldehyde made from methanol produced through carbon dioxide capture.
Growth of Solid Formaldehyde Demand in Emerging Markets
Southeast Asia, South Asia, and the Middle East are expanding chemical manufacturing capacity. Resin production, agrochemical synthesis, and oilfield services create demand for paraformaldehyde. India has expanded domestic herbicide and resin manufacturing. Local demand is becoming more focused on grade compliance as chemical standards increase. Solid material can remain stable during ambient-temperature storage. It can also reduce the need for pressure vessels during transport and storage.
Restraints Impact Analysis*
| Restraint | (~) % Impact on CAGR Forecast | Geographic Relevance | Impact Timeline |
|---|---|---|---|
| Formaldehyde Exposure and Emission Restrictions | -1.2% | EU and North America; spillover to export-oriented Asian producers | Short term (≤ 2 years) |
| Methanol, Natural Gas and Energy-Price Volatility | -0.8% | Global; acute in Middle East-dependent supply chains and North America | Short term (≤ 2 years) |
| Product Substitution by Lower-Hazard Chemistries | -0.5% | EU and North America; early signs in Japan and South Korea | Long term (≥ 4 years) |
| Source: Mordor Intelligence | |||
Formaldehyde Exposure and Emission Restrictions
Formaldehyde restrictions are increasing quality and compliance requirements for producers and customers. European rules set limits of 0.062 mg/m³ for wood-based furniture and 0.080 mg/m³ for other articles. These limits apply to products placed on the European Union market from August 6, 2026. Vehicle interior limits of 0.062 mg/m³ will apply from August 2027. Manufacturers must use standardized chamber testing and maintain technical documentation. Smaller suppliers face higher requirements for testing and quality systems.
Methanol, Natural Gas and Energy-Price Volatility
Methanol represents a major raw material cost for paraformaldehyde production. Changes in feedstock and energy costs, therefore, affect intermediate chemical pricing. Uncertainty around Iranian export capacity and Strait of Hormuz shipping tightened methanol availability during early 2026. This increased pressure on producers who lack an integrated supply. Buyers in resin and agrochemical applications often cannot defer purchases without affecting operations. Natural gas conditions also influence the costs faced by methanol producers. The U.S. Energy Information Administration publishes projections for industrial natural gas consumption and related energy conditions.
*Our forecasts treat driver/restraint impacts as directional, not additive. The impact forecasts reflect baseline growth, mix effects, and variable interactions.
Segment Analysis
By Grade: Industrial Grade Anchors Revenue, Reagent Grade Advances Through Purity Requirements
Industrial grade held 62.15% of global demand in 2025. Its position reflects demand from resin, agrochemical, and oilfield chemical applications. These uses require dependable material at a competitive cost. Reagent grade is projected to advance at a 6.21% CAGR through 2031. Pharmaceutical contract manufacturers, life-science institutions, and diagnostic operators require purity-certified inputs. The paraformaldehyde market size for reagent grade benefits from demand for traceable and pharmacopeia-compliant inputs. Active pharmaceutical ingredient manufacturers must manage raw material documentation and quality requirements. This favors suppliers with validated production and distribution systems.
Gas-phase processes can produce material with lower impurity profiles than conventional liquid-phase methods. Investment in these processes can support higher-purity product offerings and more demanding customer requirements. European biocide rules also create a defined regulatory pathway for certain paraformaldehyde-based reaction products. In February 2026, the European Commission approved a reaction product as an active substance for product types 2, 6, 11, 12, and 13. Producers need appropriate documentation to support product dossiers in regulated applications. Reagent grade remains important where purity and traceability carry greater commercial value.



By Application: Resins Hold Revenue Lead, Agrochemicals Drive the Pace
Resins held 42.56% of the paraformaldehyde market size in 2025. Engineered wood panels, furniture adhesives, molding compounds, and insulation materials support this demand. Agrochemicals are projected to advance at a 6.66% CAGR through 2031. Herbicide capacity additions support the use of glyphosate, butachlor, and acetochlor synthesis. Pharmaceuticals, additives, and oil well drilling chemicals serve distinct operational needs. The paraformaldehyde market serves applications where vapor control and logistics are important operational considerations. Solid paraformaldehyde can be easier to handle than aqueous formalin in controlled industrial environments.
A 2024 study found that a polyvinyl alcohol-modified urea-formaldehyde plugging agent reduced free formaldehyde content by 36.59%. The study also reported a 94.64% core plugging rate under high-temperature and high-salinity conditions. These findings support the continuing technical relevance of formaldehyde-based systems in oilfield applications. Environmental scrutiny remains an important consideration for this use. European reformulation requirements are also changing the resin demand quality. Panel and furniture manufacturers are reviewing resin systems to meet formaldehyde limits. Phenol-formaldehyde and melamine-formaldehyde systems can require more paraformaldehyde per unit of output. This can support value growth even when resin volumes rise at a slower rate.
Geography Analysis
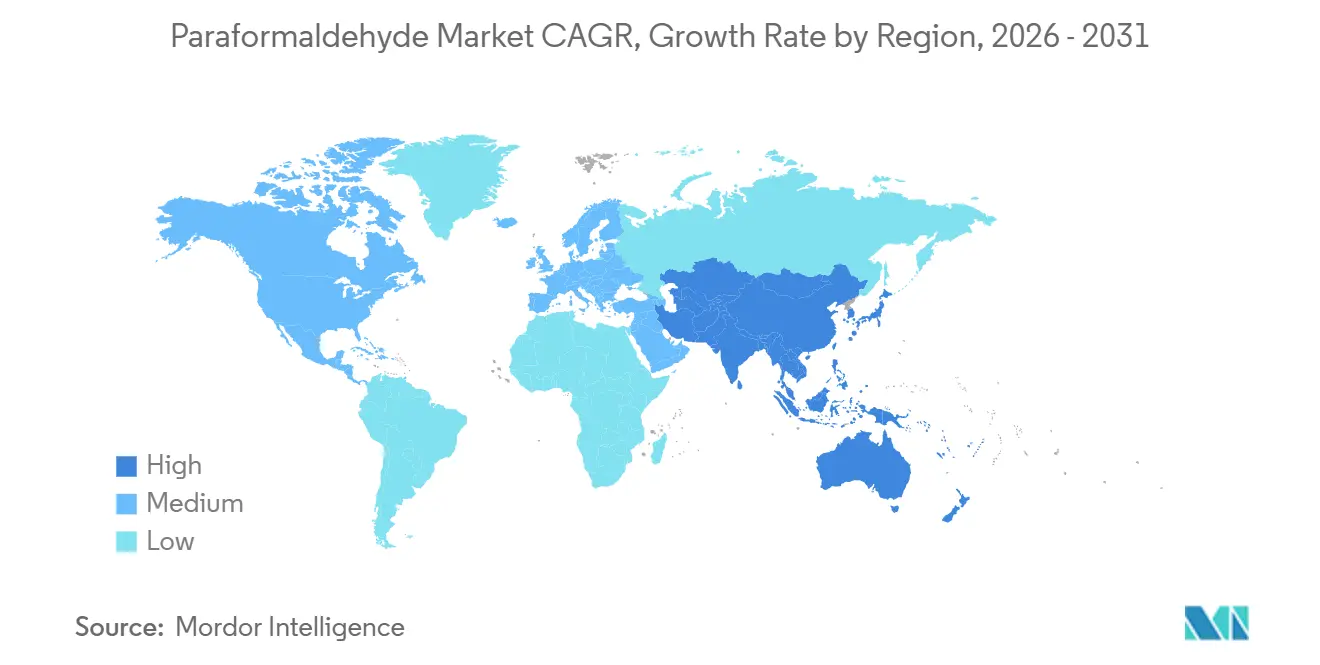
Asia-Pacific held 45.67% of the paraformaldehyde market size in 2025 and is projected to advance at a 6.38% CAGR through 2031. Exports moved mainly to Southeast Asia, India, and South America. Herbicide manufacturing creates demand beyond construction and resin activity alone. India is moving gradually from import dependence toward greater domestic supply. Mitsubishi Gas Chemical Company, Inc. announced its carbon dioxide-derived methanol urea resin project in April 2025. This work shows that paraformaldehyde market suppliers in the region are pursuing sustainability and quality alongside capacity expansion.
North America and Europe are mature demand centers with strict product requirements. European buyers emphasize traceable sourcing and auditable supply chains. The August 2026 European Union emission limits increase the importance of compliant resin formulation. The United States maintains demand through resin, oil and gas, and pharmaceutical uses. South America has agrochemical demand linked to soy, corn, and sugarcane farming. Brazil and Argentina import paraformaldehyde for these applications. The Middle East and Africa demand is linked to oil and gas, chemicals, and resin investment. Saudi Arabia and South Africa are adding specialty chemical capacity, but local supply remains limited.

Competitive Landscape
The paraformaldehyde market is moderately concentrated, with the top five players including Ercros S.A., Celanese Corporation, LCY, Prefere Resins Holding GmbH, and Nantong Jiangtian Chemical Co., Ltd. BASF, Celanese Corporation, and Mitsubishi Gas Chemical Company, Inc. have established positions through scale and integrated value chains. Their customer relationships are particularly important in Western and Japanese markets. Jinan Xiangrui Chemical Co., Ltd., Nantong Jiangtian Chemical Co., Ltd., Shandong Shuangqi Chemical Co., Ltd., and Shouguang Xudong Chemical Co., Ltd. compete for industrial-grade demand in China. Their cost position supports paraformaldehyde market competition in commodity applications. Merck KGaA and Thermo Fisher Scientific Inc. focus on reagent grade requirements.
In March 2026, BASF inaugurated its Zhanjiang Verbund site in China. The site includes 18 plants and more than 70 products. BASF stated that the local-for-local site uses renewable electricity. This investment supports its long-term position in the Chinese chemical sector. In April 2025, Mitsubishi Gas Chemical Company, Inc. collaborated with Panasonic Electric Works Co., Ltd. on lower-carbon urea resin development. The initiative addressed a product pathway that serves downstream formaldehyde chemistry.
Regional producers such as Simalin Chemical Industries Pvt Ltd and Chemanol benefit from proximity to Indian and Middle Eastern customers. Their position can reduce distribution requirements for nearby markets. In September 2026, BASF completed the modernization of its Ludwigshafen acid chlorides and chloroformates plant. BASF said the project increased capacity by 30%. Integrated producers can invest in assets that serve several downstream chemical uses. Regulatory testing and certified supply chains remain important barriers for producers seeking regulated applications.
Paraformaldehyde Industry Leaders
Ercros S.A.
Celanese Corporation
LCY
Prefere Resins Holding GmbH
Nantong Jiangtian Chemical Co., Ltd.
- *Disclaimer: Major Players sorted in no particular order


Recent Industry Developments
- September 2026: BASF inaugurated its fully modernized acid chlorides and chloroformates plant at Ludwigshafen, increasing production capacity by approximately 30% through a low three-digit million-euro investment. The expanded intermediate production strengthens BASF’s chemical supply capabilities, including for value chains that use formaldehyde and related intermediates, supporting broader paraformaldehyde-linked industrial applications.
- February 2026: The European Commission approved formaldehyde released from the reaction products of paraformaldehyde and 2-hydroxypropylamine at a 3:2 ratio as an active substance for biocidal product types 2, 6, 11, 12, and 13. The regulation provides a defined regulatory pathway for a paraformaldehyde-based active substance, supporting continued use of paraformaldehyde-derived chemistry in industrial disinfection, preservation, and slime-control applications.


Global Paraformaldehyde Market Report Scope
Paraformaldehyde is a solid polymeric form of formaldehyde used as a source of formaldehyde in various chemical formulations and industrial processes. It offers convenient handling, storage, and controlled release of formaldehyde for downstream manufacturing.
The Paraformaldehyde Market is segmented by grade, application, and geography. By grade, the market is segmented into industrial grade, reagent grade, and others. By application, the market is segmented into resins, agrochemicals, pharmaceuticals, additives, oil well drilling chemicals, and others. The report also covers the market size and forecasts for paraformaldehyde in 15 countries across major regions. For each segment, the market sizing and forecasts have been done on the basis of value (USD).
| Industrial Grade |
| Reagent Grade |
| Others |
| Resins |
| Agrochemicals |
| Pharmaceuticals |
| Additives |
| Oil Well Drilling Chemicals |
| Others |
| Asia-Pacific | China |
| India | |
| Japan | |
| South Korea | |
| ASEAN Countries | |
| Rest of Asia-Pacific | |
| North America | United States |
| Canada | |
| Mexico | |
| Europe | Germany |
| United Kingdom | |
| France | |
| Italy | |
| NORDIC Countries | |
| Rest of Europe | |
| South America | Brazil |
| Argentina | |
| Rest of South America | |
| Middle East and Africa | Saudi Arabia |
| South Africa | |
| Rest of Middle East and Africa |
| By Grade | Industrial Grade | |
| Reagent Grade | ||
| Others | ||
| By Application | Resins | |
| Agrochemicals | ||
| Pharmaceuticals | ||
| Additives | ||
| Oil Well Drilling Chemicals | ||
| Others | ||
| By Geography | Asia-Pacific | China |
| India | ||
| Japan | ||
| South Korea | ||
| ASEAN Countries | ||
| Rest of Asia-Pacific | ||
| North America | United States | |
| Canada | ||
| Mexico | ||
| Europe | Germany | |
| United Kingdom | ||
| France | ||
| Italy | ||
| NORDIC Countries | ||
| Rest of Europe | ||
| South America | Brazil | |
| Argentina | ||
| Rest of South America | ||
| Middle East and Africa | Saudi Arabia | |
| South Africa | ||
| Rest of Middle East and Africa | ||


Key Questions Answered in the Report
What is the size of the paraformaldehyde market?
The paraformaldehyde market stands at USD 1.29 billion in 2026 and is projected to reach USD 1.67 billion by 2031.
What is driving paraformaldehyde demand?
Resin manufacturing, herbicide synthesis, pharmaceutical uses, and preference for solid material support demand.
Which grade led the market share in 2025?
Industrial grade held 62.15% of global demand in 2025, supported by resin and agrochemical applications.
Which application is expected to grow fastest through 2031?
Agrochemicals are projected to advance at a 6.66% CAGR through 2031.
Page last updated on:





