
OTT Audience Analytics Market Size and Share
Market Overview
| Study Period | 2020 - 2031 |
|---|---|
| Market Size (2026) | USD 1.46 Billion |
| Market Size (2031) | USD 2.99 Billion |
| Growth Rate (2026 - 2031) | 15.42 % |
| Fastest Growing Market | Asia-Pacific |
| Largest Market | North America |
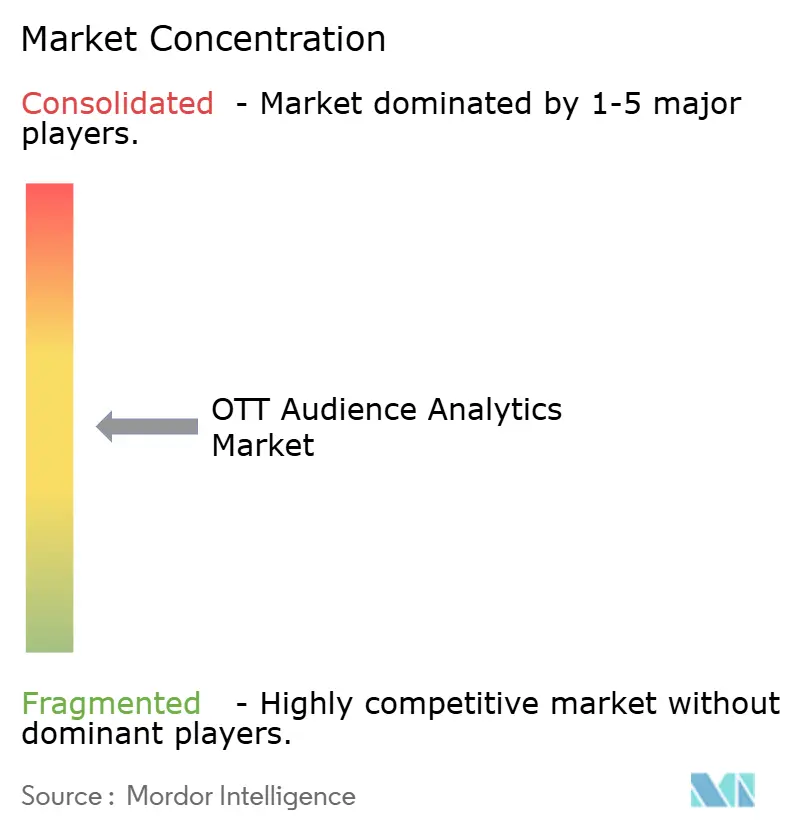
| Market Concentration | Medium |
Major Players *Disclaimer: Major Players sorted in no particular order Image © Mordor Intelligence. Reuse requires attribution under CC BY 4.0. | |
OTT Audience Analytics Market Analysis by Mordor Intelligence
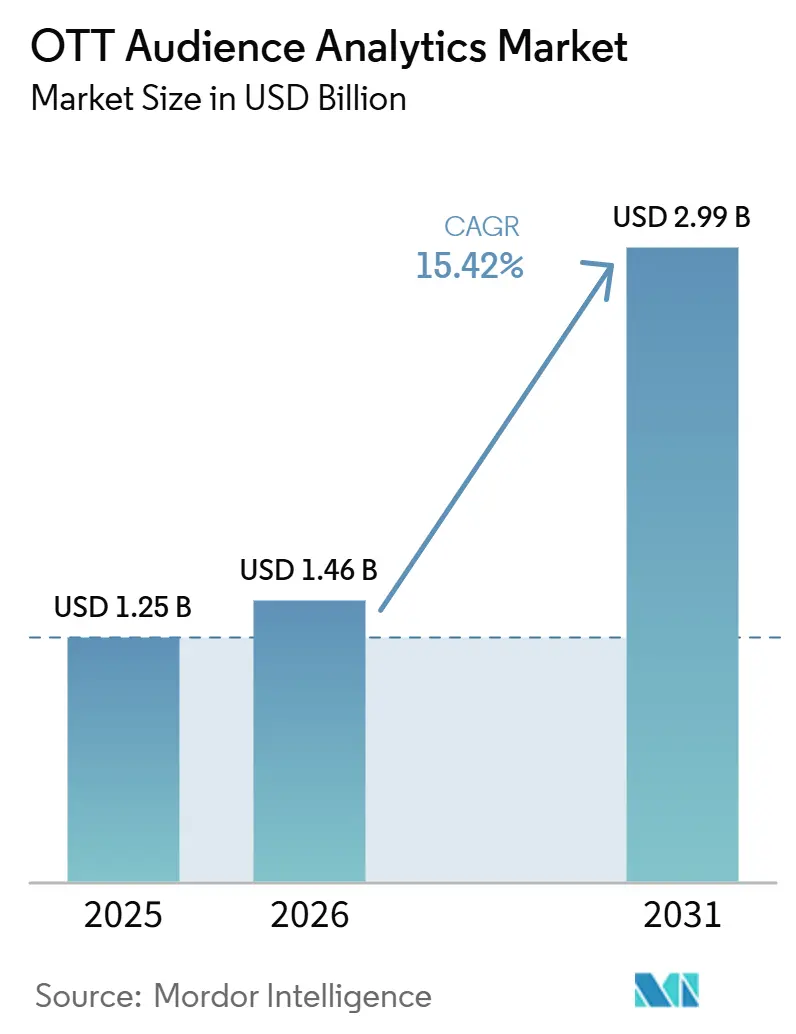
The OTT audience analytics market size is projected to grow from USD 1.25 billion in 2025 to USD 2.99 billion by 2031, at a CAGR of 15.42% from 2026 to 2031. The OTT audience analytics market is benefiting from the movement of advertising budgets toward measurable connected TV inventory, which has made audience delivery, attribution, and campaign verification central to media buying. In the United States, streaming represented 48.6% of total TV watch time in May 2026, which supports the need for measurement across an expanding set of viewing environments. The OTT audience analytics market also faces a more demanding buyer base as agencies seek reliable audience guarantees, brand safety controls, and post-campaign accountability for connected TV campaigns. Fragmented viewing signals and restricted access to platform data favor providers that can link audiences across services while respecting consent requirements. The opportunity for the OTT audience analytics market therefore depends on combining measurement, subscriber intelligence, content performance, and quality-of-experience data within workflows that customers can use every day.
Key Report Takeaways
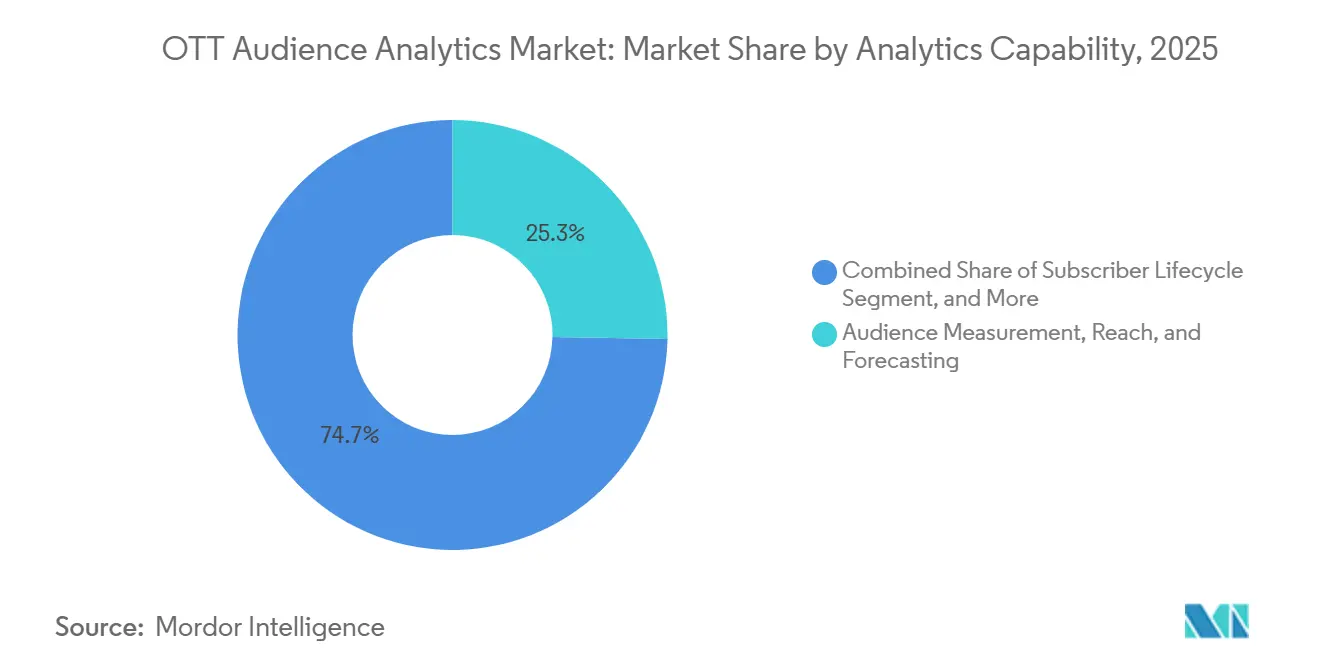
- By analytics capability, Audience Measurement, Reach and Forecasting held 25.30% of the OTT audience analytics market share in 2025, while Advertising Audience and Campaign Analytics is projected to expand at a 15.85% CAGR through 2031.
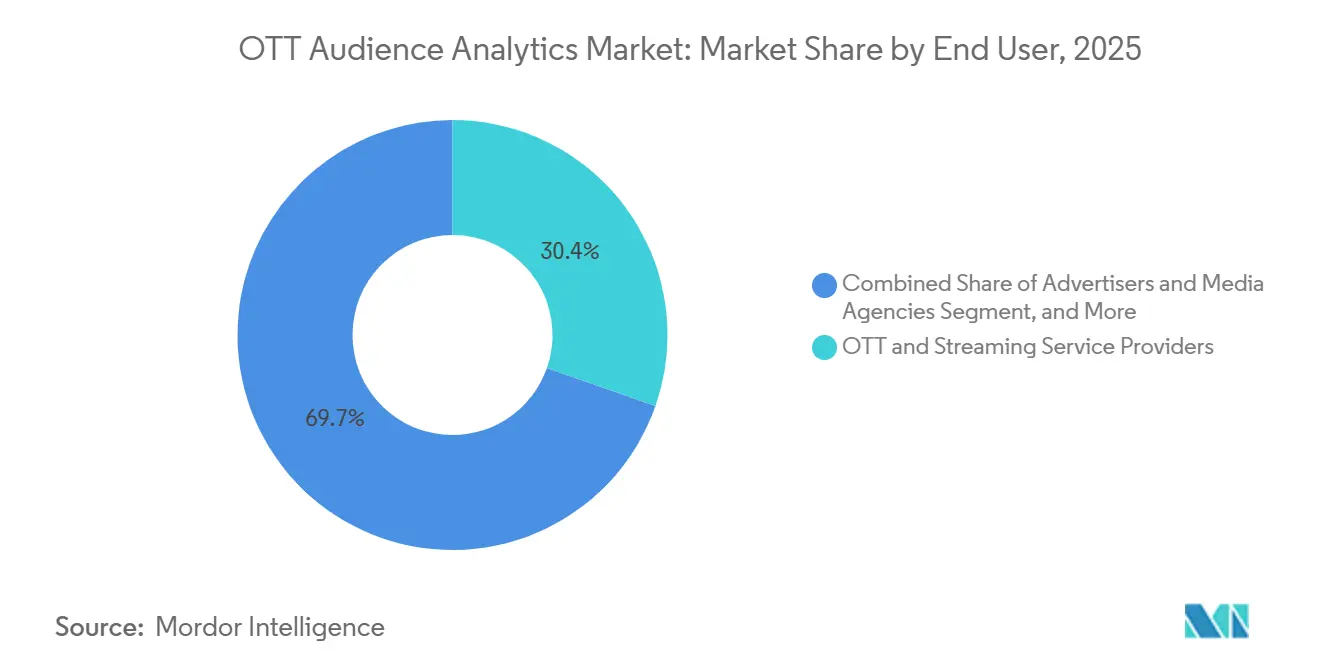
- By end user, OTT and Streaming Service Providers accounted for 30.35% of revenue in 2025, while Broadcasters, Networks and FAST Operators are expected to grow at a 15.94% CAGR through 2031.
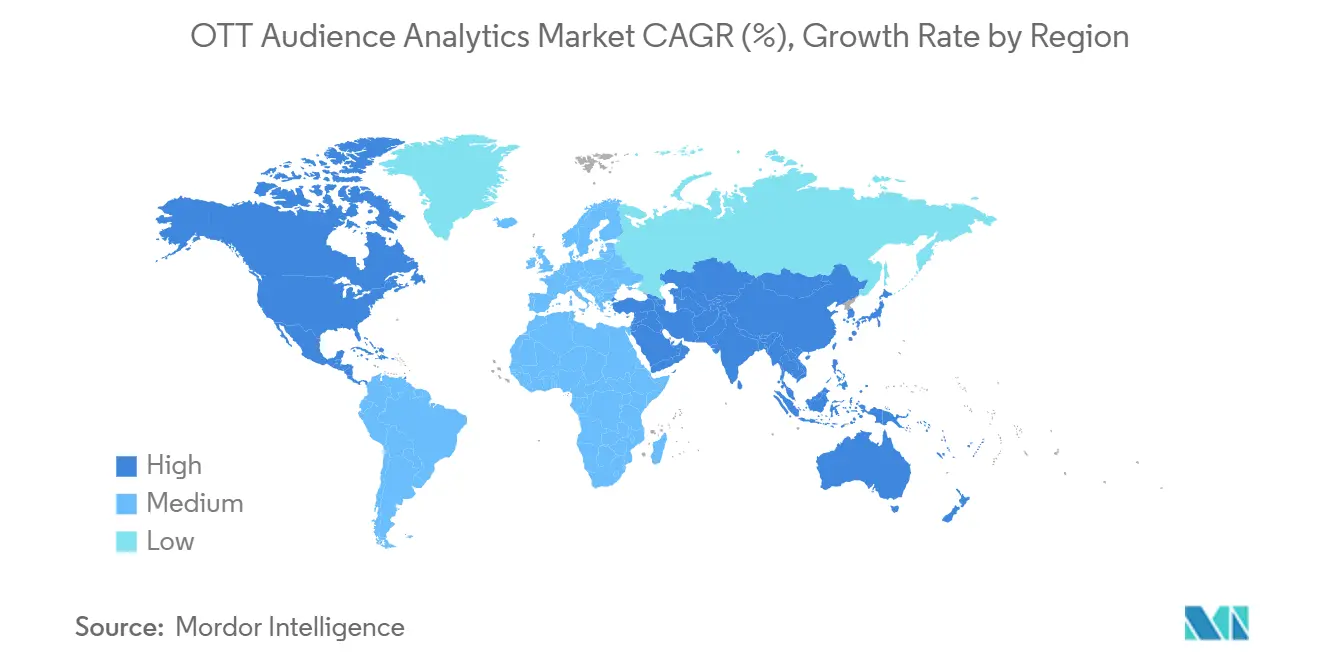
- By geography, North America commanded 45.50% of revenue in 2025, while Asia-Pacific is projected to be the fastest-growing region in the OTT audience analytics market and to grow at a 15.89% CAGR through 2031.
Note: Market size and forecast figures in this report are generated using Mordor Intelligence’s proprietary estimation framework, updated with the latest available data and insights as of January 2026.
Market Trends and Insights
Drivers Impact Analysis of OTT Audience Analytics Market*
| Driver | (~) % Impact on CAGR Forecast | Geographic Relevance | Impact Timeline |
|---|---|---|---|
| Advertising Budget Migration to Measurable Connected TV | +4.5% | Global, with North America and Europe as primary markets | Short term (≤ 2 years) |
| Streaming Fragmentation and Demand for Unified Audience Intelligence | +3.2% | Global, with Asia-Pacific and North America as early adopters | Medium term (2-4 years) |
| AI-Enabled Personalization and Predictive Churn Management | +2.8% | North America and Asia-Pacific, with spillover to Europe | Medium term (2-4 years) |
| Real-Time Quality-of-Experience Signals as Commercial KPIs | +2.0% | North America and Europe, with Asia-Pacific scaling rapidly | Medium term (2-4 years) |
| Cross-Market Content Planning Using Anonymized Viewing Logs | +1.5% | Asia-Pacific, Europe, and South America | Long term (≥ 4 years) |
| Attention-Based and Outcome-Based Measurement Currencies | +1.2% | North America and Europe | Short term (≤ 2 years) |
| Source: Mordor Intelligence | |||
Migration of Advertising Budgets Toward Measurable Connected TV Inventory
The OTT audience analytics market is gaining from a shift of linear television budgets into connected TV inventory. Among advertisers that plan to increase connected TV and OTT spending in 2026, 54% identified linear TV reallocation as the funding source, while 40% cited print and radio and 25% cited new budget growth.[1]Interactive Advertising Bureau, “2026 IAB Digital Video Ad Spend and Strategy Full Report,” Interactive Advertising Bureau, iab.com Those transferred budgets bring established expectations around audience delivery, brand safety, and campaign accountability. Analytics providers need to make verification and attribution part of the operating workflow rather than separate reporting products. This raises the value of tools that can document viewability, outcomes, and audience delivery during a campaign. The IAB’s Open Measurement Software Development Kit and SupplyChain framework are relevant standards for buyers that want more consistent controls across the digital video supply chain.
Streaming Fragmentation Increasing Demand for Unified Audience Intelligence
The OTT audience analytics market is responding to viewing that is spread across many streaming services and devices. A single platform can measure activity within its own service, but advertisers and agencies still need deduplicated views of audiences across services. The IAB’s Project Eidos seeks to replace channel-level measurement with more interoperable approaches that use shared taxonomies and privacy-resilient measurement inputs. This need puts greater emphasis on products that can connect viewing data without treating each service as an isolated environment. Providers with panel-calibrated cross-device linkage and direct access to viewership data can offer a more usable basis for cross-platform reporting. Providers relying mainly on probabilistic matching face pressure when differences in linkage quality can be tested through industry certification processes.
AI-Enabled Personalization and Predictive Churn Management
The OTT audience analytics market is being shaped by platforms that use behavior data to identify subscribers at risk of leaving. These systems move retention activity away from broad campaigns and toward interventions based on viewing patterns, login frequency, and completion behavior. The requirement is not limited to reporting because the data must be available to recommendation systems and campaign tools with little delay. This broadens demand for analytics products that bring subscriber lifecycle data together with content and advertising information. Netflix’s 2025 launch of natural-language search supported more detailed recommendation signals than static genre navigation alone. The resulting increase in behavioral data strengthens the case for analytics systems that can organize and activate those signals across the subscriber journey.
Real-Time Quality-of-Experience Signals Becoming Commercial KPIs
The OTT audience analytics market is also influenced by the commercial use of quality-of-experience data. Buffering, startup time, and bitrate stability are important when publishers sell live content and need to support the value of their advertising inventory. In 2026, 93% of buyers considered live content more valuable than other digital video, with viewer attention and business outcomes cited as key reasons. Publishers can use continuous telemetry to identify delivery issues before they affect campaign performance or advertiser confidence. This makes real-time processing and alerting relevant to revenue protection as well as engineering operations. Amagi reported 55% year-over-year growth in FAST viewing hours through June 2026, which increases the importance of consistent delivery and usable metadata across streaming channels.[2]Amagi, “Amagi Releases June 2026 AIRTIME Report, FAST Viewing Hours Grow 55% YoY as Metadata Friction Escalates,” Amagi, amagi.com
Restraints Impact Analysis of OTT Audience Analytics Market*
| Restraint | (~) % Impact on CAGR Forecast | Geographic Relevance | Impact Timeline |
|---|---|---|---|
| Privacy Regulation and Consent-Governance Complexity | -2.8% | European Union, California, India, with spillover to Asia-Pacific and South America | Short term (≤ 2 years) |
| Fragmented Identity, Measurement, and Interoperability Standards | -2.3% | Global, most acute in North America and Europe | Medium term (2-4 years) |
| High-Cardinality Data and Edge-Processing Cost | -1.5% | Global, most acute in Asia-Pacific and South America | Medium term (2-4 years) |
| Limited Access to Walled-Garden and Platform-Native Signals | -1.1% | Global | Long term (≥ 4 years) |
| Source: Mordor Intelligence | |||
Privacy Regulation and Consent-Governance Complexity
Privacy and consent requirements affecting the OTT audience analytics market limit the data that streaming analytics providers can collect and use, particularly in Europe and emerging markets. This can reduce the volume of usable signals for audience models and make deployment more complex for OTT operators. Smaller providers can face greater compliance burdens because they must adapt products and governance processes for different jurisdictions. The effect is especially important where vendors want to use device-level or IP-derived data for audience segmentation. India’s Digital Personal Data Protection Act also creates data-localization considerations for providers serving local and regional streaming operators. The OTT audience analytics market must therefore support more localized data practices while preserving the utility of audience measurement.
Fragmented Identity, Measurement, and Interoperability Standards
The OTT audience analytics market faces the absence of a universal identity standard continues to restrict cross-platform audience measurement. CIMM found in April 2026 that hashed email-to-postal matching averaged 51% accuracy, while inference-based IP-to-household linkage performed less reliably.[3]Coalition for Innovative Media Measurement, “Identity Infrastructure 2.0 for Converged TV,” Coalition for Innovative Media Measurement, cimm-us.org This leaves a meaningful share of open connected TV impressions without deterministic attribution. The IAB also reported that fewer than 60% of connected TV ad buyers had high confidence in the legitimate source and placement of their advertisements. Vendors must keep recalibrating products as policies on cookies, device identifiers, and platform signals change. That work raises maintenance costs for providers that lack deterministic household data or direct first-party signals.
*Our forecasts treat driver/restraint impacts as directional, not additive. The impact forecasts reflect baseline growth, mix effects, and variable interactions.
OTT Audience Analytics Market Segment Analysis
By Analytics Capability:
Advertising Analytics Builds on Measurement FoundationsAudience Measurement, Reach and Forecasting held 25.30% of the OTT audience analytics market size in 2025. The segment remains the primary measurement foundation for linear television and connected TV negotiations. Agencies and broadcasters have long used reach-based measures in planning and trading workflows. This established use continues even as customers adopt more outcome-based measurement approaches. Advertising Audience and Campaign Analytics is projected to expand at a 15.85% CAGR through 2031. The segment benefits from the maturation of programmatic connected TV buying and the demand for targeting, verification, and campaign reporting.
Programmatic buying accounted for 50% of connected TV and OTT advertising in 2026, placing greater value on analytics that can operate within media buying workflows.[4]Interactive Advertising Bureau, “2026 IAB Digital Video Ad Spend and Strategy Full Report,” Interactive Advertising Bureau, iab.com Content Performance and Programming Analytics supports decisions on renewal, windowing, and distribution through completion and episode-level engagement data. Subscriber Lifecycle and Retention Analytics helps platforms use behavior patterns to identify customers who may need timely retention offers. Audience Segmentation and Behavioral Analytics helps advertisers address defined cohorts and helps content teams construct personalization models. Product Experience and Audience QoE Analytics is gaining attention as live and FAST services connect delivery quality with advertising value. Buyers also see potential uses for agentic AI in media planning, buying recommendations, and inventory discovery, all of which require structured audience data.



By End User:
Broadcasters and FAST Operators Increase Analytics SpendingOTT and Streaming Service Providers held 30.35% of the OTT audience analytics market size in 2025. Their spending covers subscriber retention, content programming, advertising, and quality-of-experience functions. Large services commonly use analytics across these areas at the same time. That breadth makes their per-platform requirements higher than those of many other end-user groups. Broadcasters, Networks and FAST Operators are projected to grow at a 15.94% CAGR through 2031. Their demand reflects a move from ratings-only systems toward cross-platform measurement that can support inventory pricing against streaming alternatives.
Nielsen’s Big Data + Panel methodology received MRC accreditation in January 2025, giving broadcasters a hybrid person-level measurement option for the 2025-2026 broadcast season. Comscore launched daily program-level reporting with deduplicated cross-platform insights in January 2026, which supports scheduling and syndication decisions. Advertisers and media agencies are increasing their use of analytics as connected TV measurement becomes more suitable for campaign optimization. Content owners, studios, and rights holders use demand data to inform licensing and distribution discussions. Telecom and pay-TV operators provide a steady customer base, especially where bundled OTT services are used for subscriber acquisition. The OTT audience analytics industry must support these varied workflows while allowing advertising data to move through compliant programmatic supply chains.
Geography Analysis
North America OTT Audience Analytics Market
North America accounted for 45.50% of the OTT audience analytics market share in 2025. The OTT audience analytics market in the region has extensive connected TV advertising infrastructure and frequent purchasing of measurement, attribution, and audience verification tools. The Joint Industry Committee certified Comscore, iSpot, and VideoAmp as alternative currencies for the 2025-2026 broadcast season, expanding the range of measurement options used by buyers. Canada and Mexico add demand as streaming platforms increase their local operations and need local audience measurement.
Europe OTT Audience Analytics Market
Europe was the second-largest regional contributor to the OTT audience analytics market in 2025. Its demand is supported by mature streaming use, although privacy requirements can raise the cost and complexity of data collection. Germany requires prior consent for certain client-side analytics tracking under Section 25 of the Telecommunications Digital Services Data Protection Act. Analytics providers in Europe must balance measurement coverage with the governance requirements of individual national markets.
APAC, South America and MEA OTT Audience Analytics Market
Asia-Pacific is projected to expand at a 15.89% CAGR through 2031, making it the fastest-growing region in the OTT audience analytics market. Its scale comes from a large streaming viewer base and continuing growth in online video revenue. India’s privacy framework requires vendors to consider localized data processing, which can favor providers with local operating capabilities. China uses a distinct data environment that combines video, messaging, and payment activity. South America offers growing demand as streaming revenue rises and pay television loses relative importance. The Middle East and Africa remain earlier-stage opportunities, where government-linked media entities, telecom bundles, and uneven infrastructure shape the pace of analytics adoption.

Competitive Landscape
The OTT audience analytics market is moderately fragmented at the platform level, although individual analytics functions can be concentrated among a small number of established providers. Nielsen remains a major provider in national television measurement after the MRC accreditation of its Big Data + Panel methodology. Comscore, iSpot, and VideoAmp offer alternative measurement currencies used in television and connected TV transactions. CIMM identifies deterministic household identity as a central requirement for converged television measurement. Providers with smart TV data, opt-in panels, or other direct viewership sources have a stronger basis for this work.
Product capabilities in the OTT audience analytics market are increasingly differentiated by automation and the speed at which data can be used. In July 2026, Nielsen launched Ad Intel AI to organize advertising information across 5.5 million brands, 4.6 million advertisers, 23 media types, and more than 90 markets. In January 2026, Comscore introduced daily program-level reporting with deduplicated insights across connected TV and linear television. In May 2026, Amagi launched an in-content advertising marketplace through ADS PLUS, extending its streaming advertising offering. These moves show that competitors are integrating data, measurement, and activation functions rather than maintaining separate products.
Open needs in the OTT audience analytics market remain in unified identity across FAST, linear television, and streaming environments. Attention-integrated analytics may become more important as buyers look beyond viewability toward audience response. Privacy-safe cross-border measurement is another area where providers can differentiate their products. The OTT audience analytics industry is likely to retain both large measurement providers and specialists that address a specific data or workflow gap.
OTT Audience Analytics Industry Leaders
The Nielsen Company
Comscore, Inc.
Samba TV, Inc.
Conviva Inc.
Google LLC
- *Disclaimer: Major Players sorted in no particular order
OTT Audience Analytics Market Companies Covered in this Report
- The Nielsen Company
- Comscore, Inc.
- Kantar Media Audiences Limited
- Samba TV, Inc.
- iSpot.tv, Inc.
- TVision Insights, Inc.
- Google LLC
- Adobe Inc.
- Oracle Corporation
- Conviva Inc.
- NicePeopleAtWork S.L.
- Amagi Corporation
- Parrot Analytics Limited
- RealityMine Limited
- MediaMelon, Inc.
- Innovid Corp.
- Roku, Inc.
- Xperi Inc.
- Akamai Technologies, Inc.
- Brightcove Inc.

Recent Industry Developments in OTT Audience Analytics Market
- July 2026: Nielsen launched Ad Intel AI, an AI-powered platform monitoring 5.5 million brands and 4.6 million advertisers across 23 media types in 90+ international markets. The product transforms fragmented advertising data into real-time competitive intelligence, accessible via Model Context Protocol for client-built agents. Nielsen identified it as the first product in a planned expansion to AI-powered decisioning across the advertising ecosystem.
- July 2026: Cint expanded its partnership with Samba to extend brand lift measurement to Australia, Canada, France, Germany, Italy, and Spain. The expansion uses Samba’s deterministic television exposure data in Cint’s Lucid Measurement platform. It enables real-time in-flight brand impact measurement for linear and streaming campaigns in markets that had fewer third-party lift analytics options.
- June 2026: Samba acquired Bestever AI, a generative AI platform built for advertisers, and brought its founder and team into Samba’s product organization. The acquisition strengthens Samba’s ability to translate campaign briefs and creative signals into real-time connected TV inventory packages for programmatic buying.
- June 2026: Nielsen announced a collaboration with Mediaocean to integrate its Big Data + Panel advanced audience segments directly into Mediaocean’s Prisma platform. The integration is set to go live for the Fall 2026 TV season in September and enables data-driven linear campaign planning with person-level audience segmentation at the point of media buy.


Global OTT Audience Analytics Market Report Scope
The Global OTT Audience Analytics Market refers to the industry focused on software platforms, tools, and services that collect, measure, analyze, and interpret viewer data generated across over-the-top (OTT) streaming platforms delivered via the internet.
The OTT Audience Analytics Market Report is Segmented by Analytics Capability (Audience Measurement, Reach, and Forecasting, Audience Segmentation and Behavioral Analytics, Content Performance and Programming Analytics, Advertising Audience and Campaign Analytics, Subscriber Lifecycle and Retention Analytics, and Product Experience and Audience QoE Analytics), End User (OTT and Streaming Service Providers, Broadcasters, Networks, and FAST Operators, Advertisers and Media Agencies, Content Owners, Studios, and Rights Holders, and Telecom and Pay-TV Operators), and Geography (North America, South America, Europe, Asia-Pacific, Middle East, and Africa). The Market Forecasts are Provided in Terms of Value (USD).
| Audience Measurement, Reach, and Forecasting |
| Audience Segmentation and Behavioural Analytics |
| Content Performance and Programming Analytics |
| Advertising Audience and Campaign Analytics |
| Subscriber Lifecycle and Retention Analytics |
| Product Experience and Audience QoE Analytics |
| OTT and Streaming Service Providers |
| Broadcasters, Networks, and FAST Operators |
| Advertisers and Media Agencies |
| Content Owners, Studios, and Rights Holders |
| Telecom and Pay-TV Operators |
| North America | United States |
| Canada | |
| Mexico | |
| South America | Brazil |
| Argentina | |
| Rest of South America | |
| Europe | United Kingdom |
| Germany | |
| France | |
| Italy | |
| Spain | |
| Russia | |
| Rest of Europe | |
| Asia-Pacific | China |
| Japan | |
| India | |
| South Korea | |
| Australia and New Zealand | |
| Rest of Asia-Pacific | |
| Middle East | Turkey |
| Saudi Arabia | |
| United Arab Emirates | |
| Rest of Middle East | |
| Africa | South Africa |
| Nigeria | |
| Egypt | |
| Rest of Africa |
| By Analytics Capability | Audience Measurement, Reach, and Forecasting | |
| Audience Segmentation and Behavioural Analytics | ||
| Content Performance and Programming Analytics | ||
| Advertising Audience and Campaign Analytics | ||
| Subscriber Lifecycle and Retention Analytics | ||
| Product Experience and Audience QoE Analytics | ||
| By End User | OTT and Streaming Service Providers | |
| Broadcasters, Networks, and FAST Operators | ||
| Advertisers and Media Agencies | ||
| Content Owners, Studios, and Rights Holders | ||
| Telecom and Pay-TV Operators | ||
| By Geography | North America | United States |
| Canada | ||
| Mexico | ||
| South America | Brazil | |
| Argentina | ||
| Rest of South America | ||
| Europe | United Kingdom | |
| Germany | ||
| France | ||
| Italy | ||
| Spain | ||
| Russia | ||
| Rest of Europe | ||
| Asia-Pacific | China | |
| Japan | ||
| India | ||
| South Korea | ||
| Australia and New Zealand | ||
| Rest of Asia-Pacific | ||
| Middle East | Turkey | |
| Saudi Arabia | ||
| United Arab Emirates | ||
| Rest of Middle East | ||
| Africa | South Africa | |
| Nigeria | ||
| Egypt | ||
| Rest of Africa | ||


Key Questions Answered in the Report
What is the size of the OTT audience analytics market?
The market is projected to grow from USD 1.25 billion in 2025 to USD 2.99 billion by 2031, at a 15.42% CAGR.
What is driving demand for OTT audience analytics solutions?
Connected TV budget migration, fragmented viewing across services, churn management, and the commercial use of quality-of-experience data are supporting demand across current viewing and advertising workflows.
Which analytics capability is growing fastest?
Advertising Audience and Campaign Analytics is projected to expand at a 15.85% CAGR through 2031.
Which end users account for the largest demand?
OTT and Streaming Service Providers held 30.35% of revenue in 2025 because they use analytics for content, subscriber management, advertising, and delivery quality optimization.
Which region is growing fastest for OTT audience analytics?
Asia-Pacific is projected to be the fastest-growing region in the OTT audience analytics market, with a 15.89% CAGR through 2031, supported by a large streaming audience and online video growth.
What limits adoption of audience analytics platforms?
Consent regulations, inconsistent identity standards, data processing costs, and limited access to platform-native signals can reduce measurement coverage and increase operational complexity.
Page last updated on:





