
Market Overview
| Study Period | 2020 - 2031 |
|---|---|
| Forecast Data Period | 2026 - 2031 |
| Base Year Market Size (2025) | USD 1040 Trillion |
| Market Size (2026) | USD 1.1 Trillion |
| Market Size (2031) | USD 1.42 Trillion |
| Growth Rate (2026 - 2031) | 5.36 % |
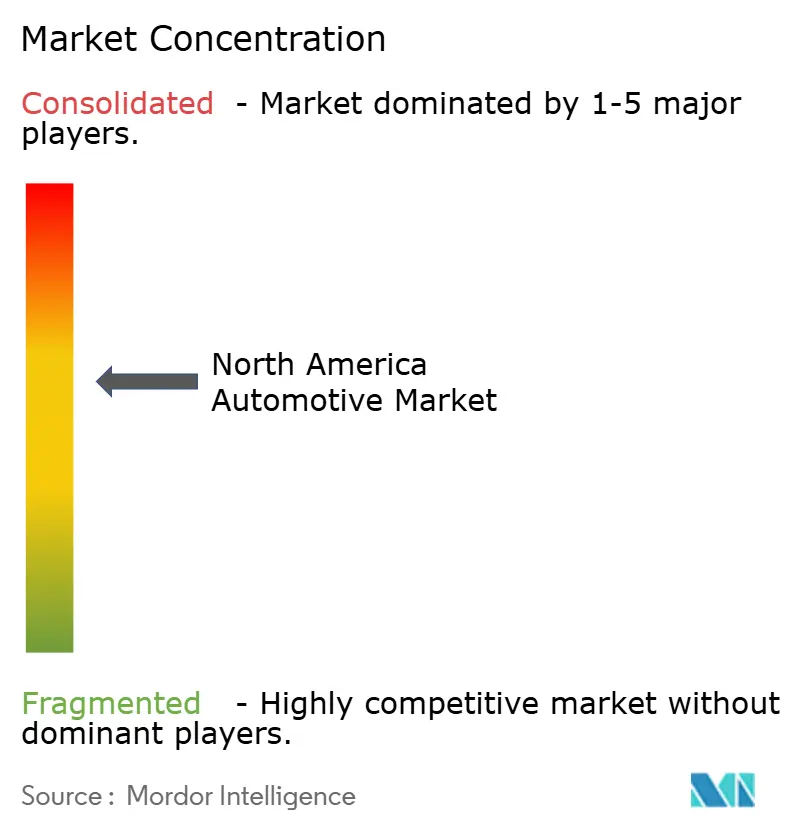
| Market Concentration | Medium |
Major Players *Disclaimer: Major Players sorted in no particular order Image © Mordor Intelligence. Reuse requires attribution under CC BY 4.0. | |
North America Automotive Market Analysis by Mordor Intelligence
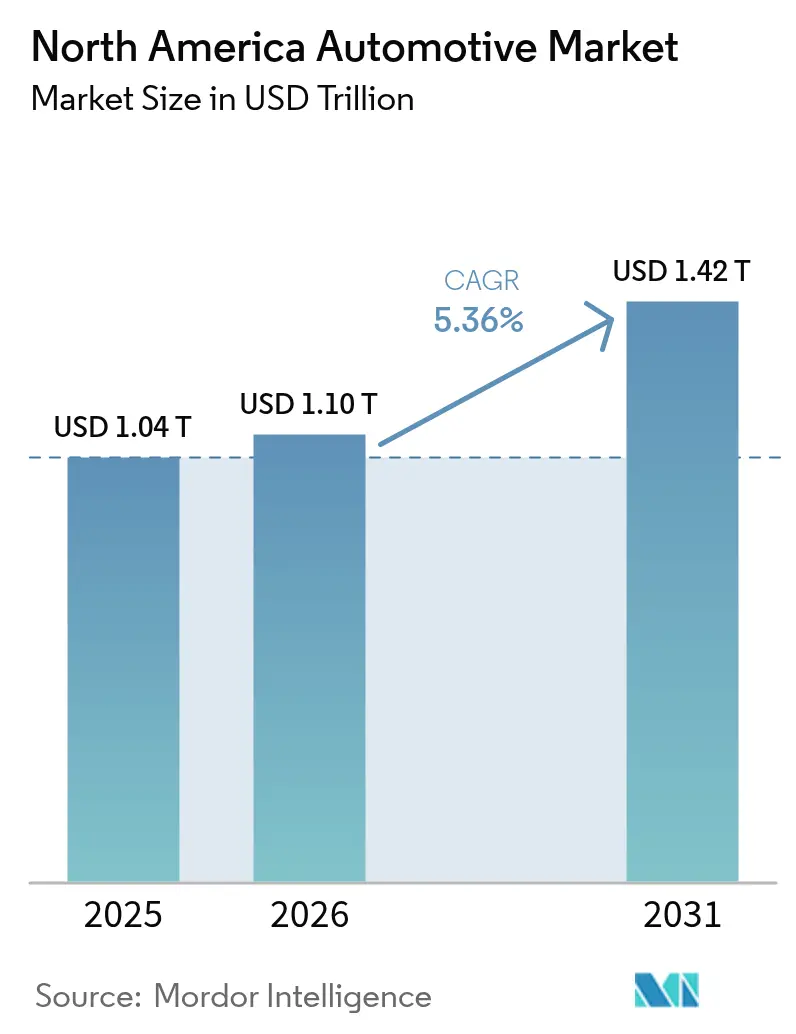
The North America automotive market size was valued at USD 1040 billion in 2025 and estimated to grow from USD 1095.7 billion in 2026 to reach USD 1422.2 billion by 2031, at a CAGR of 5.36% during the forecast period (2026-2031). Robust federal and provincial zero-emission vehicle mandates and fiscal incentives in the Inflation Reduction Act underpin the projected expansion. Automakers are localizing battery and vehicle production at unprecedented speed, balancing short-term profitability from light-truck and SUV sales with long-term electrification commitments. Commercial vehicle electrification is accelerating as fleet operators prioritize total cost-of-ownership gains, while direct-to-consumer sales models pressure entrenched dealer networks. Intensifying tariff policies and critical-mineral bottlenecks remain near-term headwinds.
Key Report Takeaways
- By vehicle type, passenger cars led with 68.63% revenue share in 2025, while medium- and heavy-commercial vehicles are on track for an 8.22% CAGR through 2031.
- By propulsion, internal-combustion vehicles captured 82.11% share of the North America automotive market size in 2025, whereas battery-electric vehicles are advancing at a 9.58% CAGR to 2031.
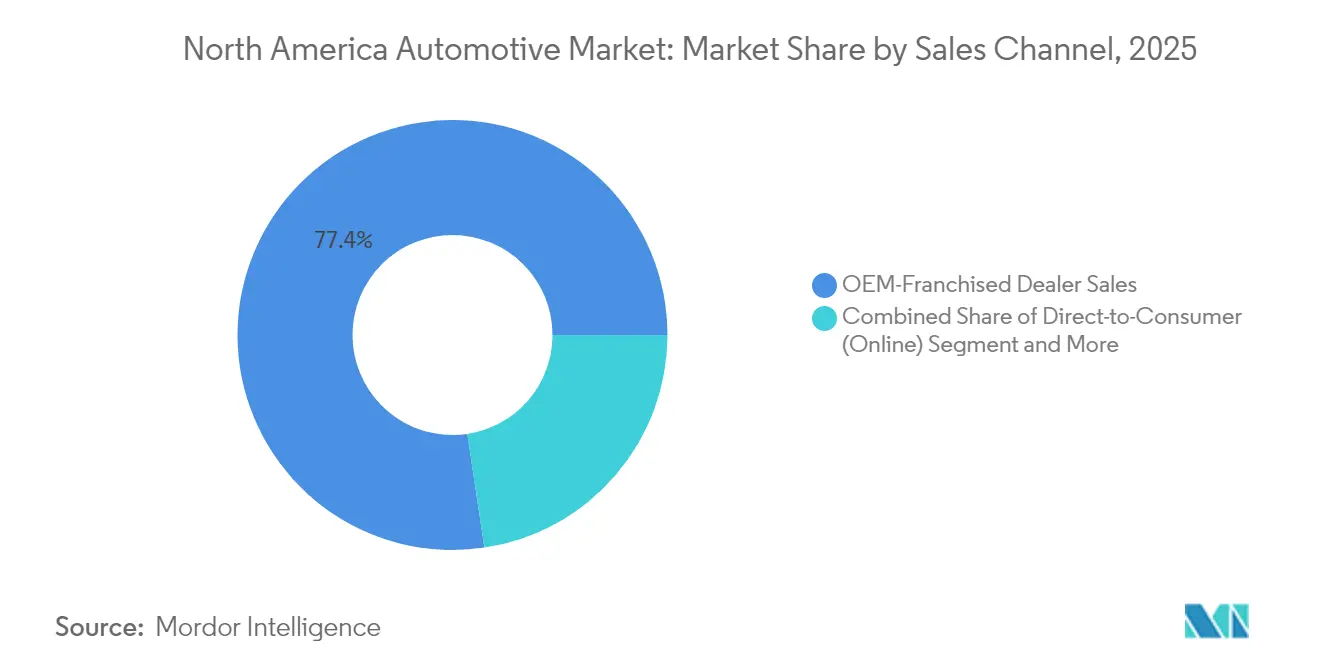
- By sales channel, franchised dealers held 77.37% of the North America automotive market share in 2025, but direct-to-consumer models are expanding 8.7% annually over the forecast period.
- By level of automation, Level 0–1 systems controlled 87.79% share in 2025, yet Level 4–5 autonomous platforms are poised for a 10.48% CAGR to 2031.
- By geography, the United States accounted for 78.21% of 2025 revenue, whereas Rest-of-North America is forecast to grow at a 7.12% CAGR through 2031.
Note: Market size and forecast figures in this report are generated using Mordor Intelligence’s proprietary estimation framework, updated with the latest available data and insights as of 2026.
Market Trends and Insights
Drivers Impact Analysis of North America Automotive Market*
| Driver | (~) % Impact on CAGR Forecast | Geographic Relevance | Impact Timeline |
|---|---|---|---|
| Federal and State ZEV Mandates | +1.2% | United States, Canada, spillover to Mexico | Medium term (2-4 years) |
| Battery “Auto-Alley” Localization | +1.1% | United States Midwest, Ontario, Northern Mexico | Long term (≥ 4 years) |
| NEVI-Funded EV-Charging Build-Out | +0.9% | United States with cross-border corridors | Medium term (2-4 years) |
| Falling Auto-loan Rates and Pent-up Demand | +0.8% | United States, Canada | Short term (≤ 2 years) |
| Light-truck/SUV Mix Shift Lifts Margins | +0.7% | Region-wide suburban markets | Short term (≤ 2 years) |
| Software-Defined-Vehicle Revenue Model | +0.6% | Early uptake in North America | Long term (≥ 4 years) |
| Source: Mordor Intelligence | |||
Federal and State ZEV Mandates
California’s Advanced Clean Cars II regulation requires 35% zero-emission sales by 2026 and 100% by 2035; eleven additional states and Washington, D.C. have adopted identical timelines[1]“Advanced Clean Cars II,”, California Air Resources Board, arb.ca.gov. Canada’s federal ZEV rule mirrors the 2035 deadline with interim 20% and 60% milestones for 2026 and 2030, respectively[2]“Electric Vehicle Regulations,”, Transport Canada, tc.gc.ca. Proposed U.S. EPA limits push 30% zero-emission medium- and heavy-truck sales by 2030, rising to 100% by 2040. Credit banking lets early movers monetize compliance, whereas laggards face increasing penalties. The mandate architecture, therefore, rewards proactive electrification investments and accelerates supplier realignment across North America automotive market participants.
Battery “Auto-Alley” Localization
Cumulative North American battery supply-chain commitments topped USD 250 billion by end-2023, with cell plants positioned a median 284 miles from final assembly sites. Cell fabrication absorbs roughly half of the outlays, with upstream mineral processing and downstream EV assembly splitting the remainder. Canada rose first in the lithium-ion supply-chain ranking, buoyed by Honda’s CAD 15 billion integrated complex slated for 2028. Parallel Mexican projects, such as BMW’s USD 800 million San Luis Potosí expansion, secure cost-competitive capacity while preserving USMCA trade eligibility. Localized clusters mitigate logistics expense and tariff risk across the North America automotive market.
NEVI-Funded EV-Charging Build-Out
The USD 5 billion National Electric Vehicle Infrastructure program now places fast chargers in the U.S. corridors. Grants cover up to 80% of capital costs and impose 24/7 uptime plus contactless-payment standards that normalize user experience[3]“National Electric Vehicle Infrastructure Formula Program,”, U.S. Department of Transportation, dot.gov. Utilities have earmarked funds for distribution upgrades, integrating vehicle-grid interaction at scale. Equitable site selection broadens demographic reach, yet peak-hour congestion is surfacing, prompting private operators to pilot dynamic-pricing models. Reliable public charging remains a pivotal adoption lever within the North America automotive market.
Software-Defined-Vehicle Revenue Model
Connected-services subscriptions could deliver USD 1,600 recurring revenue per vehicle annually. Over-the-air updates cut warranty costs and unlock post-sale feature monetization. Two-thirds of North American OEMs already deploy OTA capabilities, indicating an early-adopter advantage in the North America automotive market.
Restraints Impact Analysis of North America Automotive Market*
| Restraint | (~) % Impact on CAGR Forecast | Geographic Relevance | Impact Timeline |
|---|---|---|---|
| Vehicle Affordability Squeeze | -1.4% | Region-wide middle-income segments | Short term (≤ 2 years) |
| Tariff Brinkmanship Under USMCA Review | -1.1% | United States-Mexico cross-border trade | Short term (≤ 2 years) |
| Chip and Battery-grade Mineral Bottlenecks | -0.9% | Acute North American exposure | Medium term (2-4 years) |
| Peak-hour “charging-queue” Anxiety | -0.6% | United States urban and highway corridors | Medium term (2-4 years) |
| Source: Mordor Intelligence | |||
Vehicle Affordability Squeeze
Record transaction prices have pushed average monthly payments to historic highs, sidelining a swath of mainstream buyers. Rising incentives strain margins yet fail to restore affordability. Leasing costs have climbed sharply since 2023, nudging consumers toward used-vehicle substitutes. The pinch is most acute for battery-electric models whose upfront premiums outweigh lifetime savings for many households. Although falling interest-rate expectations offer relief, price sensitivity will cap near-term volume upside in the North America automotive market.
Peak-Hour “Charging-Queue” Anxiety
Fast-charging congestion now downgrades customer experience, with some U.S. sites fully utilized 20% of the time. The national ratio of EVs to public fast chargers lags other leading markets, intensifying wait-time concerns. Queue anxiety threatens to slow mass-market BEV adoption unless reliability and throughput improve.
*Our forecasts treat driver/restraint impacts as directional, not additive. The impact forecasts reflect baseline growth, mix effects, and variable interactions.
North America Automotive Market Segment Analysis
By Vehicle Type:
Commercial Electrification Drives GrowthMedium—and heavy-commercial vehicles, though smaller in absolute volume, expand at 8.22% CAGR through 2031, materially outpacing passenger cars’ dominion in the North American automotive market. A regulatory push—California’s Advanced Clean Trucks rule and U.S. EPA proposals—targets 100% zero-emission truck sales by 2040. Fleet buyers embrace electrification, where charging can be centralized and duty cycles predictable.
Passenger cars still anchor 68.63% 2025 revenue but contend with affordability pressures and rising compliance outlays. Plant retooling for multi-powertrain flexibility enables manufacturers to modulate output amid shifting demand. Total cost-of-ownership parity for zero-emission trucks by 2035 will further tilt investment toward commercial applications, reinforcing structural growth in this segment of the North America automotive market.




By Propulsion Type:
ICE Transition AcceleratesInternal-combustion powertrains command an 82.11% share in 2025; however, battery-electric vehicles will capture incremental gains at 9.58% CAGR, supported by up to USD 7,500 clean-vehicle tax credits. Hybrid models act as a bridge technology, with Ford reporting double-digit hybrid sales gains in 2024.
Plug-in hybrids provide range assurance for long-distance drivers while meeting partial electrification quotas. Fuel-cell offerings remain niche, limited by hydrogen infrastructure gaps. Propulsion diversification allows OEMs to de-risk capital allocation while scaling batteries and software platforms central to the evolving North America automotive market size.
By Sales Channel:
Direct-Consumer Models Disrupt Traditional NetworksFranchised dealers hold 77.37% share today, yet direct-to-consumer deliveries grow 8.7% annually as brands pursue higher margins and richer data sets. Tesla illustrates the economic upside of bypassing dealerships, even as certain EV startups revert to hybrid approaches to control delivery costs. Premium EV brands capture point margin uplift via direct models, an incentive likely to resonate across the broader North America automotive market.
Dealer survival hinges on digital engagement and EV-specific service competence. As software-defined vehicles reduce mechanical service frequency, revenue mixes shift toward diagnostics, accessory sales, and subscription facilitation. Shared data platforms between OEMs and retailers will define customer-experience leadership in the coming decade.
By Level of Automation:
Regulatory Frameworks Enable Gradual DeploymentLevel 0–1 driver-assistance systems dominated with an 87.79% share in 2025, but Level 4–5 autonomous features grew at a 10.48% CAGR through 2031. Waymo surpassed 4 million paid robotaxi rides in 2024, broadening service to multiple U.S. metros.
Level 2 partial-automation suites are standard in many new nameplates, acclimatizing consumers to higher autonomy. Regulatory clarity on liability and safety validation remains the gating factor for large-scale L3 and L4 deployment. OEM alliances with tech firms accelerate software stack development, ensuring the North America automotive market retains leadership in self-driving innovation.
Geography Analysis
United States Automotive Market
The United States accounted for 78.21% of 2025 revenue, buoyed by NEVI investments and domestic-content incentives that reroute global supply chains toward local production. Light-vehicle sales climbed to 15.851 million units, with GM expanding capacity above 2 million vehicles annually through USD 4 billion plant upgrades. Toyota and Hyundai committed multi-billion-dollar spending to secure battery and final assembly footprints that anchor the North America automotive market size for the next generation of vehicles.
Canada Automotive Market
Canada leverages plentiful critical minerals and renewable energy to ascend the global battery-supply-chain index. More than CAD 46 billion in cumulative automotive commitments since 2020 include Honda’s CAD 15 billion complete EV value chain, featuring 36 GWh annual cell output. However, national vehicle output remains below pre-pandemic highs. Fresh capacity targets mid-decade ramp-ups that will widen Canada’s role in the North American automotive market.
Mexico Automotive Market
The rest of North America, led by Mexico, grows at a 7.12% CAGR as near-shoring trends and wage arbitrage draw substantial FDI. Mexico’s cost advantage and USMCA compliance attract marquee projects from BMW, Stellantis, and Volvo. Firmly embedding Mexico within the integrated regional ecosystem that defines the North American automotive market share trajectory.
Regulatory Landscape
Emissions and electrification requirements continue to affect product planning and localization decisions across North America. In the US, U.S. EPA finalized multi-pollutant emissions standards for model years 2027 and later light-duty and medium-duty vehicles in 2024, tightening the compliance path for OEMs. Canada also retains a federal ZEV framework with interim milestones that lead to the 2035 endpoint. On top of these, trade and content rules remain an additional constraint, with the USTR pointing to USMCA autos rules of origin as the core regional framework and noting that regional value content requirements for certain vehicle categories rise again on July 1, 2027.
Safety and automation regulation is being adjusted for newer architectures. In 2026, NHTSA advanced rulemaking activity to modernize requirements that interact with automated driving systems, including proposals tied to braking performance (FMVSS No. 135) and updates around New Car Assessment Program (NCAP) processes. NHTSA also set a phased compliance schedule for expanded event data recorder requirements beginning September 1, 2028, providing OEMs and tier suppliers a defined window to redesign sensing, logging, and validation workflows alongside vehicle program cycles.
Value Chain Analysis
The North America automotive value chain runs from raw materials and electronics through stamping, powertrain and battery systems, and final assembly, then into downstream distribution led by franchised dealers alongside a fast-growing direct-to-consumer layer. USMCA rules of origin and tariff exposure are pulling more sourcing and subassembly into North America, which raises the importance of localized supplier parks, cross-border logistics lanes, and compliance documentation. Battery localization remains a central structural shift, supported by large-scale cell and pack projects that compress the distance between cell production and assembly plants and reduce exposure to cross-border content thresholds.
Upstream constraints are most visible in semiconductors, battery-grade minerals, and EV-specific e-motor and power electronics capacity, which can introduce scheduling risk for OEMs and pressure for subtier suppliers. Industry survey evidence (MEMA) indicates heightened financial distress concerns among subtier suppliers in late 2025, reinforcing the role of balance-sheet strength, dual sourcing, and government-backed investments. The 2026 CHIPS-linked funding agreement supporting Bosch investment in silicon carbide capacity, along with the start-up of new U.S. battery JV output, highlights efforts to strengthen electronics and energy-storage nodes to de-bottleneck EV and advanced-ADAS build schedules.
Competitive Landscape
Competition is intensifying yet remains moderately consolidated. Legacy OEMs exploit economies of scale, but Tesla’s vertically integrated direct-sales model has redefined customer expectations. The proposed Nissan–Honda merger, aiming for 8 million annual units, signals a drive toward heft in electrification and software capabilities. Chinese entrants eye regional manufacturing footprints to bypass tariffs, pushing incumbents to accelerate localized investment.
Technology leadership dominates strategic agendas. GM plans to spend USD 10–11 billion in annual capex through 2027 on battery and EV expansion, while Ford channels resources toward commercial EVs and hybrids. Battery joint ventures, cathode-material alliances, and ADAS software partnerships proliferate as firms seek risk sharing. Early compliance with ZEV credit schemes smartly positions several players to monetize surplus credits, strengthening balance-sheet resilience within the North America automotive market.
Dealer networks evolve into omnichannel hubs as software-defined architectures shift service income toward digital flows. Meanwhile, subscription-based feature unlocks open fresh revenue pools estimated at USD 1,600 per vehicle annually. Sustained margin differentiation will hinge on executing these new models while navigating policy volatility and commodity exposure.
North America Automotive Industry Leaders
General Motors
Ford Motor Company
Stellantis NV
Toyota Motor Corporation
Hyundai Motor Company
- *Disclaimer: Major Players sorted in no particular order
North America Automotive Market Companies Covered in this Report
- General Motors Company
- Toyota Motor Corporation
- Ford Motor Company
- Stellantis N.V.
- Hyundai Motor Company
- Honda Motor Co., Ltd.
- Nissan Motor Co., Ltd.
- BMW AG
- Tesla, Inc.
- Volkswagen AG
- Mercedes-Benz Group AG
- Kia Corporation
- Subaru Corporation
- Mazda Motor Corporation
- Rivian Automotive, Inc.
- Lucid Group, Inc.
- BYD Company Ltd.
- Volvo Car Corporation
- Mitsubishi Motors Corporation
- Daimler Truck Holding AG
- PACCAR Inc.
- Navistar International Corp.
- Harley-Davidson, Inc.
- Yamaha Motor Co., Ltd.

Market Opportunities and Future Outlook
A key opportunity centers on retooling and expanding North American manufacturing footprints that can flex across ICE, hybrids, and BEVs while meeting tighter trade-content requirements. In 2026, OEM actions provide specific proof points. Toyota committed USD 3.6 billion to expand its San Antonio manufacturing campus with an added assembly line and an on-site supplier park, and Rivian raised its stated annual capacity at its Stanton Springs North, Georgia project to 300,000 vehicles. These steps create room for tier suppliers in localized stampings, interiors, thermal systems, e-axles, and software-enabled electronics, and they align with higher regional content strategies tied to USMCA compliance.
Electrification infrastructure and policy-linked financing also expand addressable spend beyond the vehicle sale. NEVI and CFI programs (USD 7.5 billion combined) support corridor charging and establish uptime and payment requirements that pull through demand for chargers, grid upgrades, and fleet-depot solutions, even as federal funding remains subject to policy review. On the vehicle side, multi-powertrain portfolios that include hybrids and extended-range concepts alongside BEVs broaden demand for battery modules, power electronics, engine and exhaust aftertreatment upgrades, and calibration software. DOE financing tools such as the ATVM loan program provide a pathway for qualifying domestic re-equipping and capacity additions.
Recent Industry Developments in North America Automotive Market
- July 2026: Toyota Motor North America announced a USD 3.6 billion expansion of its San Antonio manufacturing campus, including a second vehicle assembly line to support Tacoma production and an on-site supplier park. The expansion reinforces North American capacity additions in high-volume light trucks and creates incremental pull-through for localized components and logistics tied to regional content strategies.
- October 2025: Stellantis announced plans to invest USD 13 billion to grow in the United States. The commitment highlights the role of large, multi-year capex programs in rebalancing production footprints and supplier sourcing toward domestic output amid shifting trade and policy conditions.
- December 2024: Hyundai opened its USD 7.6 billion EV plant in Georgia, expanding vehicle production capacity in the southeastern United States. This added manufacturing node supports shorter EV supply lines in North America and increases demand for regional battery, electronics, and tier-1 module supply.


North America Automotive Market Report Scope and Research Methodology
Market Definition and Coverage
For this study, the North America automotive market is defined as the value generated from new vehicle sales across passenger cars, commercial vehicles, and two-wheelers within North America, counted at the point of sale through OEM-linked and other dealer channels.
Scope exclusions: We exclude standalone aftermarket parts, repair services, and insurance unless they are bundled within a new-vehicle transaction.
Segments Covered in This Report
- By Vehicle Type
- Passenger Cars
- Light Commercial Vehicles
- Medium & Heavy Commercial Vehicles
- Two-Wheelers
- By Propulsion Type
- Internal Combustion Engine (ICE)
- Hybrid Electric Vehicles (HEV)
- Plug-in Hybrid Vehicles (PHEV)
- Battery Electric Vehicles (BEV)
- Fuel-Cell Electric Vehicles (FCEV)
- Natural-Gas Vehicles (NGV)
- By Sales Channel
- OEM-Franchised Dealer Sales
- Direct-to-Consumer (Online)
- Fleet and Rental Sales
- By Level of Automation (Value)
- Level 0 - 1 (Basic / No ADAS)
- Level 2 (Partial Automation)
- Level 3 (Conditional Automation)
- Level 4 - 5 (High / Full Automation)
- By Country
- United States
- Canada
- Rest of North America
Data Sources, Market Sizing, and Validation
Desk Research
Desk research was used to build the base demand picture and to keep key assumptions grounded in public signals that can be cross-checked. We leaned on sources such as transportation and highway agencies for vehicle registrations and fleet trends, customs and trade statistics for cross-border vehicle and component flows, and central bank or official statistics portals for inflation and currency series.
On top of that, we reviewed automaker annual reports, investor decks, dealer association releases, and reputable press coverage to map model launches, incentive intensity, and channel shifts. For items like company revenue splits, plant footprints, and patent activity, a paid subscription focused on company financials and a patent database were used as supporting inputs. These desk sources are illustrative only, and many other public references were consulted to collect, validate, and clarify the data points used in the model.
Primary Interviews and Surveys
Primary work was used to pressure-test what desk signals cannot confirm cleanly, especially pricing logic, channel margins, and mix shifts by vehicle type and propulsion. We spoke with a mix of automaker and supplier-side managers, dealer and distributor leaders, and independent experts across the United States, Canada, and the wider North America footprint so assumptions could be aligned to what is happening on the ground.
Distribution of primary research fieldwork respondents
| Company type | Respondent position |
|---|---|
| Top tier: 37% | CXOs: 13% |
| Mid tier: 48% | Functional/Unit leaders: 31% |
| Smaller Players: 15% | Managers: 56% |
Market-Sizing & Forecasting
Sizing started with a top-down build where vehicle sales and registration signals were used to reconstruct the regional demand pool, and then value was derived by applying price bands that reflect mix and incentive intensity. That total was then corroborated with selective bottom-up checks, such as sampled model-level pricing times estimated volumes, plus supplier and channel checks to see if totals stayed realistic.
A few practical inputs that moved the model were new vehicle unit sales by country, the passenger versus commercial mix, propulsion share changes (ICE versus electrified), average transaction price direction (including discounts and incentives), and production plus trade flows that indicate availability. Where a gap appeared for a smaller sub-category, we used proxy ratios from similar vehicles and then re-validated the implied totals with interview feedback.
For forecasting, scenario analysis was used so the outlook reflects different paths for interest rates and affordability, electrification policy momentum, and inventory normalization. Assumptions were adjusted until they matched what primary respondents considered achievable in their planning horizons.
Data Validation & Update Cycle
Validation was done through repeated cross-checks rather than a single pass. We compared the market outputs with independent signals like unit sales, registration direction, production utilization cues, and pricing movement, and then investigated any variance that looked out of pattern.
Before sign-off, the model and write-up went through multi-step analyst reviews, and follow-up calls were triggered when a major input shifted or a new event changed demand expectations. Reports are refreshed annually, and interim updates are completed when material events occur, followed by a final pre-delivery sweep so clients receive the latest view.
Mordor Intelligence's North America Automotive Market Size Compared Against Other Published Estimates
Published market sizes for North America automotive do not always line up because the scope line is drawn differently and the value point in the chain is not always the same. Differences also come from how prices are treated (list price versus transaction price), what gets counted as automotive (for example, whether two-wheelers are included), and the timing used for currency and inflation adjustments.
In our checks, the biggest gap drivers were whether only passenger and light vehicles were counted versus adding commercial vehicles and two-wheelers, and whether forecasts assumed aggressive electrification uptake without dealer-level pricing and incentive reality checks. The spread also widens when a study folds in adjacent areas like charging infrastructure or broad aftermarket services, which can inflate the number even if vehicle unit trends are similar.
Benchmark comparison
| Source | Market Size | Gaps in Research Methodology |
|---|---|---|
| Mordor Intelligence | USD 1.10 T (2026) | |
| Regional Consultancy A | USD 874.90 B (2024) | This estimate appears anchored to an earlier base year and may reflect a narrower revenue capture around vehicle sales channels, which can understate value when mix shifts and transaction prices rise. |
| Global Consultancy B | USD 1.23 T (2025) | This figure indicates a broader chain-of-value view that can include services and adjacent infrastructure, plus a different vehicle set emphasis, which tends to lift totals versus a new-vehicle sales-only build. |
The table shows that scope and where value is counted explain most of the difference, not just math. By keeping the total tied to new vehicle transactions across passenger, commercial, and two-wheeler categories, and then stress-testing price and mix assumptions with dealer and supplier inputs, a repeatable baseline is produced, which is the key modeling choice applied by Mordor Intelligence.


Key Questions Answered in the Report
How large is the North America automotive market in 2026?
The North America automotive market size is USD 1.1 trillion in 2026.
What is the forecast CAGR for vehicle sales in North America to 2031?
The market is projected to expand at a 5.36% CAGR through 2031.
Which vehicle segment grows fastest this decade?
Medium- and heavy-commercial vehicles lead with an 8.22% CAGR as fleets electrify.
How will U.S. tariffs affect regional production?
The 25% tariff from 2025 is driving automakers to accelerate onshore capacity investments across the United States, Canada, and Mexico.
Why are software-defined vehicles important to automakers?
Connected-service subscriptions linked to software-defined vehicles could yield USD 1,600 annual recurring revenue per unit, reshaping profitability models.
Page last updated on:




