
Technology, Media and Telecom
5th MayPricing Strategy for Semiconductor Components
3 Min Read
The Mobile Backend As A Service (MBaaS) Market Report Segments the Industry Into by Service Type (Storage, Application Hosting, API Management, and Analytics and Monitoring), Deployment Model (Public Cloud, Private Cloud, and Hybrid Cloud), End-User (Small and Medium-Sized Enterprises (SMEs), Large Enterprises, and Individual Developers), Platform (iOS, Android, and Cross-Platform / Multiexperience), and Geography.
Market Overview
| Study Period | 2020 - 2031 |
|---|---|
| Market Size (2026) | USD 11.2 Billion |
| Market Size (2031) | USD 18.33 Billion |
| Growth Rate (2026 - 2031) | 10.34 % CAGR |
| Fastest Growing Market | North America |
| Largest Market | Asia Pacific |
| Market Concentration | Medium |
Major Players *Disclaimer: Major Players sorted in no particular order. Image © Mordor Intelligence. Reuse requires attribution under CC BY 4.0. |
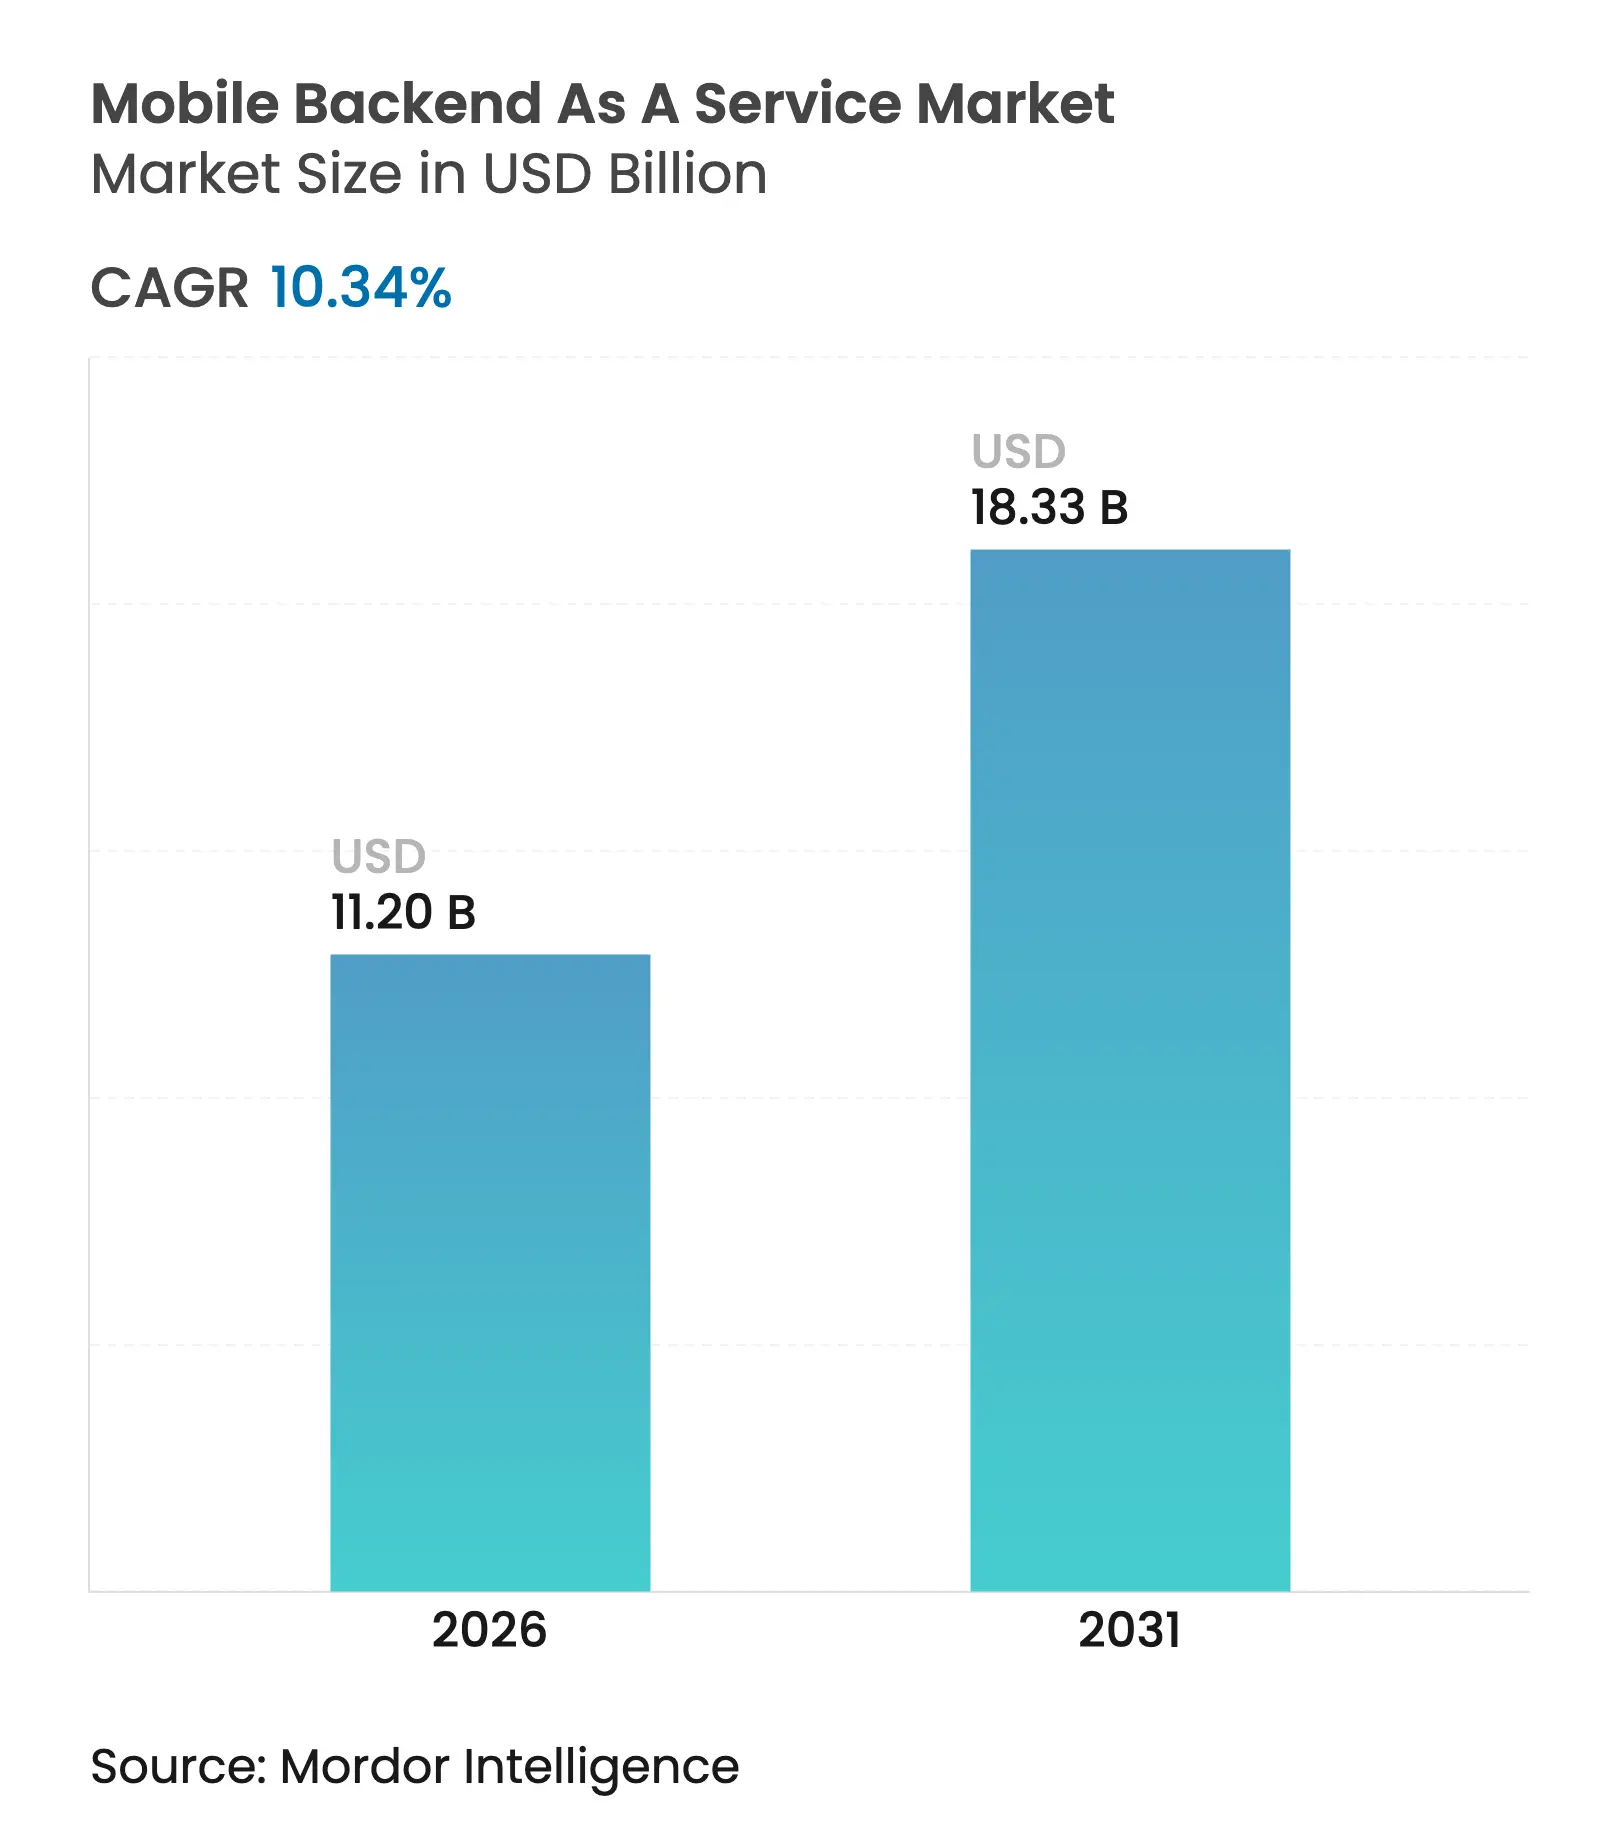
Mobile backend as a service market size in 2026 is estimated at USD 11.2 billion, growing from 2025 value of USD 10.15 billion with 2031 projections showing USD 18.33 billion, growing at 10.34% CAGR over 2026-2031. Rising investment in serverless architectures, 5G-driven edge requirements, AI-augmented application workloads, and cost-avoidance pressures on in-house development are already reshaping enterprise priorities. Customers favor platforms that combine automated scaling, global data residency compliance, and integrated low-code tooling. Competitive intensity remains moderate because hyperscale clouds bundle MBaaS with broader platform portfolios, while PostgreSQL-native open-source stacks lower switching friction for developers. Regional momentum pivots toward Asia-Pacific, where mobile-first business processes accelerate demand for real-time backend services that overcome latency and data sovereignty barriers.
Key Report Takeaways
Note: Market size and forecast figures in this report are generated using Mordor Intelligence's proprietary estimation framework, updated with the latest available data and insights as of 2026.
Drivers Impact Analysis
| Driver | (~) % Impact on CAGR Forecast | Geographic Relevance | Impact Timeline | |||
|---|---|---|---|---|---|---|
Explosive growth in low-code and serverless development tools Explosive growth in low-code and serverless development tools | +2.8% | Global, concentrated in North America and EU | Medium term (2-4 years) | (~) % Impact on CAGR Forecast:+2.8% | Geographic Relevance:Global, concentrated in North America and EU | Impact Timeline:Medium term (2-4 years) |
5G-enabled edge computing needs for real-time apps 5G-enabled edge computing needs for real-time apps | +2.1% | Asia-Pacific core, spill-over to North America | Long term (≥ 4 years) | |||
Cost avoidance of in-house backend development Cost avoidance of in-house backend development | +1.9% | Global, more acute in SME-heavy regions | Short term (≤ 2 years) | |||
Vendor bundling of MBaaS inside MADP and IDaaS suites Vendor bundling of MBaaS inside MADP and IDaaS suites | +1.4% | North America and EU enterprise markets | Medium term (2-4 years) | |||
Data-residency clauses in digital-trade pacts Data-residency clauses in digital-trade pacts | +0.8% | Asia-Pacific with global spill-over | Long term (≥ 4 years) | |||
Proliferation of AI-augmented mobile apps Proliferation of AI-augmented mobile apps | +1.6% | Global, led by North America tech hubs | Medium term (2-4 years) | |||
| Source: Mordor Intelligence | ||||||
Explosive Growth in Low-Code and Serverless Development Tools
Low-code platforms combined with serverless runtimes now let business teams build production apps without deep infrastructure skills. Adoption has surged across Fortune 500 enterprises as Power Platform and Firebase eliminate much of the historical coding overhead. Business units bypass central IT to solve near-term operational gaps, and MBaaS vendors that integrate directly into low-code toolchains see the fastest uptake. Regulated industries particularly welcome back-end offerings that auto-enforce compliance policies. With AI-based code generation already embedded, the present acceleration marks only the opening phase of a shift toward intent-based programming models that trim release cycles to days rather than months[2]Microsoft Corporation, “Power Platform 2025 Release Wave 1 Plan,” microsoft.com.
5G-Enabled Edge Computing Requirements for Real-Time Apps
5G standalone rollouts have forced applications such as industrial IoT and connected vehicles to process data inside millisecond windows. Backend services now deploy closer to devices to avoid round-trip latency to central clouds. MBaaS providers respond with distributed nodes that interoperate with carrier edge zones while retaining unified management planes. These hybrid topologies satisfy both performance and sovereignty mandates, and Asia-Pacific’s early 5G deployments set templates that other regions replicate.
Cost Avoidance of In-House Backend Development
Building custom mobile backends drains capital, with gaming studios reporting USD 22 million average outlays before maintenance even begins. Ongoing patching, security updates, and audit tracking add 15-20% to annual IT budgets. Subscription-based MBaaS platforms now undercut the total cost of ownership, allowing organizations to shift fixed infrastructure spend toward variable usage fees that scale with active users. SMEs benefit most, unlocking enterprise-grade resilience and compliance at entry-level price points that once required eight-figure investments.
Proliferation of AI-Augmented Mobile Apps
Generative AI features inside consumer and enterprise apps need event-driven backends capable of serving unpredictable inference workloads. Firebase now exposes Vertex AI within its console, letting developers bind prompts, models, and vector stores without procuring separate infrastructure. MBaaS roadmaps emphasize autoscaling GPU pools, model versioning workflows, and telemetry for bias detection. Edge inference further complicates orchestration, requiring seamless fail-over between on-device and cloud execution paths[3]Google Cloud, “Introducing Firebase Studio,” cloud.google.com.
Restraint Impact Analysis
| Restraint | (~) % Impact on CAGR Forecast | Geographic Relevance | Impact Timeline | |||
|---|---|---|---|---|---|---|
Escalating egress-fee structures of hyperscale clouds Escalating egress-fee structures of hyperscale clouds | -1.8% | Global, especially multi-cloud deployments | Short term (≤ 2 years) | (~) % Impact on CAGR Forecast:-1.8% | Geographic Relevance:Global, especially multi-cloud deployments | Impact Timeline:Short term (≤ 2 years) |
Rising scrutiny under cross-border privacy frameworks Rising scrutiny under cross-border privacy frameworks | -1.2% | EU-US corridors, expanding to Asia-Pacific | Medium term (2-4 years) | |||
Growing preference for open-source Postgres MBaaS stacks Growing preference for open-source Postgres MBaaS stacks | -0.9% | Developer-centric markets worldwide | Long term (≥ 4 years) | |||
Enterprise concerns over vendor lock-in Enterprise concerns over vendor lock-in | -1.1% | Large enterprise segments globally | Medium term (2-4 years) | |||
| Source: Mordor Intelligence | ||||||
Escalating Egress-Fee Structures of Hyperscale Clouds
Although AWS and Google have waived exit charges, routine data-transfer fees still inflate backend operating costs by up to 30% for data-rich applications. Workloads that sync user files or telemetry across regions suffer disproportionately. High egress bills deter multi-cloud portability and slow adoption of analytics-heavy mobile features. Enterprises are therefore probing edge storage caches and on-device encryption to limit round-trip flows that trigger provider metering.
Rising Scrutiny Under Cross-Border Privacy Frameworks
The EU-US Data Privacy Framework obliges continuous auditing of data flows and algorithmic processing, elevating compliance complexity for MBaaS vendors. Customers now demand region-locked instances, real-time residency dashboards, and granular processor disclosures in contracts. Providers that cannot partition data pipelines by jurisdiction risk exclusion from regulated deals, especially as Indo-Pacific trade pacts incorporate similar sovereignty clauses[1]European Data Protection Board, “Opinion 3/2024 on Digital Trade Provisions,” edpb.europa.eu.
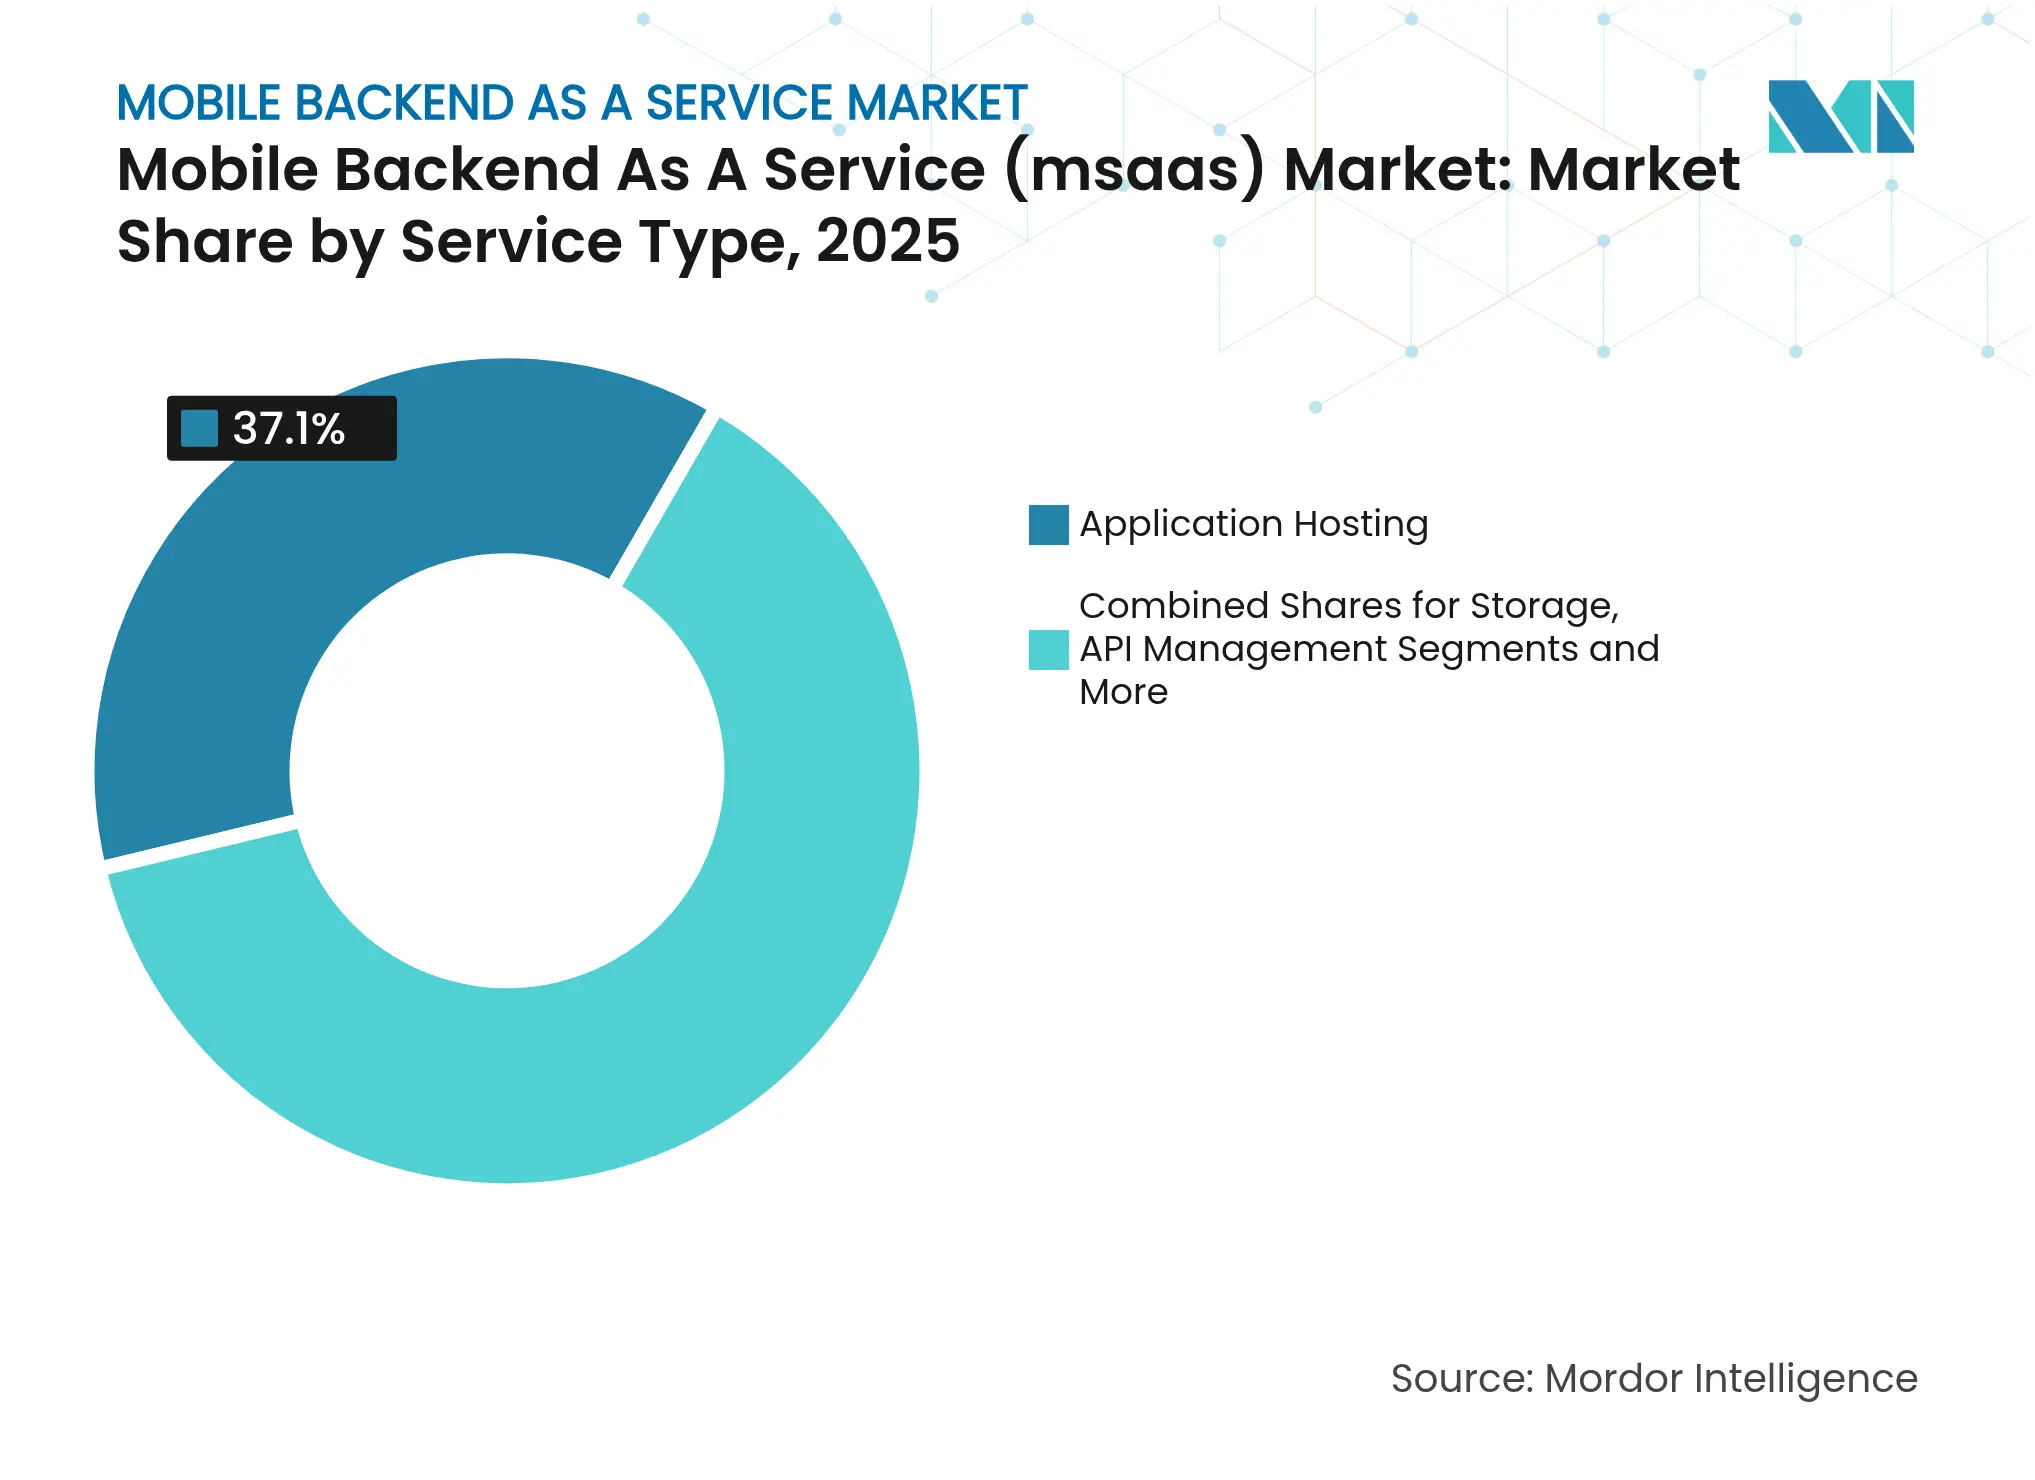
By Service Type: Application Hosting Dominates While Analytics Surges
Application Hosting held 37.10% of 2025 revenue and remains the pillar of the mobile backend as a service market because enterprises rely on auto-scaling compute clusters for unpredictable traffic bursts. The mobile backend as a service market size for hosting services is projected to extend further as container orchestration, global CDN routing, and managed secrets vaults converge into single-click stacks. Analytics and Monitoring, advancing at a 25.35% CAGR, gains from mandatory performance observability and user behavior telemetry that support monetization and compliance reporting. Storage options keep steady momentum as multimedia uploads escalate, while API management edges toward mainstream adoption as microservice sprawl intensifies. Integrated suites that merge these modules improve time-to-value, evidenced by Firebase Data Connect, which collapses query logic, storage, and API delivery into one workflow.
Demand dynamics suggest enterprises will increasingly contract for bundled service tiers rather than discrete modules to reduce integration overhead. Hosting providers already preload observability agents that collect latency, cost, and carbon-footprint metrics, enabling fine-grained SLA renegotiation. Analytics vendors enhance dashboards with policy-based anomaly detection that flags compliance drift. Vendors offering usage-based pricing attract SME customers who previously deferred deep telemetry due to cost. The segment interplay highlights that the mobile backend as a service market must accommodate flexible service orchestration so buyers can align spend with evolving workload patterns.
Note: Segment shares of all individual segments available upon report purchase
By Deployment Model: Hybrid Cloud Acceleration Challenges Public Dominance
Public Cloud accounted for 69.00% revenue in 2025, benefiting from near-frictionless onboarding and global POP presence. The mobile backend as a service market size within public environments expands in lockstep with start-up formation and product-led growth strategies. Yet Hybrid Cloud, scaling at 28.05% CAGR, signals a preference for latency-optimized and compliance-aligned runtimes that combine on-premise nodes with regional cloud fabric. Private Cloud remains restricted to highly regulated sectors such as financial services, where data may not exit institutional boundaries despite cost inefficiencies.
Hybrid deployments increasingly place event brokers and data stores at manufacturing plants, hospitals, or retail branches while routing authentication and analytics to public endpoints. This architecture satisfies data sovereignty and enhances edge responsiveness without forfeiting centralized management. Cisco reports that more than 80% of enterprises run at least two clouds, and procurement templates now require exit strategies to deter vendor dependency. The emphasis on flexibility drives providers to decouple control planes from data planes, allowing customers to re-platform without rewriting code. Consequently, the mobile backend as a service market is pivoting toward protocols and abstractions that shield applications from infrastructure shifts.
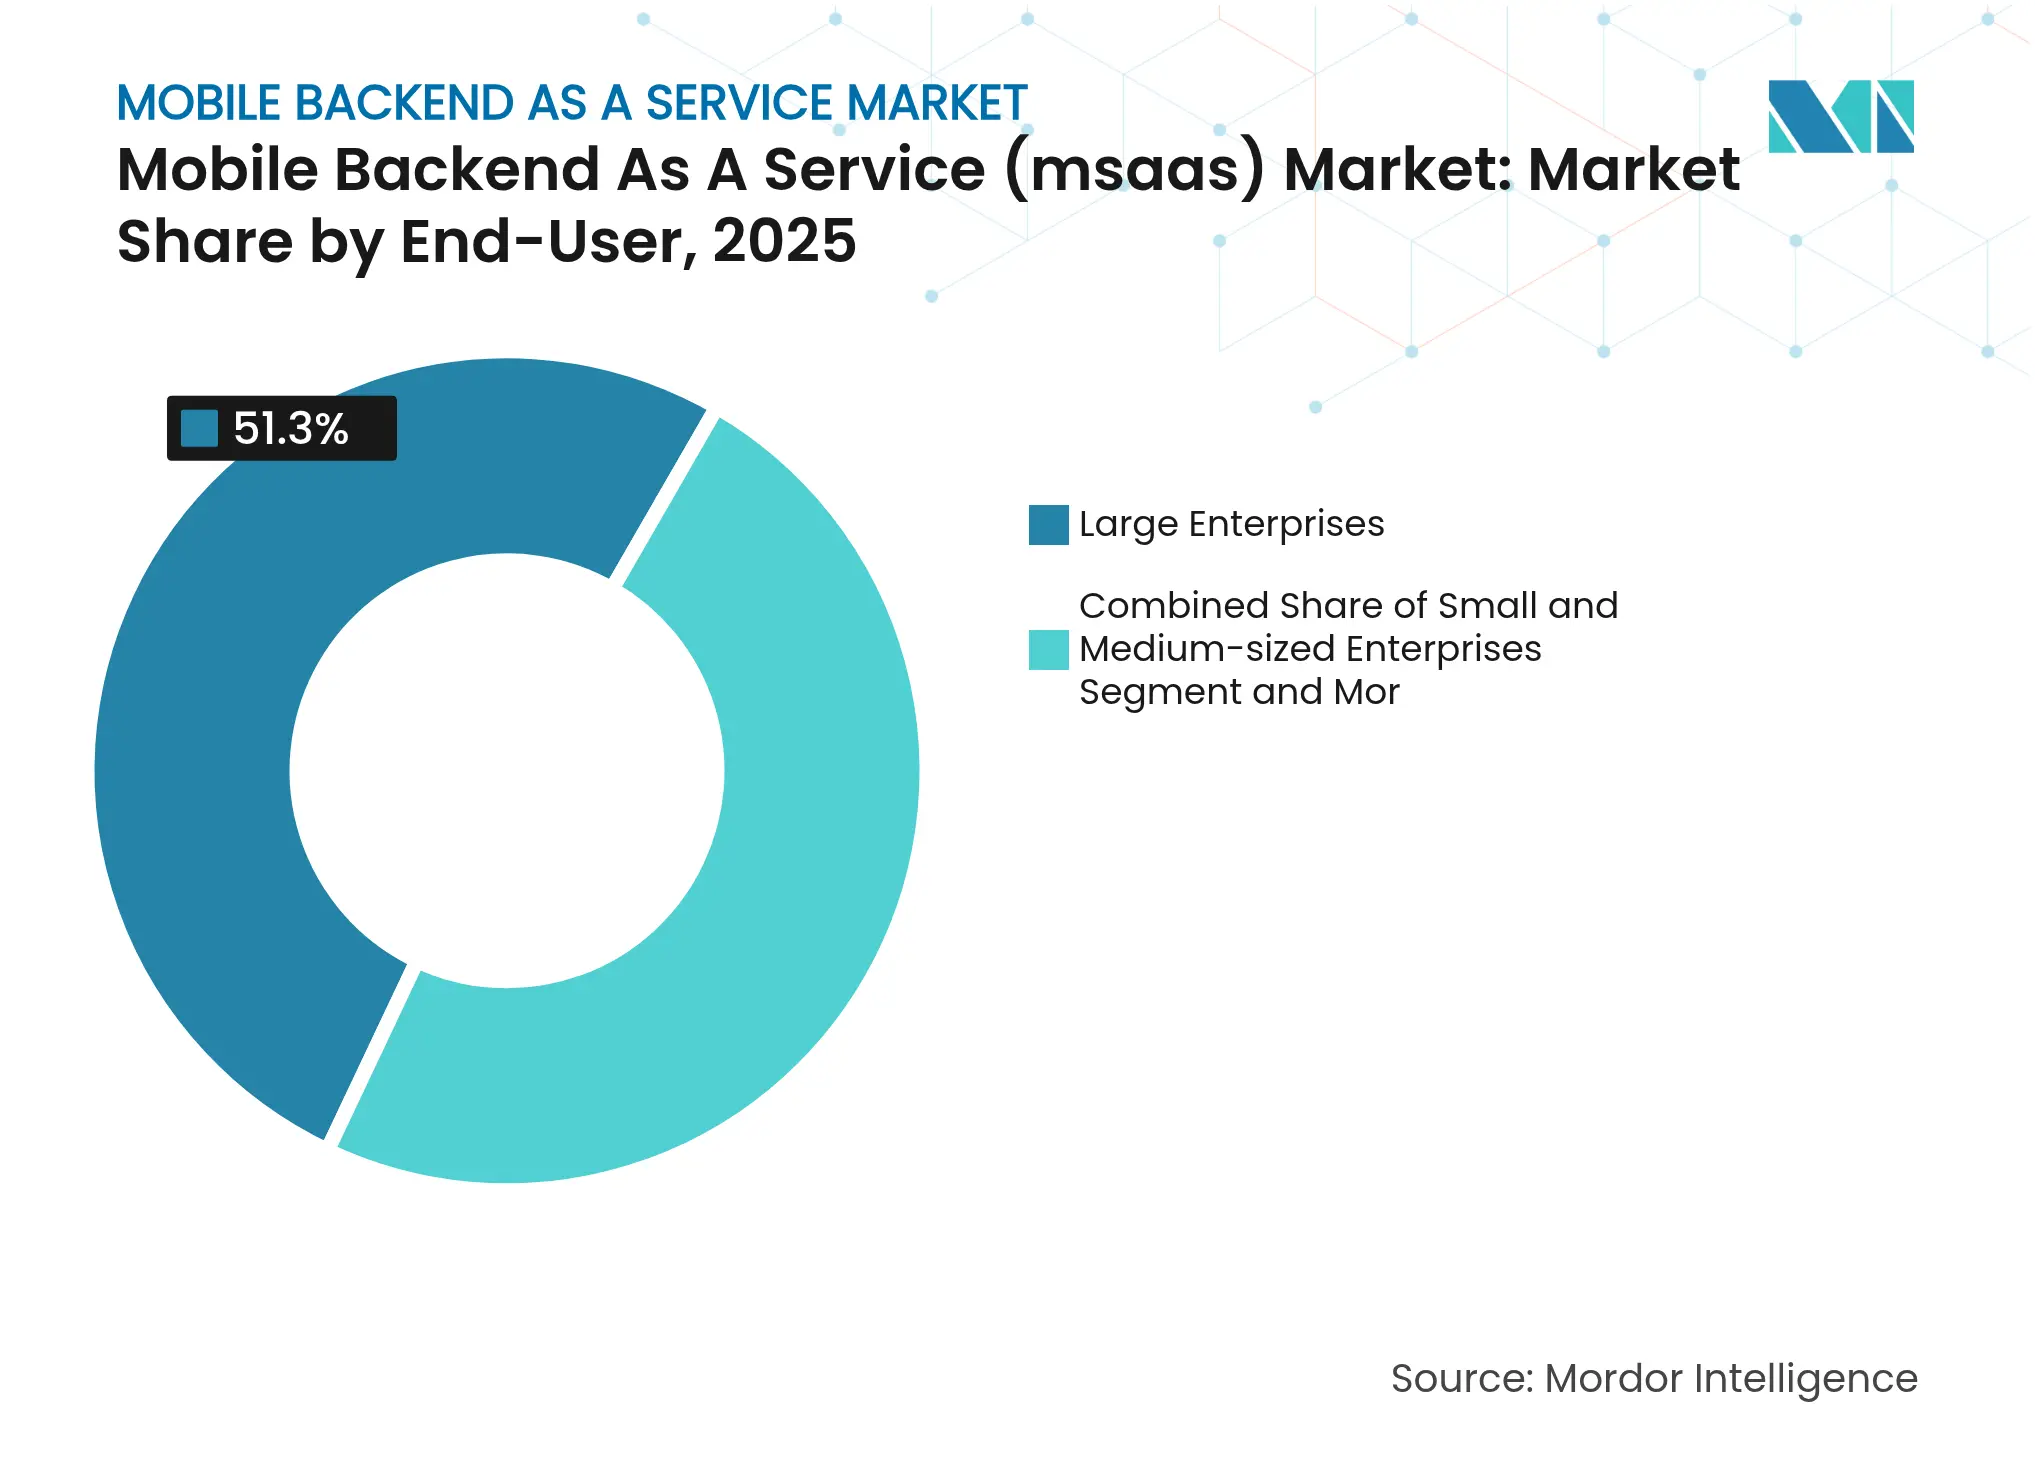
By End-User: SME Growth Outpaces Enterprise Adoption
Large Enterprises commanded 51.30% revenue in 2025, leaning on MBaaS platforms for rapid rollout of customer-facing apps across banking, retail, and logistics. Enterprises integrate backends with single sign-on, audit logging, and policy engines to meet governance benchmarks. SMEs, however, are expanding fastest at a 24.95% CAGR because cloud-native pricing levels the playing field. Subscription tiers grant startups access to scalable messaging, geo-queries, and push notifications that once required dedicated ops teams.
Citizen-developer initiatives further democratize backend provisioning inside departments previously sidelined by IT procurement cycles. Individual developers prototype MVPs to validate business hypotheses before central funding. Research shows ROI improvements above 450% for organizations that migrate from monolithic custom stacks to managed MBaaS, underlining how the mobile backend as a service industry enables budget-neutral experimentation and shorter payback windows. Over the forecast horizon, enterprise IT will borrow agile playbooks from SMEs while SMEs adopt enterprise-grade compliance plugins, narrowing functional gaps across user tiers.
Note: Segment shares of all individual segments available upon report purchase
By Platform: Cross-Platform Frameworks Challenge Native Development
Android retained 59.60% share in 2025 because of unmatched global handset penetration and faster app-store approval cycles. Providers optimize SDKs for Kotlin and Jetpack Compose to capitalize on that installed base. Cross-Platform toolchains, however, are posting a 23.85% CAGR, reflecting React Native’s maturity and Flutter’s expansion beyond green-field prototypes. The mobile backend as a service market share advantage of Android is expected to dilute as single-codebase frameworks allow simultaneous iOS and web output.
iOS remains lucrative due to higher ARPU and robust payment rails, but stringent review policies can extend release timelines. Cross-platform engines integrate hot-reload features that slash iteration loops and now match near-native rendering fidelity. These gains tilt organization preferences toward framework-agnostic backend SDKs that plug into JavaScript, Dart, or Swift with equal ease. Over time, competitive parity will revolve around how seamlessly MBaaS APIs expose real-time databases, authentication, and offline caching across multiplatform front-ends, rather than on platform-specific widgets.
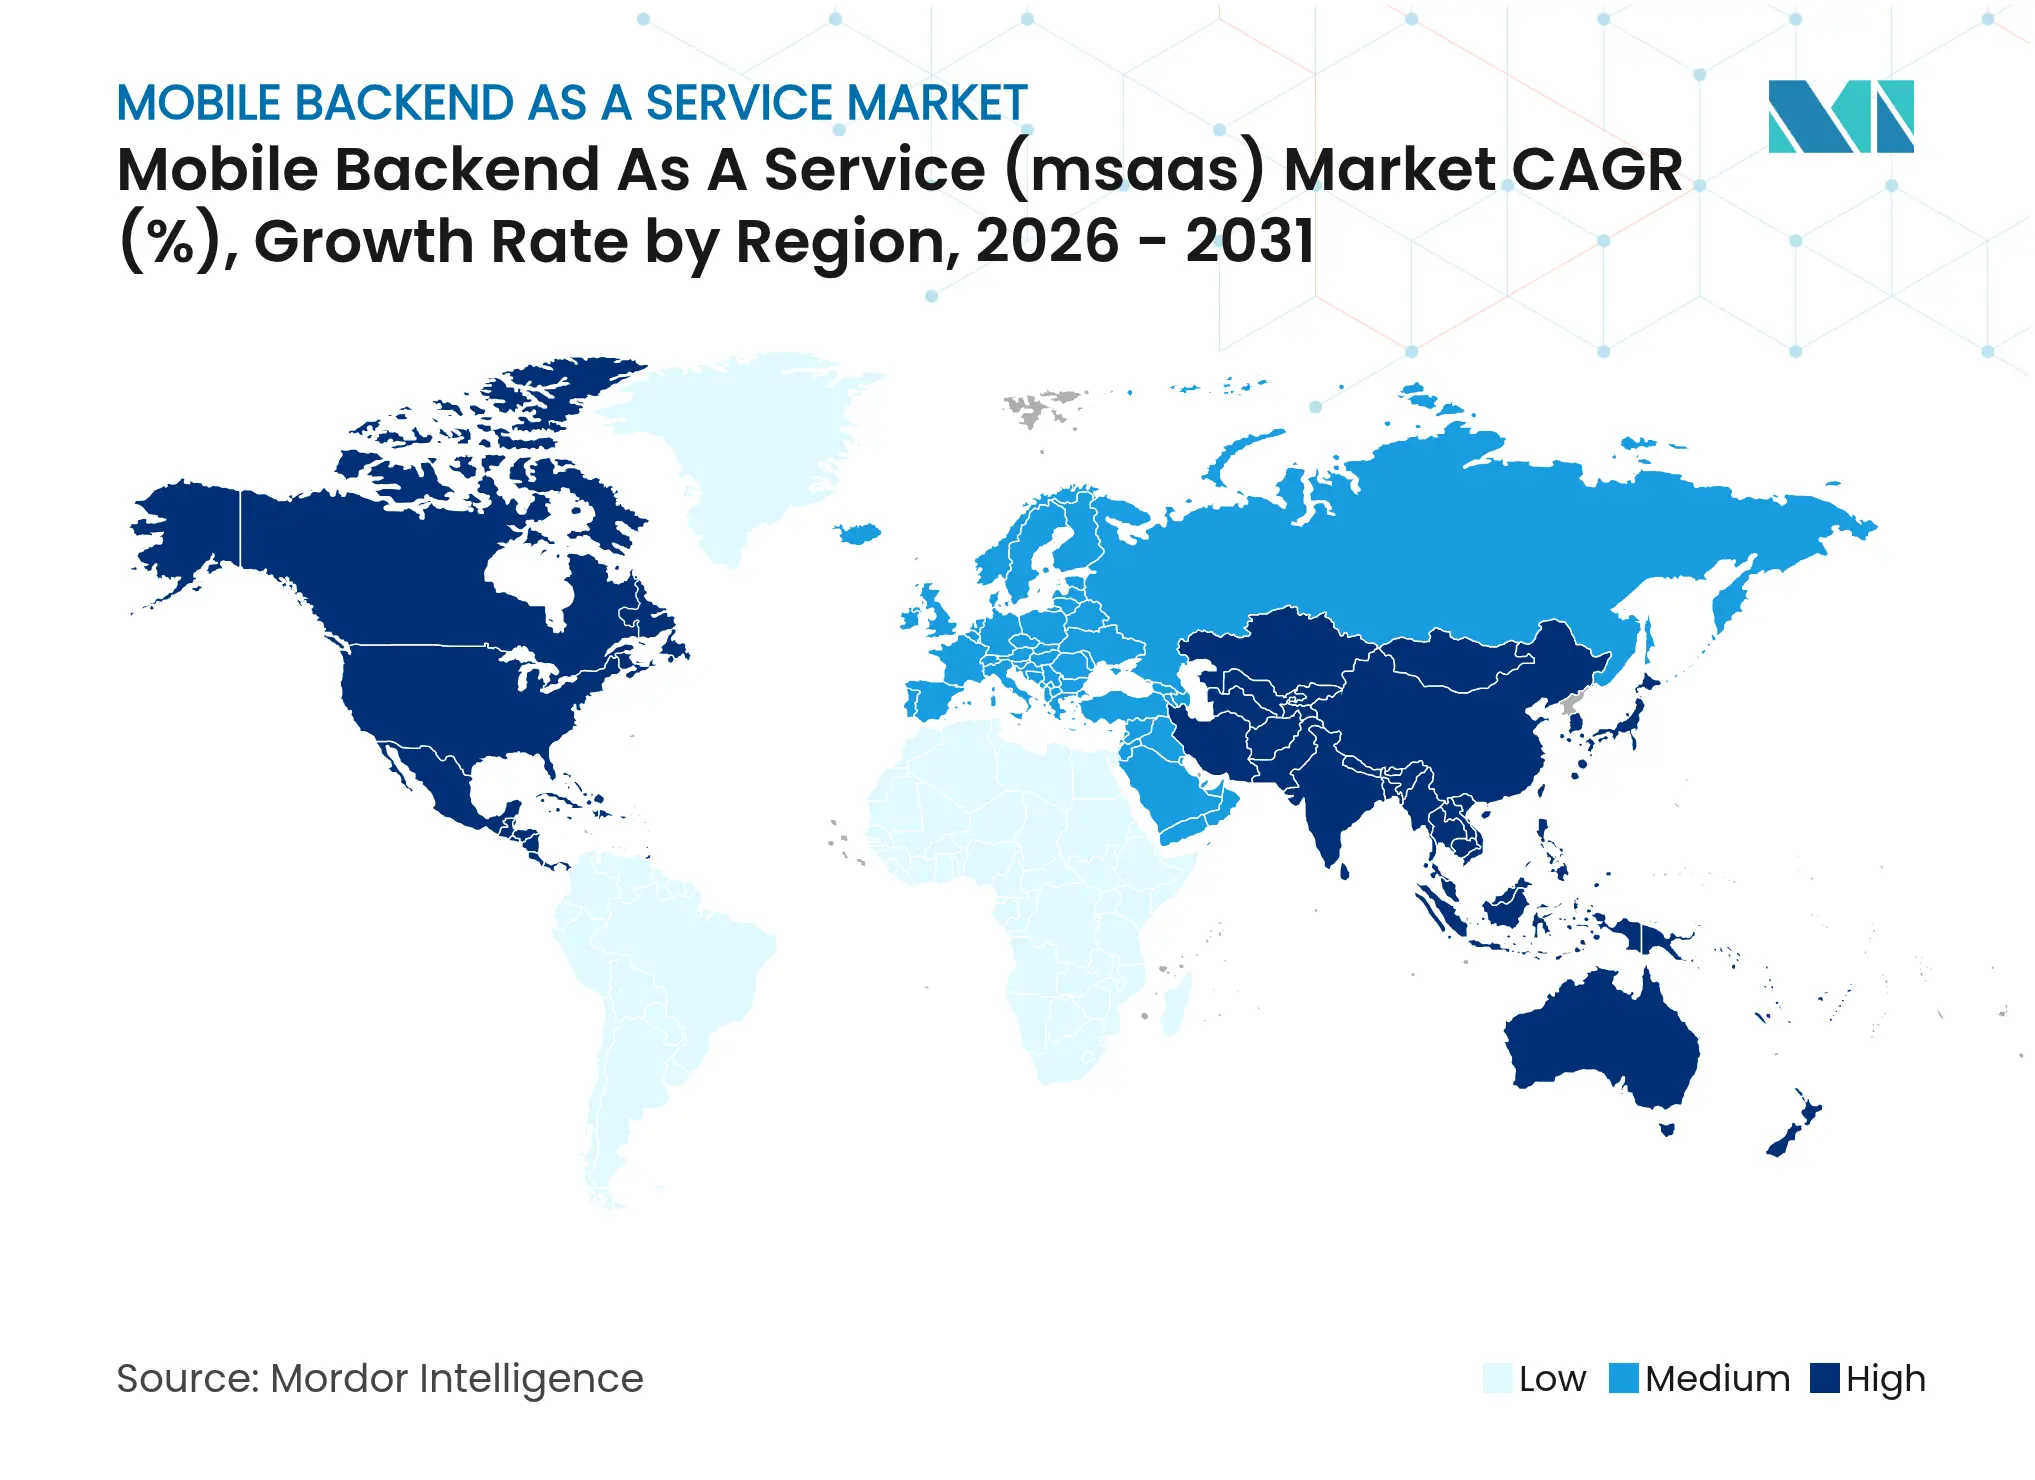
North America held 42.10% of the mobile backend as a service market in 2025 and continues to benefit from deep venture funding, established digital-native user bases, and favorable legal frameworks for cross-border data transfers. The United States drives enterprise spending as Fortune 500 leaders embed mobile channels into core lines of business, while Canada’s fintech expansion and government digital programs amplify regional demand. Mexico presents an emerging corridor as manufacturing and retail firms deploy mobile supply-chain solutions that require robust, low-latency backends. Competitive pressure intensifies as open-source options gain mindshare, prompting established providers to differentiate through compliance certifications and AI accelerators.
Asia-Pacific is projected to expand at an 18.55% CAGR through 2031, fueled by mobile-first commerce models contributing USD 880 billion to GDP in 2024. Super-app ecosystems in China and payments innovation in India test backend scalability at orders-of-magnitude beyond North American workloads. Seven regional economies already operate 5G standalone networks, allowing quasi-real-time experiences like cloud gaming and telesurgery. Southeast Asian hubs, notably Singapore and Indonesia, lead cross-border digital-trade pilots that require granular data-residency orchestration. Edge node proliferation strengthens adoption of hybrid MBaaS deployments that span carrier MEC facilities and public cloud.
Europe displays steady growth, balancing advanced cloud skillsets with some of the world’s strictest privacy statutes. GDPR and the EU-US Data Privacy Framework force providers to segment traffic, encrypt metadata, and publish transparent processing reports. Germany and France prioritize hybrid patterns for automotive and banking applications, while the United Kingdom negotiates distinct data-flow rules post-Brexit. Nordic countries lean toward PostgreSQL-native open-source offerings, reflecting cultural predilections for transparency. South America and the Middle and East aremain nascent but attractive for first-mover providers that pair local POPs with sovereign-cloud assurances.
Market Concentration
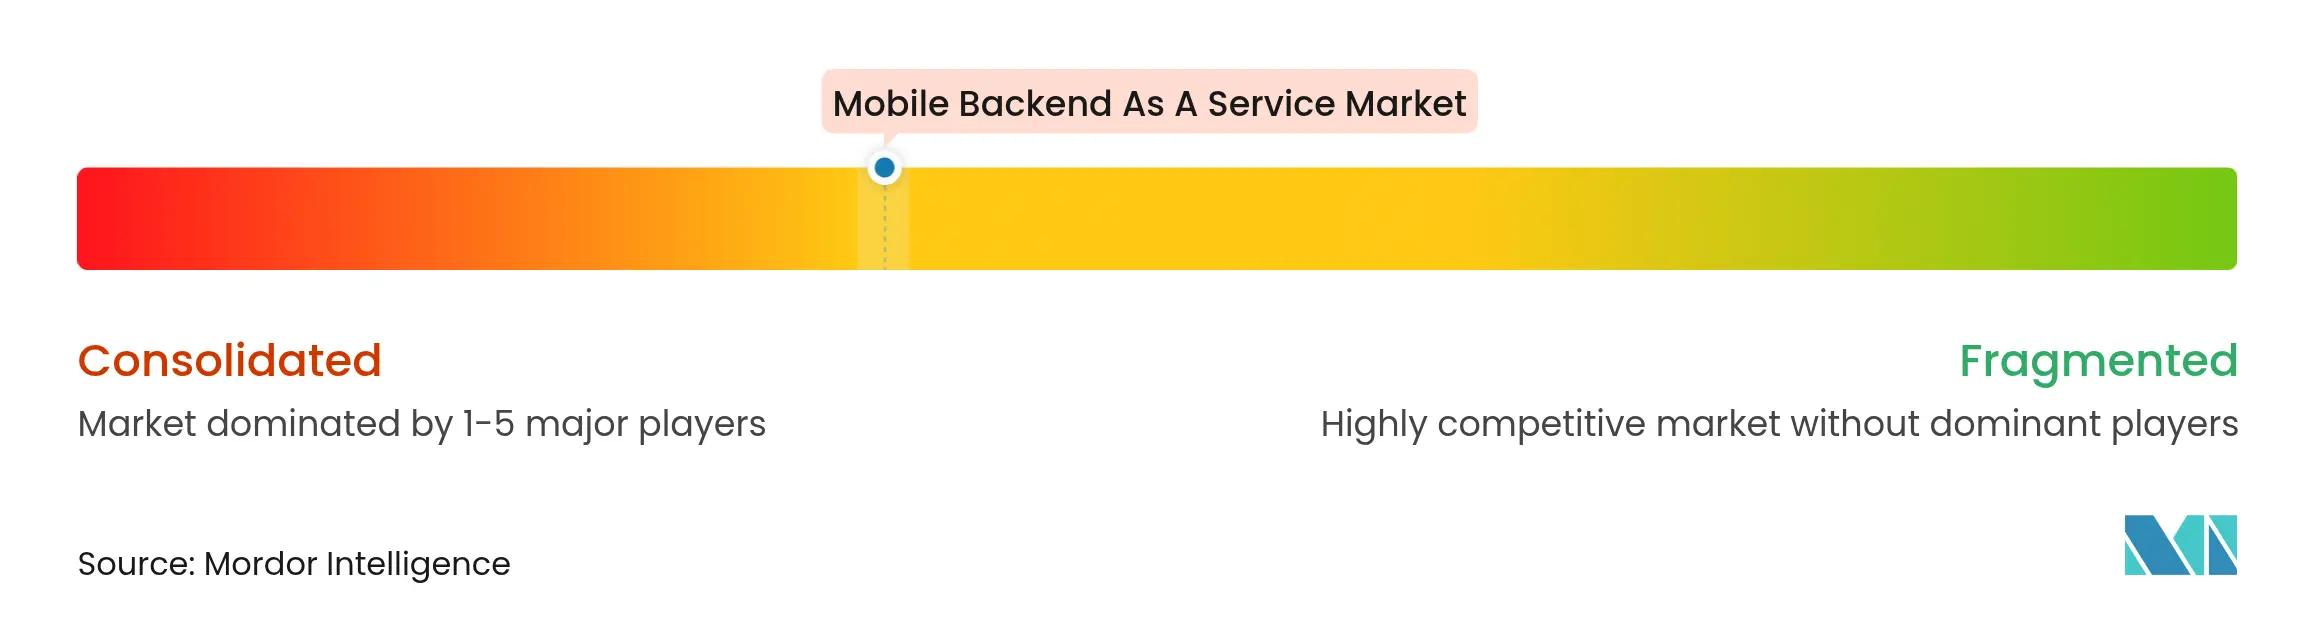
The mobile backend as a service market shows moderate concentration. Amazon Web Services leverages USD 29.27 billion in Q1 2025 cloud revenue and 39.5% margins to underwrite aggressive tiered pricing that locks in early-stage projects. Google Cloud courts developers through AI-native services and recorded 35% year-over-year growth in Q3 2024, while Microsoft Azure posted USD 42.4 billion cloud revenue with 33% Azure growth the same year. Strategic differentiation centers on integrated CI/CD pipelines, multi-language SDK libraries, and zero-copy data analytics.
Specialist challengers such as Supabase and Appwrite exploit open-source governance to promise no-lock-in migration paths. Their PostgreSQL foundations enable SQL familiarity, fine-grained role-based access, and community-driven feature velocity. Proprietary incumbents react by exposing export tooling and embracing open standards like OpenAPI and GraphQL subscriptions. In vertical niches, Salesforce fuses CRM data with mobile SDKs, Oracle partners with AWS for multicloud database reach, and IBM applies confidential computing enclaves to regulated workloads.
Strategic moves illustrate the shifting ground. Salesforce’s bid for Informatica marries metadata management with AI CRM to fortify data-driven customer engagement. Google released Firebase Studio with 60 AI templates that auto-generate backend scaffolding, edging closer to one-click app orchestration. AWS secured Grab’s super-app migration, showcasing how ARM-based Graviton2 instances reduce cost-per-transaction. Such deals underscore that ecosystem stickiness, rather than feature parity, dictates market share trajectory. Over the forecast horizon, winners will master seamless data portability, transparent pricing, and built-in compliance while fostering vibrant developer communities.

*Disclaimer: Major Players sorted in no particular order
1. INTRODUCTION
2. RESEARCH METHODOLOGY
3. EXECUTIVE SUMMARY
4. MARKET LANDSCAPE
5. MARKET SIZE AND GROWTH FORECAST (VALUE)
6. COMPETITIVE LANDSCAPE
7. MARKET OPPORTUNITIES AND FUTURE OUTLOOK
Market Definitions and Key Coverage
Segmentation Overview
Detailed Research Methodology and Data Validation
Primary Research
Desk Research
Market-Sizing & Forecasting
Data Validation & Update Cycle
Why Our Mobile Backend As A Service Baseline Delivers Credible, Decision-Ready Insight
Benchmark comparison
| Market Size | Anonymized source | Primary gap driver | ||
|---|---|---|---|---|
USD 10.15 B (2025) | Mordor Intelligence | - | Anonymized source:Mordor Intelligence | Primary gap driver:- |
USD 5.25 B (2024) | Regional Consultancy A | Cloud-only scope and 19.4 % CAGR inflate later years while understating base year | ||
USD 4.10 B (2023) | Trade Journal B | Excludes private/hybrid spend and applies list prices without enterprise discounts | ||
USD 9.48 B (2023) | Global Consultancy C | Blends web-back-end services and professional services, widening the base |
Pricing Strategy for Semiconductor Components
3 Min Read
Accelerating Additive Manufacturing Adoption in India
3 Min Read
Unlocking Growth in India’s Luxury Beauty & Skincare Market
3 Min Read
When decisions matter, industry leaders turn to our analysts. Let’s talk.