
Mineral Enrichment Ingredients Market Size and Share
Market Overview
| Study Period | 2021 - 2031 |
|---|---|
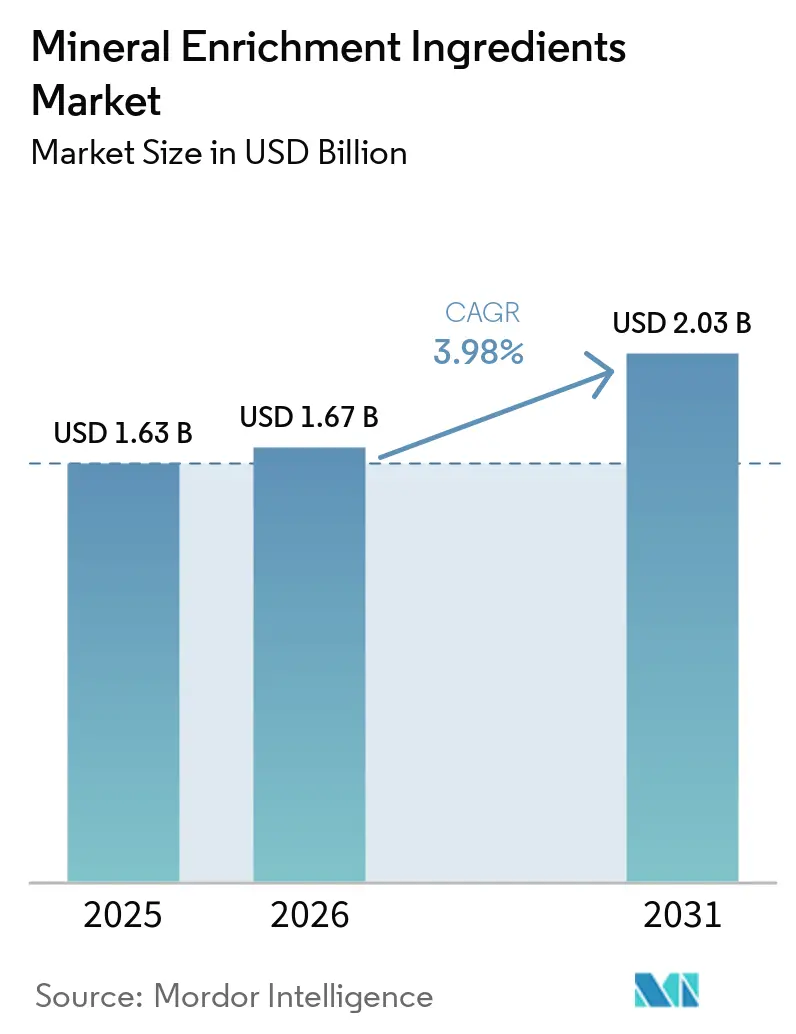
| Market Size (2026) | USD 1.67 Billion |
| Market Size (2031) | USD 2.03 Billion |
| Growth Rate (2026 - 2031) | 3.98 % |
| Fastest Growing Market | Asia-Pacific |
| Largest Market | North America |
| Market Concentration | Medium |
Major Players *Disclaimer: Major Players sorted in no particular order Image © Mordor Intelligence. Reuse requires attribution under CC BY 4.0. | |
Mineral Enrichment Ingredients Market Analysis by Mordor Intelligence
The mineral enrichment ingredients market size was USD 1.63 billion in 2025 and is forecast to reach USD 2.03 billion by 2031, growing at a CAGR of 3.98% from 2026 to 2031. Market growth is driven by staple-food fortification programs, rising preventive nutrition awareness, and the expanding use of minerals in functional foods, beverages, dietary supplements, infant nutrition, and clinical nutrition products. Government-led mandatory and voluntary fortification programs for staples such as flour, rice, salt, milk, and edible oils create recurring, large-volume demand for mineral ingredients, particularly iron, zinc, calcium, iodine, and other essential micronutrients. Consumer-facing applications increasingly favor mineral forms that provide improved bioavailability, stability, solubility, and sensory performance. This requirement is particularly relevant in functional beverages, gummies, powders, and multi-mineral supplements, where mineral interactions may affect taste, color, texture, and shelf life. Suppliers are consequently differentiating their offerings between commodity mineral salts and higher-value chelated, encapsulated, or customer-specific premix solutions. While standard mineral salts face greater price competition and limited pricing power, premium products can command stronger margins where purity, formulation compatibility, bioavailability, and regulatory documentation are critical purchase considerations.
Key Report Takeaways
- By ingredient type, calcium held 32.71% of mineral enrichment ingredients market share in 2025, while sodium recorded the highest projected CAGR at 4.46% through 2031.
- By form, powder held 65.62% of the mineral enrichment ingredients market share in 2025, while granules recorded the highest projected CAGR at 5.11% through 2031.
- By application, food and beverage held 68.42% of the mineral enrichment ingredients market size in 2025, while dietary and nutritional products recorded the highest projected CAGR at 5.01% through 2031.
- By geography, North America held 33.90% of the mineral enrichment ingredients market size in 2025, while Asia-Pacific recorded the highest projected CAGR at 4.82% through 2031.
Note: Market size and forecast figures in this report are generated using Mordor Intelligence’s proprietary estimation framework, updated with the latest available data and insights as of January 2026.
Market Trends and Insights
Drivers Impact Analysis of Mineral Enrichment Ingredients Market*
| Driver | (~) % Impact on CAGR Forecast | Geographic Relevance | Impact Timeline |
|---|---|---|---|
| Government-led staple-food fortification | +0.9% | South Asia, Sub-Saharan Africa, Southeast Asia, with policy spillover to North Africa and the Middle East and Africa | Medium term (2–4 years) |
| Micronutrient deficiency and preventive health demand | +0.8% | Global | Long term (≥ 4 years) |
| Functional and fortified food and beverage expansion | +0.7% | North America, Europe, and the Asia-Pacific urban centers | Medium term (2–4 years) |
| Bioavailability-led premiumization of chelated and encapsulated minerals | +0.6% | North America and Europe | Long term (≥ 4 years) |
| Plant-based and dairy-alternative nutrient parity | +0.4% | Europe, North America, with emerging signals in Australia and South Korea | Short term (≤ 2 years) |
| Faster reformulation through customer-specific premix platforms | +0.3% | Global | Short term (≤ 2 years) |
| Source: Mordor Intelligence | |||
Government-led staple-food fortification
National fortification policies are the market's most predictable demand engine, delivering consistent pull through procurement tenders and mandatory compliance alike. India's Cabinet in 2024 approved the continuation of fortified rice under the Pradhan Mantri Garib Kalyan Anna Yojana (PMGKAY) from July 2024 through December 2028, creating a sustained multi-year off-take for iron, folic acid, and vitamin B12 premixes across the public distribution system[1]. The United Kingdom's Bread and Flour (Amendment) Regulations 2024 mandated the addition of folic acid to non-wholemeal wheat flour effective December 2026, alongside updates to minimum levels for calcium, iron, and niacin, directly enlarging the addressable market for ingredient suppliers with GRAS/EU-approved grades[2]. The less-visible consequence of these mandates is that they function as de facto quality floors: once governments specify approved mineral forms and concentration ranges, suppliers without the corresponding regulatory dossiers are effectively excluded from large-volume tenders, creating a structural advantage for compliant incumbents and meaningful barriers for new entrants. The OECD's December 2024 framework on the regulatory governance of large-scale food fortification identifies enforcement continuity and monitoring as the critical gap in many national programs, suggesting that demand consistency, not just volume growth, remains a risk variable in emerging-market procurement.
Micronutrient deficiency and preventive health demand
Micronutrient inadequacy supports demand beyond government programs. A 2024 study covering 7.52 billion people in 185 countries estimated inadequate dietary intake from unfortified foods for 5.0 billion people for calcium, 4.9 billion for iron, and 5.1 billion for iodine. The study excluded the effects of fortification and supplementation, so broader program coverage has a direct link to ingredient needs. Government procurement and branded fortified products can retain baseline demand when discretionary consumer spending weakens. South Asia, Sub-Saharan Africa, and Southeast Asia combine high deficiency burdens with population growth and expanding fortified-staple programs. Calcium inadequacy is particularly acute among people aged 10 to 30 in these regions. This setting keeps the long-term demand base for the mineral enrichment ingredients market above current penetration levels.
Bioavailability-led premiumization of chelated and encapsulated minerals
The shift from inorganic mineral salts to bioavailable chelated and encapsulated forms represents the most decisive margin-expansion opportunity available to both ingredient suppliers and finished-product brands. Balchem's proprietary Albion Minerals amino acid chelate platform demonstrates approximately 3 times greater magnesium absorption compared to magnesium oxide or magnesium citrate in controlled testing, reflecting the performance differential that underpins premium. Research published in Nature Food (2025) demonstrated that oat protein nanofibril-iron hybrids achieved 46.2% geometric mean iron absorption, equivalent to 176% of the benchmark ferrous sulfate standard, when tested in iron-deficient women, pointing to a new generation of food-grade delivery systems beyond conventional chelation. The commercial implication is that bioavailability metrics are becoming the primary basis of competitive differentiation in both the supplement and clinical nutrition channels, creating a valuation wedge between commodity salt suppliers and science-backed specialty producers. GLP-1 receptor agonist adoption in the weight-management category has opened an unexpected pull for chelated magnesium and potassium products: users of these medications show clinically documented electrolyte losses, and brands are responding with GLP-1 companion mineral formulations that carry premium price points and repeat-purchase dynamics uncharacteristic of the broader market.
Plant-based and dairy-alternative nutrient parity
The rapid commercialization of plant-based dairy alternatives generates persistent mineral enrichment demand that differs qualitatively from traditional fortification. A 2024 cross-sectional UK retail survey published in the British Journal of Nutrition found that 466 plant-based alternatives existed in 2024, a 55% increase from 2020, yet iodine fortification covered only 48% of non-organic milk alternatives and calcium fortification, while higher, remained inconsistent across yogurt and cheese analogs[3]. A peer-reviewed study in the European Journal of Nutrition (2025) confirmed that replacing cow's milk with plant-based beverages in Australian diets reduces riboflavin, vitamin B12, and iodine intake significantly in the absence of fortification, validating industry pressure to fortify at higher rates. The mineral complexity in plant-based matrices, phytic acid, oxalates, and processing variables that affect mineral bioaccessibility means that standard inorganic mineral forms often perform poorly, pushing formulators toward chelated and microencapsulated grades. This is a tailwind specifically for bioavailability-focused suppliers, because it means the growth in plant-based volumes does not proportionally benefit commodity mineral and salt producers.
Restraints Impact Analysis of Mineral Enrichment Ingredients Market*
| Restraint | (~) % Impact on CAGR Forecast | Geographic Relevance | Impact Timeline |
|---|---|---|---|
| Regionally divergent fortification and health-claim rules | -0.5% | Global, with the highest friction in Europe, GCC, Japan, and Brazil | Medium term (2–4 years) |
| Raw-material and qualified-supplier concentration | -0.4% | Global | Short term (≤ 2 years) |
| Mineral interactions and sensory trade-offs in complex matrices | -0.3% | Global | Long term (≥ 4 years) |
| Sodium-reduction and consumer skepticism toward synthetic enrichment | -0.3% | North America and Europe | Medium term (2–4 years) |
| Source: Mordor Intelligence | |||
Regionally divergent fortification and health-claim rules
The absence of a globally harmonized mineral enrichment framework means that a supplier's approved ingredient portfolio in one jurisdiction may not transfer to another without costly re-registration, creating a capacity drag that is more consequential than it appears in aggregate market projections. Japan's March 2025 revision of its Food Labeling Standards (Shokuhin Hyōji Kijun) removed the blanket labeling exemption for fortification additives, requiring that enrichment ingredients previously disclosed only in technical documentation now appear in retail labeling, raising compliance and reformulation costs for finished-goods manufacturers. The same Consumer Affairs Agency finalized a review of "nutrient function food" (Eiyō Kinō Shokuhin) standards in 2025 that revised upper limits for zinc and copper downward while adjusting lower limits for calcium, iron, and zinc, changes that require ingredient suppliers to update product specifications and revalidate label claims. The OECD's December 2024 review of large-scale food fortification governance concluded that even within countries with mandatory programs, enforcement continuity varies substantially, meaning that procurement demand can be disrupted by monitoring gaps rather than policy reversals. For ingredient suppliers, the strategic response is building regulatory affairs capability as a differentiation tool rather than a pure cost center.
Sodium-reduction and consumer skepticism toward synthetic enrichment
The sodium segment's strong 4.46% CAGR in enrichment ingredients masks a structural tension within the broader sodium narrative: mass-market consumers continue to signal resistance to sodium reduction in packaged foods, undermining the reformulation cycles that typically accompany fortification innovation. A 2024 International Food Information Council (IFIC) survey of 1,000 US consumers found that 30% were unconcerned about sodium intake, and only 37% reported actively limiting consumption, a gap between stated health intent and actual purchase behavior that manufacturers have struggled to close for over a decade. Research from the University of Massachusetts Amherst quantified the behavioral offset: consumer purchasing adjustments wiped out approximately 90% of the sodium reduction achieved by manufacturers over the 8-year National Salt Reduction Initiative period, as shoppers compensated by selecting higher-sodium alternatives when reformulated products were introduced. The compound effect on mineral enrichment is two-fold: sodium-salt reformulation has stalled because brands fear taste penalties, limiting the category's ability to shift toward sodium compounds with different functional profiles, while consumer skepticism about synthetic ingredients extends to visible mineral fortification claims in clean-label contexts.
*Our forecasts treat driver/restraint impacts as directional, not additive. The impact forecasts reflect baseline growth, mix effects, and variable interactions.
Mineral Enrichment Ingredients Market Segment Analysis
By Ingredient Type:
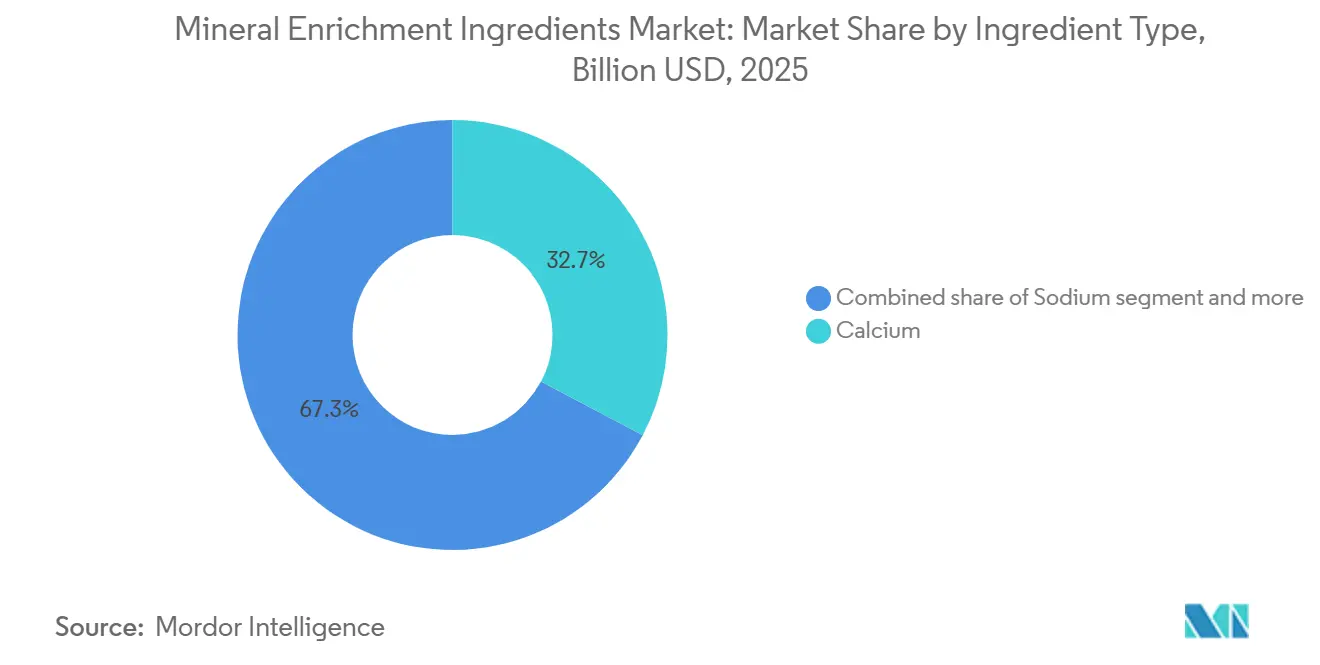
Calcium Anchors Volume, Functional Minerals AccelerateCalcium held 32.71% of the ingredient-type segment in 2025, making it the largest component of the mineral enrichment ingredients market share. Its position reflects use in dairy-alternative fortification, pediatric products, women’s health supplements, and staple-food programs. The United Kingdom flour rules and India’s fortification standards create complementary demand for calcium forms. Iron, zinc, and magnesium also have meaningful demand because of documented nutrient inadequacy. Iodine has a large deficiency burden but remains a smaller ingredient category because iodized salt programs use low-cost potassium iodate.
Sodium is forecast to be the fastest-growing ingredient type at a 4.46% CAGR through 2031. Growth comes from sodium citrate, ascorbate, and phosphate in electrolyte and sports nutrition products rather than conventional sodium chloride. Selenium, phosphorus, and potassium hold smaller positions supported by clinical and sports nutrition uses. Chromium and molybdenum attract interest in metabolic-health formulations, although from a smaller base. A 2025 Food Systems study reported that amino acid zinc chelates treated with ultrasound showed better bioaccessibility in bakery, beverage, and fermented-food matrices than conventional zinc salts. Form-specific limits under European and U.S. frameworks can favor more bioavailable mineral compounds where their supporting documentation is sufficient.

By Form:
Powder Dominates Formulation, Granule Gains Across Supplement ChannelsPowder held 65.62% of the form segment in 2025 because it fits the economics of bulk fortification. Powder premixes can be blended quickly and uniformly in flour milling, infant formula, and other high-volume applications. This keeps powder central to the mineral enrichment ingredients industry. Granule is expected to grow at a 5.11% CAGR through 2031. Stick packs, sachets, and direct-compression supplements benefit from the flowability, lower dust, and dosing control of granulated products. Granulation can also reduce interactions among minerals during storage.
This advantage becomes important in humid environments and in products that place iron and calcium close together. Encapsulated forms within the other-forms category serve more sophisticated supplement and clinical nutrition applications. A 2025 study reported greater iron bioaccessibility from lipid microencapsulation in extruded corn products than from ferrous sulfate. Mineral form can affect both sensory performance and the regulatory route to market. A mineral cleared as a powder may require a separate review as a granulate or microencapsulated ingredient. This adds development time but creates a barrier for suppliers without technical and regulatory resources.
By Application:
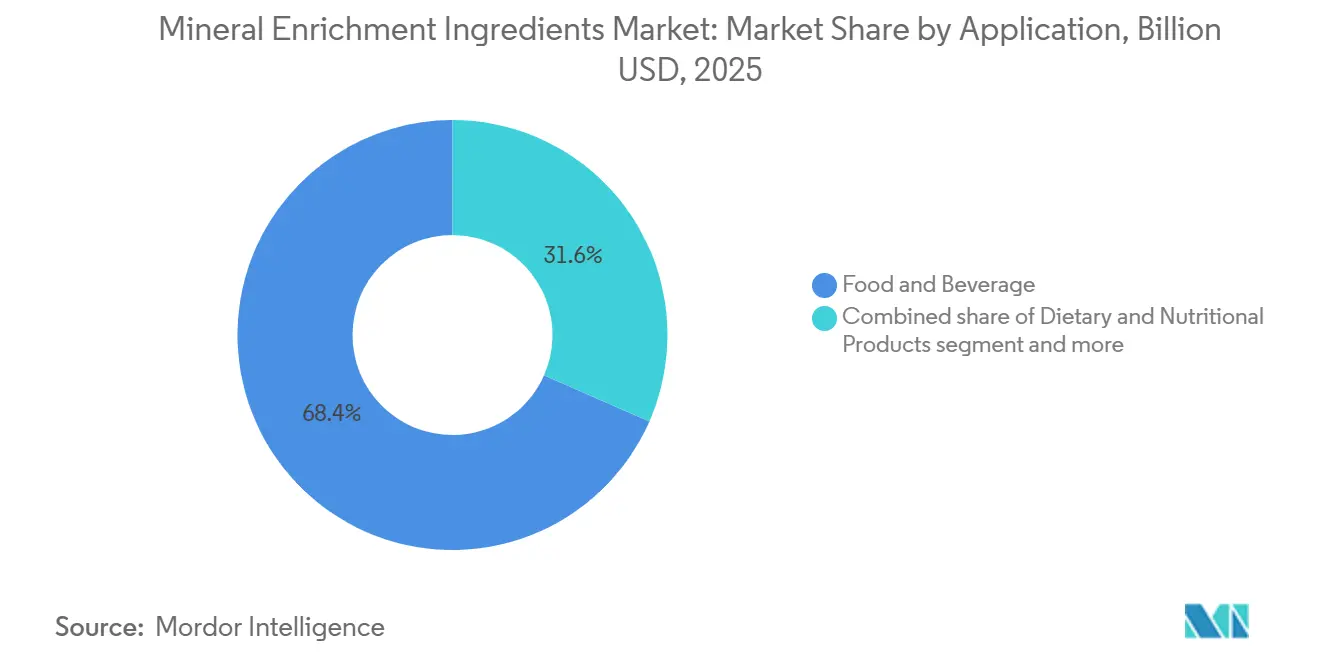
Food and Beverage Drives Volume, Supplement Channel Drives ValueFood and beverage held 68.42% of the application demand in 2025, accounting for the largest share of the mineral enrichment ingredients market size. The category includes dairy, bakery and confectionery, breakfast cereals, beverages, and staple foods. Dairy and staple-food applications have the strongest regulatory requirements, which support baseline volumes for calcium and iron. Sports drinks, functional ready-to-drink beverages, and plant-based milk alternatives place greater weight on the mineral form selected. Product performance can determine whether brands can support efficacy claims or avoid sensory problems.
Dietary and nutritional products are projected to grow at a 5.01% CAGR through 2031. Aging populations, bone and muscle health demand, GLP-1-related electrolyte needs, and preventive supplementation in middle-income Asian economies support this growth. Pharmaceuticals, personal care, and cosmetics use smaller volumes but carry higher purity requirements and higher value per unit. Innophos upgraded calcium phosphate manufacturing at its Chicago Heights facility in 2024 to meet European Commission grade specifications for food and dietary supplement applications. This investment reflects the importance of compliant specialty grades rather than standard commodity supply.
Geography Analysis
North America Mineral Enrichment Ingredients Market
North America held 33.90% of the global mineral enrichment ingredients market share in 2025. Mature fortification frameworks, nutrition-assistance programs, supplement consumption, and functional food innovation support this position. The United States drives demand for amino acid chelates and microencapsulated minerals in dietary supplements. Canada and Mexico add volume through domestic fortification programs that broadly align with U.S. standards. Mexico’s lower compliance rates create a divide between multinational-aligned manufacturers and smaller domestic producers.
Europe Mineral Enrichment Ingredients Market
Europe has strong consumer health awareness, but also demanding rules for ingredient claims and clean-label products. The United Kingdom’s flour rules create near-term demand for flour-grade calcium and iron from December 2026. Germany, France, and the Netherlands remain important supplement markets. Poland and the Benelux countries have growing private-label supplement sales. Cargill expanded its Engerwitzdorf, Austria, site by 50% in 2024 for micronutrition and health solutions. European review processes for novel foods and health claims can slow launches of new mineral forms.
APAC, South America and MEA Mineral Enrichment Ingredients Market
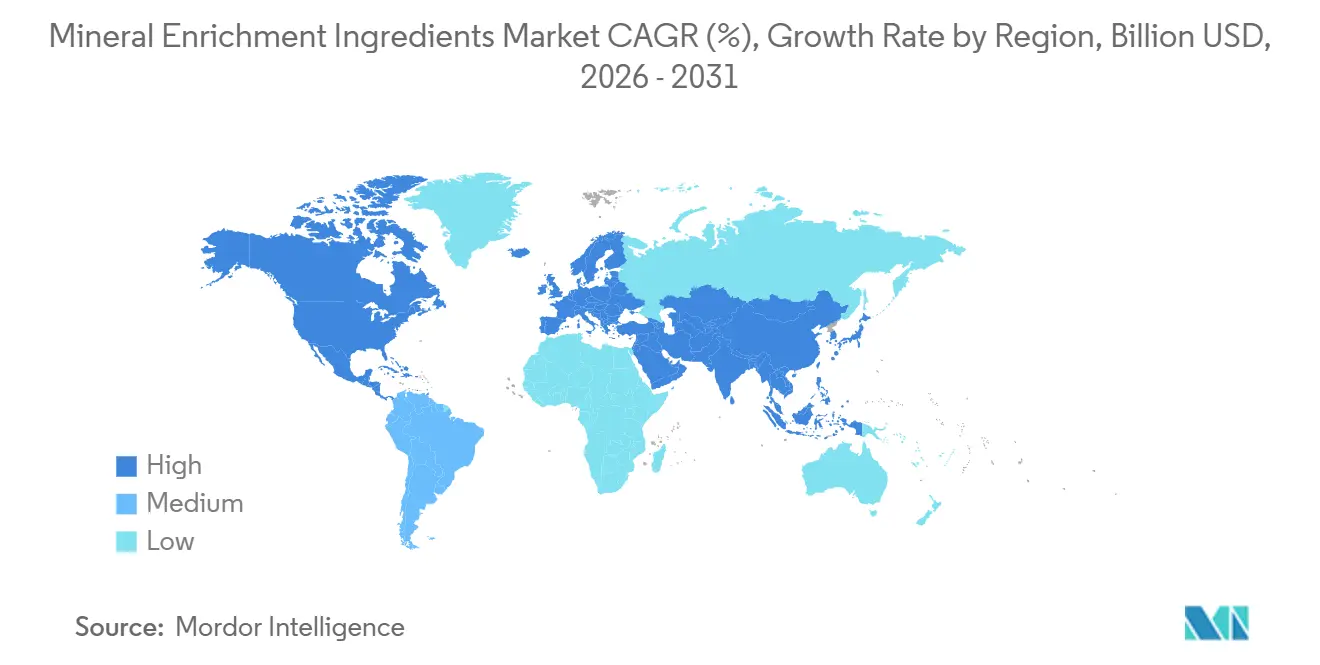
Asia-Pacific is forecast to expand at a 4.82% CAGR through 2031, the fastest regional rate in the mineral enrichment ingredients market. India, China, Indonesia, and Vietnam maintain active fortification programs that support public procurement demand. India’s fortified-rice program provides demand certainty for iron and folate premix suppliers through December 2028. Japan’s labeling changes and September 2026 GMP requirement raise quality expectations for supplements. China supports high-volume demand for calcium carbonate and iron salts through its large food-manufacturing base. South America, the Middle East, and Africa retain staple-food demand from programs covering wheat flour, edible oil, and dairy.
Competitive Landscape
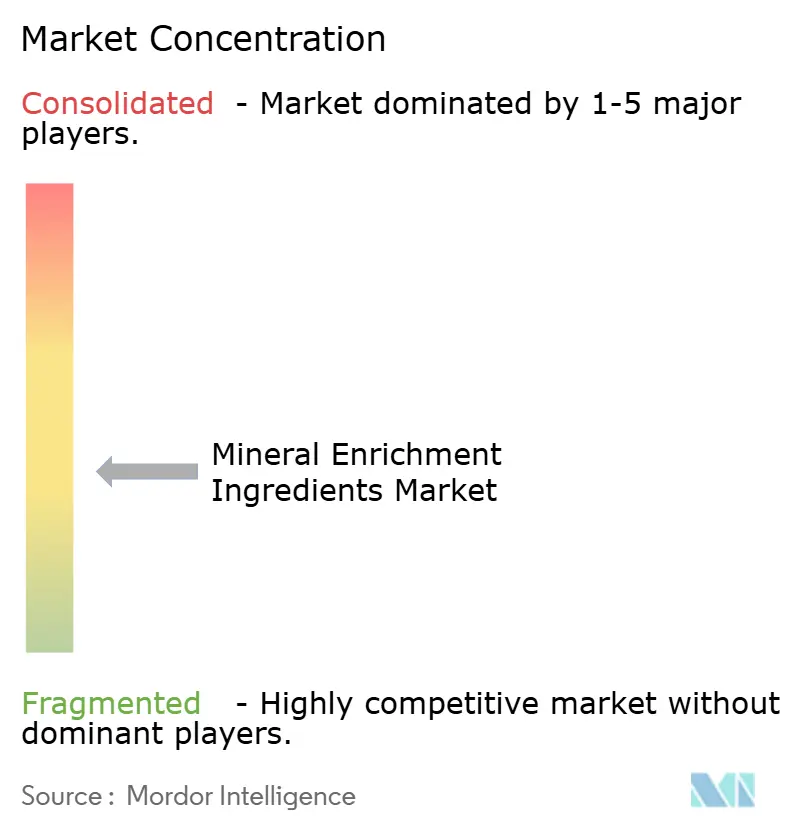
The mineral enrichment ingredients market has a moderately consolidated upper tier and a fragmented group of regional specialists. Balchem, DSM-Firmenich, Cargill, ADM, BASF, and Glanbia compete through proprietary technologies, regulatory dossiers, and integrated supply chains. Dr. Paul Lohmann, Jungbunzlauer, and Gadot Biochemical compete through mineral-salt purity and fermentation-derived credentials. Companies with chelation or encapsulation capabilities focus on premium nutrition channels. Commodity-scale providers concentrate production in lower-cost locations to defend tender business. This leaves customer-specific premix work as an opportunity for regional specialists.
In February 2026, DSM-Firmenich agreed to divest its Animal Nutrition and Health business to CVC Capital Partners at an enterprise value of EUR 2.2 billion, retaining a 20% equity stake. The agreement separates the business into an Essential Products Company and a Solutions Company. The move indicates pressure on more standardized premix supply and a focus on consumer nutrition, health, and beauty. In November 2025, Jungbunzlauer completed its acquisition of a production site in Thomson, Illinois, establishing its first U.S. manufacturing footprint. The site helps the company supply mineral salts and naturally derived ingredients closer to North American customers.
SternVitamin, Hexagon Nutrition, and Vitablend Nederland can address smaller, customized orders through regional regulatory knowledge and quicker product-development cycles. Balchem launched its Metalosate T.E.A.M. digital tissue-analysis platform in March 2026 to provide targeted chelated mineral recommendations for specialty crops. This platform shows how digital tools can support technical sales and customer retention, even though it serves a specialty-crop use case. ISO 22000 certification and FSSC 22000 accreditation are increasingly required for government procurement and major food manufacturer approval programs. These requirements raise the quality threshold for all suppliers. The mineral enrichment ingredients industry, therefore, rewards firms that combine mineral science, quality systems, and responsive premix development.
Mineral Enrichment Ingredients Industry Leaders
-
Balchem Corporation
-
Archer Daniels Midland Company
-
Cargill, Incorporated
-
dsm-firmenich AG
-
Corbion N.V.
- *Disclaimer: Major Players sorted in no particular order
Mineral Enrichment Ingredients Market Companies Covered in this Report
- Balchem Corporation
- Cargill, Incorporated
- Archer Daniels Midland Company
- dsm-firmenich AG
- Corbion N.V.
- Glanbia PLC
- Prinova Group LLC
- SternVitamin GmbH & Co. KG
- Dr. Paul Lohmann GmbH & Co. KGaA
- Jungbunzlauer Suisse AG
- Gadot Biochemical Industries Ltd.
- Kemin Industries, Inc.
- Zinpro Corporation
- Innophos Holdings, Inc.
- BASF SE
- Nutreco N.V.
- Barentz International B.V.
- Vitablend Nederland B.V.
- Hexagon Nutrition Limited
- Jubilant Ingrevia Limited
Recent Industry Developments in Mineral Enrichment Ingredients Market
- March 2026: Balchem Plant Nutrition launched the Metalosate T.E.A.M. (Tissue Evaluation and Management) digital platform, a free service that translated plant tissue analysis results into targeted chelated mineral nutrition recommendations for pest control advisors and agronomists. The platform used Balchem’s chelation research to improve specialty-crop mineral application precision and reduce unnecessary input costs.
- November 2025: Jungbunzlauer acquired a multipurpose production facility in Thomson, Illinois, from IFF, establishing its first US manufacturing site. The facility expanded its capacity to produce mineral salts and naturally derived ingredients for North American customers.
- June 2025: Cargill Animal Nutrition and Health launched a new feed production partnership with Biotech at the Tantangan Plant in Mindanao, Philippines, reinforcing Cargill's geographic footprint across Southeast Asian mineral nutrition supply chains and positioning the company to serve growing demand in the region's livestock and aquaculture sectors
Global Mineral Enrichment Ingredients Market Report Scope
Mineral enrichment ingredients are nutrient additives such as iron, calcium, zinc, and magnesium salts. The mineral enrichment ingredients report is segmented by ingredient type, form, application, and geography. By ingredient type, the market is segmented into calcium, iron, zinc, magnesium, potassium, sodium, phosphorus, iodine, selenium, and others. By form, the market is segmented into powder, granule, and others. By application, the market is segmented into food and beverage, dietary products, pharmaceuticals, personal care, and others. By geography, the market is segmented into North America, Europe, Asia-Pacific, South America, and the Middle East and Africa. The market forecasts are provided in terms of value (USD).
Segmentation Overview
| Calcium |
| Iron |
| Zinc |
| Magnesium |
| Potassium |
| Sodium |
| Phosphorus |
| Iodine |
| Selenium |
| Other Mineral Ingredients |
| Powder |
| Granule |
| Other Forms |
| Food and Beverage | Dairy Products |
| Bakery and Confectionery | |
| Breakfast Cereals | |
| Beverages | |
| Meat and Fish Products | |
| Ready-to-Eat Meals | |
| Snacks | |
| Staple Foods | |
| Other Food Products | |
| Dietary and Nutritional Products | |
| Pharmaceuticals | |
| Personal Care and Cosmetics | |
| Other End Uses |
| North America | United States |
| Canada | |
| Mexico | |
| Rest of North America | |
| Europe | United Kingdom |
| Germany | |
| France | |
| Italy | |
| Spain | |
| Sweden | |
| Belgium | |
| Poland | |
| Netherlands | |
| Rest of Europe | |
| Asia-Pacific | China |
| Japan | |
| India | |
| Thailand | |
| Singapore | |
| Indonesia | |
| South Korea | |
| Australia | |
| Rest of Asia-Pacific | |
| South America | Brazil |
| Argentina | |
| Colombia | |
| Peru | |
| Chile | |
| Rest of South America | |
| Middle East and Africa | United Arab Emirates |
| South Africa | |
| Saudi Arabia | |
| Nigeria | |
| Egypt | |
| Morocco | |
| Turkey | |
| Rest of Middle East and Africa |
| Ingredient Type | Calcium | |
| Iron | ||
| Zinc | ||
| Magnesium | ||
| Potassium | ||
| Sodium | ||
| Phosphorus | ||
| Iodine | ||
| Selenium | ||
| Other Mineral Ingredients | ||
| Form | Powder | |
| Granule | ||
| Other Forms | ||
| Application | Food and Beverage | Dairy Products |
| Bakery and Confectionery | ||
| Breakfast Cereals | ||
| Beverages | ||
| Meat and Fish Products | ||
| Ready-to-Eat Meals | ||
| Snacks | ||
| Staple Foods | ||
| Other Food Products | ||
| Dietary and Nutritional Products | ||
| Pharmaceuticals | ||
| Personal Care and Cosmetics | ||
| Other End Uses | ||
| Geography | North America | United States |
| Canada | ||
| Mexico | ||
| Rest of North America | ||
| Europe | United Kingdom | |
| Germany | ||
| France | ||
| Italy | ||
| Spain | ||
| Sweden | ||
| Belgium | ||
| Poland | ||
| Netherlands | ||
| Rest of Europe | ||
| Asia-Pacific | China | |
| Japan | ||
| India | ||
| Thailand | ||
| Singapore | ||
| Indonesia | ||
| South Korea | ||
| Australia | ||
| Rest of Asia-Pacific | ||
| South America | Brazil | |
| Argentina | ||
| Colombia | ||
| Peru | ||
| Chile | ||
| Rest of South America | ||
| Middle East and Africa | United Arab Emirates | |
| South Africa | ||
| Saudi Arabia | ||
| Nigeria | ||
| Egypt | ||
| Morocco | ||
| Turkey | ||
| Rest of Middle East and Africa | ||
Key Questions Answered in the Report
What is driving demand for mineral enrichment ingredients?
Fortified foods, deficiencies, and supplements drive demand. Government programs create recurring demand, while differentiated products require stable, pure, bioavailable minerals. The category is projected to grow at a 3.98% CAGR through 2031.
What is the projected value of the mineral enrichment ingredients market?
The market was valued at USD 1.63 billion in 2025 and is forecast to reach USD 2.03 billion by 2031. This expansion is tied to mandatory enrichment, food and beverage innovation, and premium dietary supplement formats.
Which mineral ingredient has the largest share?
Calcium held 32.71% of the ingredient-type segment in 2025. Its leading position reflects use in dairy-alternative fortification, staple foods, pediatric products, and women’s health supplements.
Which mineral ingredient is growing fastest?
Sodium is forecast to grow at a 4.46% CAGR through 2031. Growth is associated with specialty sodium compounds in electrolyte, sports nutrition, and performance-oriented formulations rather than conventional table salt.